Key Insights
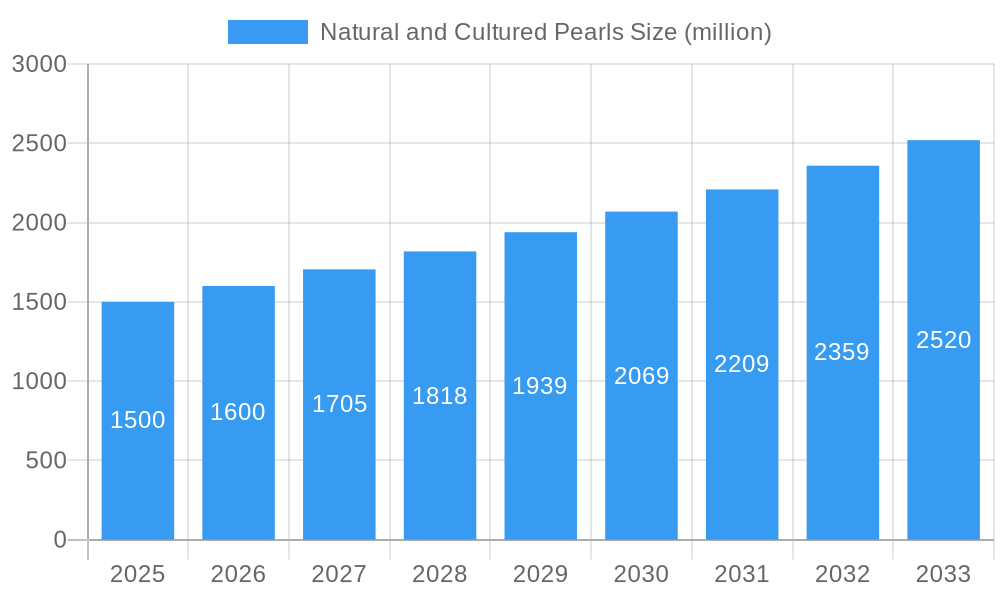
The global market for natural and cultured pearls is experiencing robust growth, projected to reach a substantial market size of approximately $1.5 billion by 2025. This expansion is fueled by a steadily increasing Compound Annual Growth Rate (CAGR) of around 6.5%, indicating a healthy and expanding industry. The primary drivers of this growth include the escalating demand for pearls in the jewelry sector, driven by their timeless elegance and appeal across various demographics, coupled with increasing consumer awareness and appreciation for their natural beauty and unique characteristics. Furthermore, the burgeoning use of pearls in the pharmaceutical industry, particularly for skincare products and traditional medicine, is contributing to market diversification and value creation. The market encompasses both natural pearls, prized for their rarity and organic formation, and cultured pearls, which are cultivated through human intervention, offering a wider range of options in terms of size, color, and affordability.
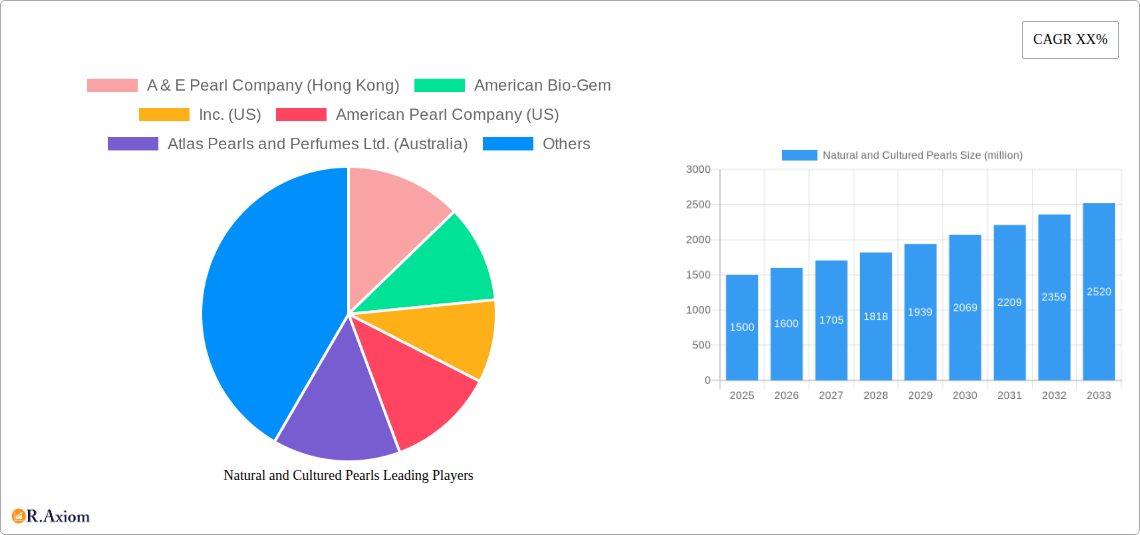
Natural and Cultured Pearls Market Size (In Billion)
The market is segmented by application, with jewelry accounting for the dominant share, reflecting its enduring popularity in adornment. The pharmaceutical segment, though smaller, presents significant growth potential due to ongoing research and development into the cosmetic and medicinal properties of pearls. Within types, both natural and cultured pearls command distinct market positions, with cultured pearls holding a larger market share due to their consistent quality and accessibility. Key trends shaping the market include a rising preference for sustainable and ethically sourced pearls, the influence of social media and celebrity endorsements on fashion trends, and advancements in pearl cultivation techniques that enhance quality and yield. Restraints such as the high cost of acquiring rare natural pearls and the potential for oversupply of certain cultured pearl varieties are being addressed through innovative marketing strategies and improved supply chain management. Leading companies like K.MIKIMOTO & CO.,LTD., Paspaley, and Atlas Pearls and Perfumes Ltd. are actively innovating and expanding their reach across key regions like Asia Pacific, North America, and Europe.
Natural and Cultured Pearls Company Market Share
Natural and Cultured Pearls Market Concentration & Innovation
The natural and cultured pearls market exhibits a moderate level of concentration, with a few key players dominating significant market share, estimated to be over $500 million in the luxury jewelry segment alone. Innovation is primarily driven by advancements in pearl cultivation techniques, leading to enhanced consistency in size, shape, and luster, and the development of novel pearl treatments to improve their visual appeal. Regulatory frameworks governing pearl sourcing, grading, and authenticity play a crucial role, ensuring consumer trust and market integrity. The threat of product substitutes, such as synthetic pearls and imitation gemstones, remains a constant, necessitating a focus on the unique value proposition of natural and cultured pearls. End-user trends show a growing demand for ethically sourced and traceable pearls, particularly among millennials and Gen Z consumers, driving a need for transparency in the supply chain. Mergers and acquisition (M&A) activities, while not as prevalent as in some other luxury goods sectors, have been observed, with deal values in the high tens of millions, consolidating market power and expanding product portfolios. Recent M&A activities are estimated at over $50 million in value.
Natural and Cultured Pearls Industry Trends & Insights
The global natural and cultured pearls market is poised for robust growth, projected to expand at a Compound Annual Growth Rate (CAGR) of approximately 6.5% during the forecast period of 2025–2033. This sustained expansion is fueled by a confluence of factors, including increasing disposable incomes in emerging economies, a burgeoning appreciation for luxury goods, and the enduring allure of pearls as symbols of elegance and sophistication. Technological advancements in pearl farming have been instrumental in increasing the supply of high-quality cultured pearls, making them more accessible to a broader consumer base. Innovations in oyster breeding and nucleation techniques have led to pearls with superior luster, size, and color consistency, directly impacting market penetration rates. The jewelry segment continues to be the dominant application, accounting for an estimated 95% of the market's revenue, with a market size projected to reach over $20 billion by 2033. The pharmaceutical segment, while niche, presents an intriguing growth avenue, with research exploring the potential benefits of pearl extracts in skincare and medicinal applications, though its market penetration remains under 5%. Consumer preferences are evolving, with a discernible shift towards personalized and ethically sourced jewelry. This trend is driving demand for pearls with unique characteristics and traceable origins, compelling manufacturers to emphasize sustainability and transparency in their operations. The competitive landscape is characterized by a mix of established luxury brands and specialized pearl cultivators, each vying for market share through product differentiation, marketing prowess, and strategic partnerships. Key market players are investing heavily in research and development to enhance pearl quality and explore new applications, thereby shaping the future trajectory of the industry. The overall market size is expected to reach approximately $22 billion by the end of the forecast period.
Dominant Markets & Segments in Natural and Cultured Pearls
The Jewelry segment is the undisputed leader within the natural and cultured pearls market, commanding an overwhelming market share estimated at over 95% and projected to reach a value of over $20 billion by 2033. This dominance stems from the timeless appeal of pearls as adornments, their association with luxury and special occasions, and their versatility in design. Within the jewelry segment, cultured pearls hold a significant advantage over natural pearls due to their consistent quality, availability, and a more predictable price point, making them accessible to a wider demographic. The nautral pearl segment, while representing a smaller fraction of the market (estimated at less than 5%), caters to a niche luxury market willing to pay a premium for rarity and organic uniqueness.
- Key Drivers for Jewelry Dominance:
- Evergreen Fashion Appeal: Pearls remain a classic and sophisticated choice for all ages and occasions, ensuring consistent demand.
- Rising Disposable Income: Particularly in emerging economies, a growing middle and upper class are investing in luxury jewelry.
- Branding and Marketing: Leading jewelry houses effectively position pearls as aspirational luxury items.
- Perceived Investment Value: High-quality natural and cultured pearls are often viewed as heirlooms and potential investments.
The Pharmaceutical segment, though nascent, is demonstrating promising growth potential. While its current market share is less than 5%, projected to reach approximately $1 billion by 2033, its significance lies in its innovative applications and future scalability. Research into the cosmetic and medicinal properties of pearl powder, such as its calcium content and purported skin-rejuvenating qualities, is driving this segment's expansion.
- Key Drivers for Pharmaceutical Growth:
- Growing Demand for Natural Ingredients in Cosmetics: Consumers are increasingly seeking natural and organic ingredients in beauty products.
- Advancements in Extraction and Processing Technologies: Enabling the efficient and pure extraction of beneficial compounds from pearls.
- Clinical Research and Endorsements: Positive research findings and endorsements from dermatologists and healthcare professionals will boost credibility.
- Expanding Nutraceutical Market: The rising popularity of supplements and functional foods could incorporate pearl-based ingredients.
Geographically, Asia-Pacific is expected to remain the dominant region, driven by its substantial pearl production capacity, particularly in Southeast Asia, and its rapidly growing consumer market for luxury goods. Countries like Japan, China, and India are key contributors to both production and consumption. The United States and Europe continue to be significant markets for high-end jewelry, with a strong demand for both natural and cultured pearls.
Natural and Cultured Pearls Product Developments
Product innovation in the natural and cultured pearls market centers on enhancing their inherent beauty and exploring new applications. Cultured pearls are seeing advancements in the consistency of their luster, size, and shape through refined nucleation and breeding techniques, offering a more predictable and desirable product for jewelry designers. Treatments to improve color saturation and orient the nacre are also gaining traction. In the burgeoning pharmaceutical segment, research is focused on developing highly purified pearl extracts for skincare formulations, leveraging their calcium and amino acid content for anti-aging and skin-brightening properties. These developments allow companies to offer unique value propositions and cater to evolving consumer demands for both aesthetic appeal and functional benefits.
Report Scope & Segmentation Analysis
This report provides a comprehensive analysis of the global natural and cultured pearls market from 2019 to 2033, with a base year of 2025. The market is segmented by Application into Jewelry and Pharmaceutical. The Jewelry segment is projected to experience a steady growth rate, driven by its established consumer base and ongoing demand for luxury adornments, reaching an estimated market size of over $20 billion by 2033. The Pharmaceutical segment, while currently smaller, is exhibiting a higher CAGR, fueled by emerging research and development in skincare and health supplements, with an estimated market size of approximately $1 billion by 2033. Further segmentation by Types includes Natural and Cultured pearls. Cultured pearls dominate the market due to their availability and consistency, while Natural pearls cater to a premium, niche segment.
Key Drivers of Natural and Cultured Pearls Growth
The growth of the natural and cultured pearls market is propelled by several key factors. Economically, rising disposable incomes globally, particularly in emerging markets, are increasing consumer spending on luxury goods, including pearls. Technologically, advancements in pearl cultivation techniques have led to improved quality, consistency, and yield, making cultured pearls more accessible. Regulatory frameworks that ensure the authenticity and ethical sourcing of pearls are building consumer confidence and fostering market stability. Furthermore, a growing appreciation for the natural beauty and timeless elegance of pearls, coupled with their symbolic value, continues to drive demand in the jewelry sector.
Challenges in the Natural and Cultured Pearls Sector
Despite its growth potential, the natural and cultured pearls sector faces several challenges. Regulatory hurdles related to import/export, grading standards, and consumer protection can impact market access and operational efficiency. Supply chain vulnerabilities, including the susceptibility of pearl oysters to environmental changes and diseases, can lead to price volatility and limited availability. The threat of synthetic and imitation pearls, while often distinguishable by experts, can still dilute market value and confuse consumers, necessitating continuous efforts in education and authentication. Intense competition among established brands and emerging players also puts pressure on profit margins.
Emerging Opportunities in Natural and Cultured Pearls
Emerging opportunities in the natural and cultured pearls market lie in the growing demand for sustainable and traceable pearls. Consumers are increasingly conscious of the ethical and environmental impact of their purchases, creating a market advantage for companies that can demonstrate responsible sourcing and production practices. The pharmaceutical segment presents a significant untapped opportunity, with ongoing research into the beneficial properties of pearls for skincare and health supplements. Furthermore, expanding into new geographic markets with growing luxury consumer bases and developing innovative marketing strategies that highlight the unique narrative and enduring appeal of pearls can unlock further growth potential.
Leading Players in the Natural and Cultured Pearls Market
- A & E Pearl Company (Hong Kong)
- American Bio-Gem, Inc. (US)
- American Pearl Company (US)
- Atlas Pearls and Perfumes Ltd. (Australia)
- Autore South Sea Pearls Pvt. Ltd. (Australia)
- K.MIKIMOTO & CO.,LTD. (Japan)
- Paspaley (Australia)
- Zhejiang Grace Pearl Jewelry Co.,Ltd. (Japan)
Key Developments in Natural and Cultured Pearls Industry
- 2023: Increased focus on sustainable pearl farming practices and traceability initiatives by major producers.
- 2023: Breakthroughs in research regarding the anti-aging properties of pearl extracts for cosmetic applications.
- 2022: Launch of new jewelry collections emphasizing unique, naturally colored pearls and unconventional pearl shapes.
- 2022: Notable M&A activity in the pearl cultivation sector, consolidating market share among key players.
- 2021: Enhanced digital marketing strategies adopted by leading companies to reach a global online customer base.
- 2020: Continued investment in genetic research for improved pearl oyster breeding and disease resistance.
Strategic Outlook for Natural and Cultured Pearls Market
The strategic outlook for the natural and cultured pearls market is highly positive, driven by enduring consumer demand and innovative product development. The market's trajectory will be shaped by a continued emphasis on sustainability, ethical sourcing, and transparency, appealing to a more conscious consumer base. Further exploration and commercialization of the pharmaceutical applications of pearls will unlock new revenue streams and diversify the market. Companies that invest in advanced cultivation techniques, enhance their branding and storytelling, and adapt to evolving consumer preferences for personalization and unique offerings will be well-positioned for sustained growth and market leadership. The estimated market size is expected to reach approximately $22 billion by the end of the forecast period.
Natural and Cultured Pearls Segmentation
-
1. Application
- 1.1. Jewelry
- 1.2. Pharmaceutical
-
2. Types
- 2.1. Nautral
- 2.2. Cultural
Natural and Cultured Pearls Segmentation By Geography
-
1. North America
- 1.1. United States
- 1.2. Canada
- 1.3. Mexico
-
2. South America
- 2.1. Brazil
- 2.2. Argentina
- 2.3. Rest of South America
-
3. Europe
- 3.1. United Kingdom
- 3.2. Germany
- 3.3. France
- 3.4. Italy
- 3.5. Spain
- 3.6. Russia
- 3.7. Benelux
- 3.8. Nordics
- 3.9. Rest of Europe
-
4. Middle East & Africa
- 4.1. Turkey
- 4.2. Israel
- 4.3. GCC
- 4.4. North Africa
- 4.5. South Africa
- 4.6. Rest of Middle East & Africa
-
5. Asia Pacific
- 5.1. China
- 5.2. India
- 5.3. Japan
- 5.4. South Korea
- 5.5. ASEAN
- 5.6. Oceania
- 5.7. Rest of Asia Pacific
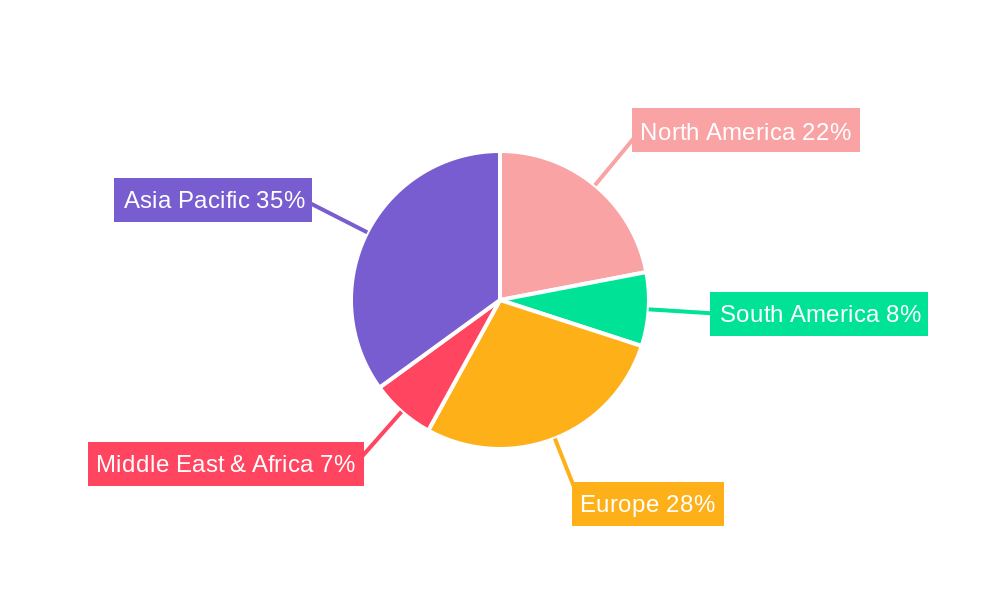
Natural and Cultured Pearls Regional Market Share
Geographic Coverage of Natural and Cultured Pearls
Natural and Cultured Pearls REPORT HIGHLIGHTS
| Aspects | Details |
|---|---|
| Study Period | 2020-2034 |
| Base Year | 2025 |
| Estimated Year | 2026 |
| Forecast Period | 2026-2034 |
| Historical Period | 2020-2025 |
| Growth Rate | CAGR of XX% from 2020-2034 |
| Segmentation |
|
Table of Contents
- 1. Introduction
- 1.1. Research Scope
- 1.2. Market Segmentation
- 1.3. Research Objective
- 1.4. Definitions and Assumptions
- 2. Executive Summary
- 2.1. Market Snapshot
- 3. Market Dynamics
- 3.1. Market Drivers
- 3.2. Market Restrains
- 3.3. Market Trends
- 3.4. Market Opportunities
- 4. Market Factor Analysis
- 4.1. Porters Five Forces
- 4.1.1. Bargaining Power of Suppliers
- 4.1.2. Bargaining Power of Buyers
- 4.1.3. Threat of New Entrants
- 4.1.4. Threat of Substitutes
- 4.1.5. Competitive Rivalry
- 4.2. PESTEL analysis
- 4.3. BCG Analysis
- 4.3.1. Stars (High Growth, High Market Share)
- 4.3.2. Cash Cows (Low Growth, High Market Share)
- 4.3.3. Question Mark (High Growth, Low Market Share)
- 4.3.4. Dogs (Low Growth, Low Market Share)
- 4.4. Ansoff Matrix Analysis
- 4.5. Supply Chain Analysis
- 4.6. Regulatory Landscape
- 4.7. Current Market Potential and Opportunity Assessment (TAM–SAM–SOM Framework)
- 4.8. RAX Analyst Note
- 4.1. Porters Five Forces
- 5. Market Analysis, Insights and Forecast 2021-2033
- 5.1. Market Analysis, Insights and Forecast - by Application
- 5.1.1. Jewelry
- 5.1.2. Pharmaceutical
- 5.2. Market Analysis, Insights and Forecast - by Types
- 5.2.1. Nautral
- 5.2.2. Cultural
- 5.3. Market Analysis, Insights and Forecast - by Region
- 5.3.1. North America
- 5.3.2. South America
- 5.3.3. Europe
- 5.3.4. Middle East & Africa
- 5.3.5. Asia Pacific
- 5.1. Market Analysis, Insights and Forecast - by Application
- 6. Global Natural and Cultured Pearls Analysis, Insights and Forecast, 2021-2033
- 6.1. Market Analysis, Insights and Forecast - by Application
- 6.1.1. Jewelry
- 6.1.2. Pharmaceutical
- 6.2. Market Analysis, Insights and Forecast - by Types
- 6.2.1. Nautral
- 6.2.2. Cultural
- 6.1. Market Analysis, Insights and Forecast - by Application
- 7. North America Natural and Cultured Pearls Analysis, Insights and Forecast, 2020-2032
- 7.1. Market Analysis, Insights and Forecast - by Application
- 7.1.1. Jewelry
- 7.1.2. Pharmaceutical
- 7.2. Market Analysis, Insights and Forecast - by Types
- 7.2.1. Nautral
- 7.2.2. Cultural
- 7.1. Market Analysis, Insights and Forecast - by Application
- 8. South America Natural and Cultured Pearls Analysis, Insights and Forecast, 2020-2032
- 8.1. Market Analysis, Insights and Forecast - by Application
- 8.1.1. Jewelry
- 8.1.2. Pharmaceutical
- 8.2. Market Analysis, Insights and Forecast - by Types
- 8.2.1. Nautral
- 8.2.2. Cultural
- 8.1. Market Analysis, Insights and Forecast - by Application
- 9. Europe Natural and Cultured Pearls Analysis, Insights and Forecast, 2020-2032
- 9.1. Market Analysis, Insights and Forecast - by Application
- 9.1.1. Jewelry
- 9.1.2. Pharmaceutical
- 9.2. Market Analysis, Insights and Forecast - by Types
- 9.2.1. Nautral
- 9.2.2. Cultural
- 9.1. Market Analysis, Insights and Forecast - by Application
- 10. Middle East & Africa Natural and Cultured Pearls Analysis, Insights and Forecast, 2020-2032
- 10.1. Market Analysis, Insights and Forecast - by Application
- 10.1.1. Jewelry
- 10.1.2. Pharmaceutical
- 10.2. Market Analysis, Insights and Forecast - by Types
- 10.2.1. Nautral
- 10.2.2. Cultural
- 10.1. Market Analysis, Insights and Forecast - by Application
- 11. Asia Pacific Natural and Cultured Pearls Analysis, Insights and Forecast, 2020-2032
- 11.1. Market Analysis, Insights and Forecast - by Application
- 11.1.1. Jewelry
- 11.1.2. Pharmaceutical
- 11.2. Market Analysis, Insights and Forecast - by Types
- 11.2.1. Nautral
- 11.2.2. Cultural
- 11.1. Market Analysis, Insights and Forecast - by Application
- 12. Competitive Analysis
- 12.1. Company Profiles
- 12.1.1 A & E Pearl Company (Hong Kong)
- 12.1.1.1. Company Overview
- 12.1.1.2. Products
- 12.1.1.3. Company Financials
- 12.1.1.4. SWOT Analysis
- 12.1.2 American Bio-Gem
- 12.1.2.1. Company Overview
- 12.1.2.2. Products
- 12.1.2.3. Company Financials
- 12.1.2.4. SWOT Analysis
- 12.1.3 Inc. (US)
- 12.1.3.1. Company Overview
- 12.1.3.2. Products
- 12.1.3.3. Company Financials
- 12.1.3.4. SWOT Analysis
- 12.1.4 American Pearl Company (US)
- 12.1.4.1. Company Overview
- 12.1.4.2. Products
- 12.1.4.3. Company Financials
- 12.1.4.4. SWOT Analysis
- 12.1.5 Atlas Pearls and Perfumes Ltd. (Australia)
- 12.1.5.1. Company Overview
- 12.1.5.2. Products
- 12.1.5.3. Company Financials
- 12.1.5.4. SWOT Analysis
- 12.1.6 Autore South Sea Pearls Pvt. Ltd. (Australia)
- 12.1.6.1. Company Overview
- 12.1.6.2. Products
- 12.1.6.3. Company Financials
- 12.1.6.4. SWOT Analysis
- 12.1.7 K.MIKIMOTO & CO.
- 12.1.7.1. Company Overview
- 12.1.7.2. Products
- 12.1.7.3. Company Financials
- 12.1.7.4. SWOT Analysis
- 12.1.8 LTD. (Japan)
- 12.1.8.1. Company Overview
- 12.1.8.2. Products
- 12.1.8.3. Company Financials
- 12.1.8.4. SWOT Analysis
- 12.1.9 Paspaley (Australia)
- 12.1.9.1. Company Overview
- 12.1.9.2. Products
- 12.1.9.3. Company Financials
- 12.1.9.4. SWOT Analysis
- 12.1.10 Zhejiang Grace Pearl Jewelry Co.
- 12.1.10.1. Company Overview
- 12.1.10.2. Products
- 12.1.10.3. Company Financials
- 12.1.10.4. SWOT Analysis
- 12.1.11 Ltd. (Japan)
- 12.1.11.1. Company Overview
- 12.1.11.2. Products
- 12.1.11.3. Company Financials
- 12.1.11.4. SWOT Analysis
- 12.1.1 A & E Pearl Company (Hong Kong)
- 12.2. Market Entropy
- 12.2.1 Company's Key Areas Served
- 12.2.2 Recent Developments
- 12.3. Company Market Share Analysis 2025
- 12.3.1 Top 5 Companies Market Share Analysis
- 12.3.2 Top 3 Companies Market Share Analysis
- 12.4. List of Potential Customers
- 13. Research Methodology
List of Figures
- Figure 1: Global Natural and Cultured Pearls Revenue Breakdown (million, %) by Region 2025 & 2033
- Figure 2: Global Natural and Cultured Pearls Volume Breakdown (K, %) by Region 2025 & 2033
- Figure 3: North America Natural and Cultured Pearls Revenue (million), by Application 2025 & 2033
- Figure 4: North America Natural and Cultured Pearls Volume (K), by Application 2025 & 2033
- Figure 5: North America Natural and Cultured Pearls Revenue Share (%), by Application 2025 & 2033
- Figure 6: North America Natural and Cultured Pearls Volume Share (%), by Application 2025 & 2033
- Figure 7: North America Natural and Cultured Pearls Revenue (million), by Types 2025 & 2033
- Figure 8: North America Natural and Cultured Pearls Volume (K), by Types 2025 & 2033
- Figure 9: North America Natural and Cultured Pearls Revenue Share (%), by Types 2025 & 2033
- Figure 10: North America Natural and Cultured Pearls Volume Share (%), by Types 2025 & 2033
- Figure 11: North America Natural and Cultured Pearls Revenue (million), by Country 2025 & 2033
- Figure 12: North America Natural and Cultured Pearls Volume (K), by Country 2025 & 2033
- Figure 13: North America Natural and Cultured Pearls Revenue Share (%), by Country 2025 & 2033
- Figure 14: North America Natural and Cultured Pearls Volume Share (%), by Country 2025 & 2033
- Figure 15: South America Natural and Cultured Pearls Revenue (million), by Application 2025 & 2033
- Figure 16: South America Natural and Cultured Pearls Volume (K), by Application 2025 & 2033
- Figure 17: South America Natural and Cultured Pearls Revenue Share (%), by Application 2025 & 2033
- Figure 18: South America Natural and Cultured Pearls Volume Share (%), by Application 2025 & 2033
- Figure 19: South America Natural and Cultured Pearls Revenue (million), by Types 2025 & 2033
- Figure 20: South America Natural and Cultured Pearls Volume (K), by Types 2025 & 2033
- Figure 21: South America Natural and Cultured Pearls Revenue Share (%), by Types 2025 & 2033
- Figure 22: South America Natural and Cultured Pearls Volume Share (%), by Types 2025 & 2033
- Figure 23: South America Natural and Cultured Pearls Revenue (million), by Country 2025 & 2033
- Figure 24: South America Natural and Cultured Pearls Volume (K), by Country 2025 & 2033
- Figure 25: South America Natural and Cultured Pearls Revenue Share (%), by Country 2025 & 2033
- Figure 26: South America Natural and Cultured Pearls Volume Share (%), by Country 2025 & 2033
- Figure 27: Europe Natural and Cultured Pearls Revenue (million), by Application 2025 & 2033
- Figure 28: Europe Natural and Cultured Pearls Volume (K), by Application 2025 & 2033
- Figure 29: Europe Natural and Cultured Pearls Revenue Share (%), by Application 2025 & 2033
- Figure 30: Europe Natural and Cultured Pearls Volume Share (%), by Application 2025 & 2033
- Figure 31: Europe Natural and Cultured Pearls Revenue (million), by Types 2025 & 2033
- Figure 32: Europe Natural and Cultured Pearls Volume (K), by Types 2025 & 2033
- Figure 33: Europe Natural and Cultured Pearls Revenue Share (%), by Types 2025 & 2033
- Figure 34: Europe Natural and Cultured Pearls Volume Share (%), by Types 2025 & 2033
- Figure 35: Europe Natural and Cultured Pearls Revenue (million), by Country 2025 & 2033
- Figure 36: Europe Natural and Cultured Pearls Volume (K), by Country 2025 & 2033
- Figure 37: Europe Natural and Cultured Pearls Revenue Share (%), by Country 2025 & 2033
- Figure 38: Europe Natural and Cultured Pearls Volume Share (%), by Country 2025 & 2033
- Figure 39: Middle East & Africa Natural and Cultured Pearls Revenue (million), by Application 2025 & 2033
- Figure 40: Middle East & Africa Natural and Cultured Pearls Volume (K), by Application 2025 & 2033
- Figure 41: Middle East & Africa Natural and Cultured Pearls Revenue Share (%), by Application 2025 & 2033
- Figure 42: Middle East & Africa Natural and Cultured Pearls Volume Share (%), by Application 2025 & 2033
- Figure 43: Middle East & Africa Natural and Cultured Pearls Revenue (million), by Types 2025 & 2033
- Figure 44: Middle East & Africa Natural and Cultured Pearls Volume (K), by Types 2025 & 2033
- Figure 45: Middle East & Africa Natural and Cultured Pearls Revenue Share (%), by Types 2025 & 2033
- Figure 46: Middle East & Africa Natural and Cultured Pearls Volume Share (%), by Types 2025 & 2033
- Figure 47: Middle East & Africa Natural and Cultured Pearls Revenue (million), by Country 2025 & 2033
- Figure 48: Middle East & Africa Natural and Cultured Pearls Volume (K), by Country 2025 & 2033
- Figure 49: Middle East & Africa Natural and Cultured Pearls Revenue Share (%), by Country 2025 & 2033
- Figure 50: Middle East & Africa Natural and Cultured Pearls Volume Share (%), by Country 2025 & 2033
- Figure 51: Asia Pacific Natural and Cultured Pearls Revenue (million), by Application 2025 & 2033
- Figure 52: Asia Pacific Natural and Cultured Pearls Volume (K), by Application 2025 & 2033
- Figure 53: Asia Pacific Natural and Cultured Pearls Revenue Share (%), by Application 2025 & 2033
- Figure 54: Asia Pacific Natural and Cultured Pearls Volume Share (%), by Application 2025 & 2033
- Figure 55: Asia Pacific Natural and Cultured Pearls Revenue (million), by Types 2025 & 2033
- Figure 56: Asia Pacific Natural and Cultured Pearls Volume (K), by Types 2025 & 2033
- Figure 57: Asia Pacific Natural and Cultured Pearls Revenue Share (%), by Types 2025 & 2033
- Figure 58: Asia Pacific Natural and Cultured Pearls Volume Share (%), by Types 2025 & 2033
- Figure 59: Asia Pacific Natural and Cultured Pearls Revenue (million), by Country 2025 & 2033
- Figure 60: Asia Pacific Natural and Cultured Pearls Volume (K), by Country 2025 & 2033
- Figure 61: Asia Pacific Natural and Cultured Pearls Revenue Share (%), by Country 2025 & 2033
- Figure 62: Asia Pacific Natural and Cultured Pearls Volume Share (%), by Country 2025 & 2033
List of Tables
- Table 1: Global Natural and Cultured Pearls Revenue million Forecast, by Application 2020 & 2033
- Table 2: Global Natural and Cultured Pearls Volume K Forecast, by Application 2020 & 2033
- Table 3: Global Natural and Cultured Pearls Revenue million Forecast, by Types 2020 & 2033
- Table 4: Global Natural and Cultured Pearls Volume K Forecast, by Types 2020 & 2033
- Table 5: Global Natural and Cultured Pearls Revenue million Forecast, by Region 2020 & 2033
- Table 6: Global Natural and Cultured Pearls Volume K Forecast, by Region 2020 & 2033
- Table 7: Global Natural and Cultured Pearls Revenue million Forecast, by Application 2020 & 2033
- Table 8: Global Natural and Cultured Pearls Volume K Forecast, by Application 2020 & 2033
- Table 9: Global Natural and Cultured Pearls Revenue million Forecast, by Types 2020 & 2033
- Table 10: Global Natural and Cultured Pearls Volume K Forecast, by Types 2020 & 2033
- Table 11: Global Natural and Cultured Pearls Revenue million Forecast, by Country 2020 & 2033
- Table 12: Global Natural and Cultured Pearls Volume K Forecast, by Country 2020 & 2033
- Table 13: United States Natural and Cultured Pearls Revenue (million) Forecast, by Application 2020 & 2033
- Table 14: United States Natural and Cultured Pearls Volume (K) Forecast, by Application 2020 & 2033
- Table 15: Canada Natural and Cultured Pearls Revenue (million) Forecast, by Application 2020 & 2033
- Table 16: Canada Natural and Cultured Pearls Volume (K) Forecast, by Application 2020 & 2033
- Table 17: Mexico Natural and Cultured Pearls Revenue (million) Forecast, by Application 2020 & 2033
- Table 18: Mexico Natural and Cultured Pearls Volume (K) Forecast, by Application 2020 & 2033
- Table 19: Global Natural and Cultured Pearls Revenue million Forecast, by Application 2020 & 2033
- Table 20: Global Natural and Cultured Pearls Volume K Forecast, by Application 2020 & 2033
- Table 21: Global Natural and Cultured Pearls Revenue million Forecast, by Types 2020 & 2033
- Table 22: Global Natural and Cultured Pearls Volume K Forecast, by Types 2020 & 2033
- Table 23: Global Natural and Cultured Pearls Revenue million Forecast, by Country 2020 & 2033
- Table 24: Global Natural and Cultured Pearls Volume K Forecast, by Country 2020 & 2033
- Table 25: Brazil Natural and Cultured Pearls Revenue (million) Forecast, by Application 2020 & 2033
- Table 26: Brazil Natural and Cultured Pearls Volume (K) Forecast, by Application 2020 & 2033
- Table 27: Argentina Natural and Cultured Pearls Revenue (million) Forecast, by Application 2020 & 2033
- Table 28: Argentina Natural and Cultured Pearls Volume (K) Forecast, by Application 2020 & 2033
- Table 29: Rest of South America Natural and Cultured Pearls Revenue (million) Forecast, by Application 2020 & 2033
- Table 30: Rest of South America Natural and Cultured Pearls Volume (K) Forecast, by Application 2020 & 2033
- Table 31: Global Natural and Cultured Pearls Revenue million Forecast, by Application 2020 & 2033
- Table 32: Global Natural and Cultured Pearls Volume K Forecast, by Application 2020 & 2033
- Table 33: Global Natural and Cultured Pearls Revenue million Forecast, by Types 2020 & 2033
- Table 34: Global Natural and Cultured Pearls Volume K Forecast, by Types 2020 & 2033
- Table 35: Global Natural and Cultured Pearls Revenue million Forecast, by Country 2020 & 2033
- Table 36: Global Natural and Cultured Pearls Volume K Forecast, by Country 2020 & 2033
- Table 37: United Kingdom Natural and Cultured Pearls Revenue (million) Forecast, by Application 2020 & 2033
- Table 38: United Kingdom Natural and Cultured Pearls Volume (K) Forecast, by Application 2020 & 2033
- Table 39: Germany Natural and Cultured Pearls Revenue (million) Forecast, by Application 2020 & 2033
- Table 40: Germany Natural and Cultured Pearls Volume (K) Forecast, by Application 2020 & 2033
- Table 41: France Natural and Cultured Pearls Revenue (million) Forecast, by Application 2020 & 2033
- Table 42: France Natural and Cultured Pearls Volume (K) Forecast, by Application 2020 & 2033
- Table 43: Italy Natural and Cultured Pearls Revenue (million) Forecast, by Application 2020 & 2033
- Table 44: Italy Natural and Cultured Pearls Volume (K) Forecast, by Application 2020 & 2033
- Table 45: Spain Natural and Cultured Pearls Revenue (million) Forecast, by Application 2020 & 2033
- Table 46: Spain Natural and Cultured Pearls Volume (K) Forecast, by Application 2020 & 2033
- Table 47: Russia Natural and Cultured Pearls Revenue (million) Forecast, by Application 2020 & 2033
- Table 48: Russia Natural and Cultured Pearls Volume (K) Forecast, by Application 2020 & 2033
- Table 49: Benelux Natural and Cultured Pearls Revenue (million) Forecast, by Application 2020 & 2033
- Table 50: Benelux Natural and Cultured Pearls Volume (K) Forecast, by Application 2020 & 2033
- Table 51: Nordics Natural and Cultured Pearls Revenue (million) Forecast, by Application 2020 & 2033
- Table 52: Nordics Natural and Cultured Pearls Volume (K) Forecast, by Application 2020 & 2033
- Table 53: Rest of Europe Natural and Cultured Pearls Revenue (million) Forecast, by Application 2020 & 2033
- Table 54: Rest of Europe Natural and Cultured Pearls Volume (K) Forecast, by Application 2020 & 2033
- Table 55: Global Natural and Cultured Pearls Revenue million Forecast, by Application 2020 & 2033
- Table 56: Global Natural and Cultured Pearls Volume K Forecast, by Application 2020 & 2033
- Table 57: Global Natural and Cultured Pearls Revenue million Forecast, by Types 2020 & 2033
- Table 58: Global Natural and Cultured Pearls Volume K Forecast, by Types 2020 & 2033
- Table 59: Global Natural and Cultured Pearls Revenue million Forecast, by Country 2020 & 2033
- Table 60: Global Natural and Cultured Pearls Volume K Forecast, by Country 2020 & 2033
- Table 61: Turkey Natural and Cultured Pearls Revenue (million) Forecast, by Application 2020 & 2033
- Table 62: Turkey Natural and Cultured Pearls Volume (K) Forecast, by Application 2020 & 2033
- Table 63: Israel Natural and Cultured Pearls Revenue (million) Forecast, by Application 2020 & 2033
- Table 64: Israel Natural and Cultured Pearls Volume (K) Forecast, by Application 2020 & 2033
- Table 65: GCC Natural and Cultured Pearls Revenue (million) Forecast, by Application 2020 & 2033
- Table 66: GCC Natural and Cultured Pearls Volume (K) Forecast, by Application 2020 & 2033
- Table 67: North Africa Natural and Cultured Pearls Revenue (million) Forecast, by Application 2020 & 2033
- Table 68: North Africa Natural and Cultured Pearls Volume (K) Forecast, by Application 2020 & 2033
- Table 69: South Africa Natural and Cultured Pearls Revenue (million) Forecast, by Application 2020 & 2033
- Table 70: South Africa Natural and Cultured Pearls Volume (K) Forecast, by Application 2020 & 2033
- Table 71: Rest of Middle East & Africa Natural and Cultured Pearls Revenue (million) Forecast, by Application 2020 & 2033
- Table 72: Rest of Middle East & Africa Natural and Cultured Pearls Volume (K) Forecast, by Application 2020 & 2033
- Table 73: Global Natural and Cultured Pearls Revenue million Forecast, by Application 2020 & 2033
- Table 74: Global Natural and Cultured Pearls Volume K Forecast, by Application 2020 & 2033
- Table 75: Global Natural and Cultured Pearls Revenue million Forecast, by Types 2020 & 2033
- Table 76: Global Natural and Cultured Pearls Volume K Forecast, by Types 2020 & 2033
- Table 77: Global Natural and Cultured Pearls Revenue million Forecast, by Country 2020 & 2033
- Table 78: Global Natural and Cultured Pearls Volume K Forecast, by Country 2020 & 2033
- Table 79: China Natural and Cultured Pearls Revenue (million) Forecast, by Application 2020 & 2033
- Table 80: China Natural and Cultured Pearls Volume (K) Forecast, by Application 2020 & 2033
- Table 81: India Natural and Cultured Pearls Revenue (million) Forecast, by Application 2020 & 2033
- Table 82: India Natural and Cultured Pearls Volume (K) Forecast, by Application 2020 & 2033
- Table 83: Japan Natural and Cultured Pearls Revenue (million) Forecast, by Application 2020 & 2033
- Table 84: Japan Natural and Cultured Pearls Volume (K) Forecast, by Application 2020 & 2033
- Table 85: South Korea Natural and Cultured Pearls Revenue (million) Forecast, by Application 2020 & 2033
- Table 86: South Korea Natural and Cultured Pearls Volume (K) Forecast, by Application 2020 & 2033
- Table 87: ASEAN Natural and Cultured Pearls Revenue (million) Forecast, by Application 2020 & 2033
- Table 88: ASEAN Natural and Cultured Pearls Volume (K) Forecast, by Application 2020 & 2033
- Table 89: Oceania Natural and Cultured Pearls Revenue (million) Forecast, by Application 2020 & 2033
- Table 90: Oceania Natural and Cultured Pearls Volume (K) Forecast, by Application 2020 & 2033
- Table 91: Rest of Asia Pacific Natural and Cultured Pearls Revenue (million) Forecast, by Application 2020 & 2033
- Table 92: Rest of Asia Pacific Natural and Cultured Pearls Volume (K) Forecast, by Application 2020 & 2033
Frequently Asked Questions
1. What is the projected Compound Annual Growth Rate (CAGR) of the Natural and Cultured Pearls?
The projected CAGR is approximately XX%.
2. Which companies are prominent players in the Natural and Cultured Pearls?
Key companies in the market include A & E Pearl Company (Hong Kong), American Bio-Gem, Inc. (US), American Pearl Company (US), Atlas Pearls and Perfumes Ltd. (Australia), Autore South Sea Pearls Pvt. Ltd. (Australia), K.MIKIMOTO & CO., LTD. (Japan), Paspaley (Australia), Zhejiang Grace Pearl Jewelry Co., Ltd. (Japan).
3. What are the main segments of the Natural and Cultured Pearls?
The market segments include Application, Types.
4. Can you provide details about the market size?
The market size is estimated to be USD XXX million as of 2022.
5. What are some drivers contributing to market growth?
N/A
6. What are the notable trends driving market growth?
N/A
7. Are there any restraints impacting market growth?
N/A
8. Can you provide examples of recent developments in the market?
N/A
9. What pricing options are available for accessing the report?
Pricing options include single-user, multi-user, and enterprise licenses priced at USD 3350.00, USD 5025.00, and USD 6700.00 respectively.
10. Is the market size provided in terms of value or volume?
The market size is provided in terms of value, measured in million and volume, measured in K.
11. Are there any specific market keywords associated with the report?
Yes, the market keyword associated with the report is "Natural and Cultured Pearls," which aids in identifying and referencing the specific market segment covered.
12. How do I determine which pricing option suits my needs best?
The pricing options vary based on user requirements and access needs. Individual users may opt for single-user licenses, while businesses requiring broader access may choose multi-user or enterprise licenses for cost-effective access to the report.
13. Are there any additional resources or data provided in the Natural and Cultured Pearls report?
While the report offers comprehensive insights, it's advisable to review the specific contents or supplementary materials provided to ascertain if additional resources or data are available.
14. How can I stay updated on further developments or reports in the Natural and Cultured Pearls?
To stay informed about further developments, trends, and reports in the Natural and Cultured Pearls, consider subscribing to industry newsletters, following relevant companies and organizations, or regularly checking reputable industry news sources and publications.
Methodology
Step 1 - Identification of Relevant Samples Size from Population Database


Step 2 - Approaches for Defining Global Market Size (Value, Volume* & Price*)

Note*: In applicable scenarios
Step 3 - Data Sources
Primary Research
- Web Analytics
- Survey Reports
- Research Institute
- Latest Research Reports
- Opinion Leaders
Secondary Research
- Annual Reports
- White Paper
- Latest Press Release
- Industry Association
- Paid Database
- Investor Presentations

Step 4 - Data Triangulation
Involves using different sources of information in order to increase the validity of a study
These sources are likely to be stakeholders in a program - participants, other researchers, program staff, other community members, and so on.
Then we put all data in single framework & apply various statistical tools to find out the dynamic on the market.
During the analysis stage, feedback from the stakeholder groups would be compared to determine areas of agreement as well as areas of divergence

