
Key Insights
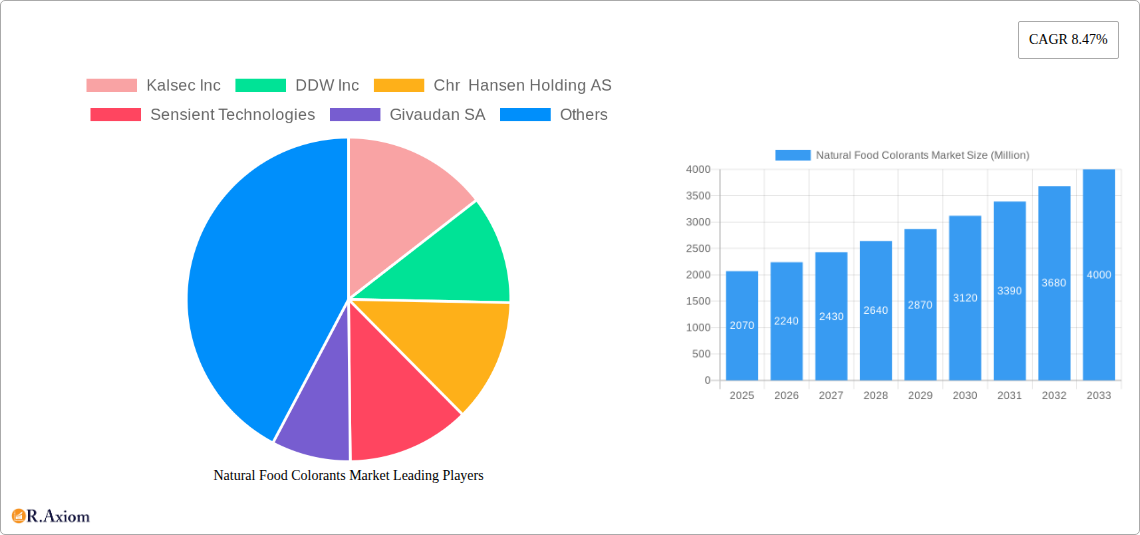
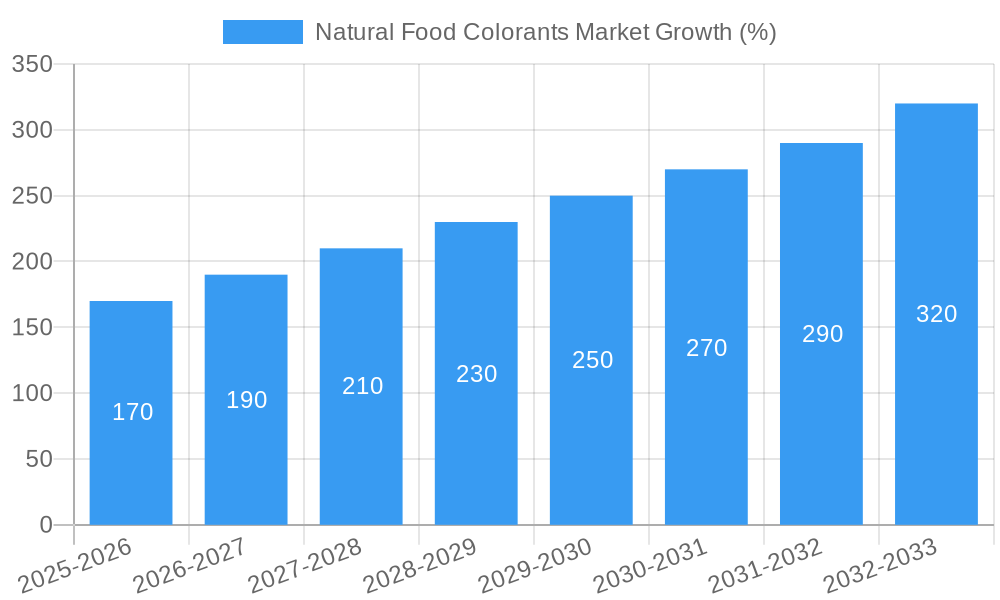
The global natural food colorants market, valued at $2.07 billion in 2025, is projected to experience robust growth, driven by a rising consumer preference for clean-label products and a growing awareness of the health implications of artificial additives. The market's Compound Annual Growth Rate (CAGR) of 8.47% from 2019 to 2024 indicates a significant upward trajectory, expected to continue through 2033. Key drivers include the increasing demand for natural and organic food products across various applications, including bakery, dairy, confectionery, beverages, nutraceuticals, and snacks. The rising prevalence of food allergies and intolerances further fuels the demand for natural alternatives to synthetic colorants. Growth is also propelled by innovations in extraction techniques and the development of new, stable natural colorants with improved color intensity and performance characteristics. However, challenges remain, including the higher cost of natural colorants compared to synthetic counterparts and potential supply chain limitations for certain raw materials. Despite these restraints, the market is segmented by application, with bakery and dairy-based products leading the demand, followed by confectionery and beverages. Major players like Kalsec Inc, DDW Inc, Chr. Hansen Holding AS, and Sensient Technologies are actively investing in research and development, expanding their product portfolios, and pursuing strategic partnerships to capitalize on the market's growth potential. The Asia-Pacific region, especially China and India, is expected to witness substantial growth due to expanding consumer populations and increased disposable incomes.
The competitive landscape is characterized by both established multinational corporations and smaller specialized players. Companies are focusing on enhancing the stability and performance of natural food colorants to meet the stringent quality standards of the food industry. Product innovation is a key strategic focus, encompassing the development of new color shades and formulations for specific applications. Furthermore, the market is witnessing increased mergers and acquisitions, demonstrating the growing interest and investment in the natural food colorants sector. The shift towards sustainable and ethically sourced ingredients is also influencing the market, with manufacturers prioritizing transparency and traceability in their supply chains. Considering the projected CAGR and market trends, a conservative estimate suggests the market will exceed $4 billion by 2033, showcasing the significant growth opportunities in this dynamic sector.
Natural Food Colorants Market: A Comprehensive Report (2019-2033)
This detailed report provides a comprehensive analysis of the Natural Food Colorants Market, offering invaluable insights for industry stakeholders, investors, and strategic decision-makers. The study period spans from 2019 to 2033, with 2025 serving as the base and estimated year. The report utilizes a robust methodology, incorporating historical data (2019-2024) and forecast data (2025-2033) to provide a comprehensive view of market dynamics. The market is valued at xx Million in 2025 and is projected to reach xx Million by 2033, exhibiting a CAGR of xx%.
Natural Food Colorants Market Concentration & Innovation
This section delves into the competitive landscape of the natural food colorants market, analyzing market concentration, innovation drivers, regulatory frameworks, product substitutes, end-user trends, and M&A activities. The market is characterized by the presence of both large multinational corporations and smaller specialized companies. Key players like Kalsec Inc, DDW Inc, Chr. Hansen Holding AS, Sensient Technologies, Givaudan SA, Koninklijke DSM NV, Synthite Industries Private Ltd, Symrise AG, and Archer Daniels Midland Company hold significant market share, though the exact figures vary across segments. The market share of the top 5 players is estimated at xx%, indicating a moderately consolidated market.
- Market Concentration: The market exhibits moderate concentration, with a few large players holding significant market share.
- Innovation Drivers: Growing consumer demand for natural and clean-label products, coupled with technological advancements in extraction and processing, are key innovation drivers.
- Regulatory Frameworks: Stringent regulations concerning food safety and labeling are influencing market dynamics, driving the adoption of natural colorants.
- Product Substitutes: Artificial food colorants remain a significant substitute; however, growing health concerns and consumer preferences are shifting demand towards natural alternatives.
- End-User Trends: The increasing popularity of plant-based foods and beverages is driving demand for natural colorants in these segments.
- M&A Activities: Several significant M&A activities have reshaped the market, including Givaudan SA’s acquisition of Naturex in 2018, impacting market share and competitive dynamics. The total value of M&A deals in the past five years is estimated at xx Million.
Natural Food Colorants Market Industry Trends & Insights
This section provides a detailed analysis of the market's growth trajectory, exploring key drivers, technological advancements, evolving consumer preferences, and the competitive landscape. The market is experiencing robust growth driven by the increasing demand for natural and clean-label products across various food and beverage categories. Technological advancements in extraction and processing methods have led to the development of more stable and versatile natural colorants. Consumer preference for healthier food choices is a primary driver, pushing manufacturers to replace synthetic alternatives. The competitive dynamics are characterized by intense competition among established players and emerging companies, with innovation and product diversification playing a crucial role. The market penetration of natural food colorants is steadily rising, currently estimated at xx% and projected to reach xx% by 2033.
Dominant Markets & Segments in Natural Food Colorants Market
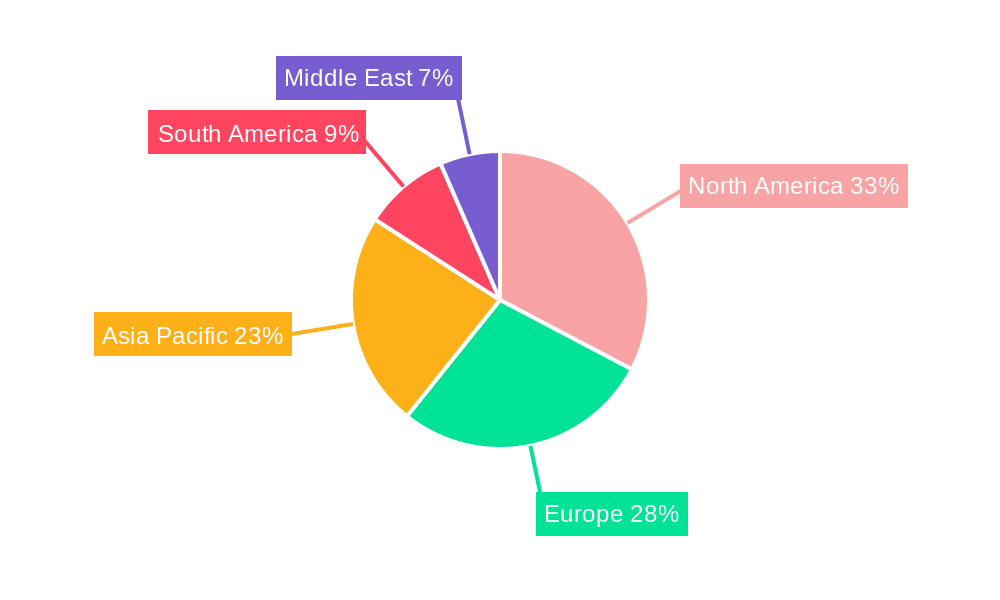
This section identifies the leading regions, countries, and application segments within the natural food colorants market. While precise regional dominance data is not available, the market is projected to experience significant growth across various regions, with North America and Europe currently holding considerable market share. Specific country-level data is limited, but the United States and several European countries are expected to be key markets due to high consumer demand.
By Application:
- Bakery: This segment holds a significant market share due to the extensive use of colorants in baked goods to enhance visual appeal. Key drivers include changing consumer preferences for natural colors in baked goods.
- Dairy-based Products: The dairy industry’s adoption of natural colorants is significant. Market growth in this segment is fueled by the demand for naturally colored yogurt, ice cream, and cheese.
- Beverages: The beverage sector is a rapidly expanding application area for natural colorants, boosted by the increasing demand for naturally colored juices, soft drinks, and alcoholic beverages.
- Non-alcoholic Beverages: This segment is experiencing rapid growth driven by increasing consumer preference for clean-label beverages.
- Confectionery: The confectionery industry is a major consumer of natural food colorants, primarily to enhance the visual appeal of products and provide a 'natural' image.
- Nutraceuticals: This segment’s growth is being fueled by the increasing demand for functional foods and dietary supplements.
- Snacks and Cereals: The popularity of convenient snack foods and cereals is influencing the growth of this segment.
- Other Applications: This segment includes various other applications like pharmaceuticals, cosmetics, and pet food.
Natural Food Colorants Market Product Developments
Recent years have witnessed significant advancements in natural food colorants, with a focus on developing more stable, versatile, and cost-effective solutions. Companies are investing in research and development to create natural colorants that meet the specific requirements of different food applications, such as heat stability and pH tolerance. Technological advancements in extraction and processing techniques, as well as the use of innovative ingredients, are driving product innovation. This includes the development of new shades and hues to cater to diverse consumer preferences.
Report Scope & Segmentation Analysis
This report provides a detailed segmentation analysis of the Natural Food Colorants Market based on application: Bakery, Dairy-based Products, Beverages, Non-alcoholic Beverages, Confectionery, Nutraceuticals, Snacks and Cereals, and Other Applications. Each segment's growth projections, market sizes, and competitive dynamics are analyzed. For example, the Bakery segment is projected to experience strong growth driven by increasing demand for naturally colored baked goods, while the Beverage segment is expected to exhibit robust growth due to the increasing popularity of naturally colored drinks. Detailed market size information for each segment is unavailable at this time and will be included in the full report.
Key Drivers of Natural Food Colorants Market Growth
The Natural Food Colorants market is experiencing robust growth due to several factors. The growing consumer preference for natural and clean-label products is a major driver. Increased awareness of the potential health risks associated with artificial food colorants is further propelling market expansion. Technological advancements in extraction and processing methods are enabling the production of more stable and versatile natural colorants. Stringent regulations concerning food safety and labeling are also driving the adoption of natural colorants.
Challenges in the Natural Food Colorants Market Sector
Despite the market's growth potential, several challenges exist. The relatively high cost of natural colorants compared to their artificial counterparts can limit their adoption, especially in price-sensitive markets. The variability in the color intensity and stability of natural colorants can also pose challenges. Supply chain issues and the availability of raw materials can impact production and pricing. Intense competition among established players and emerging companies adds to the complexities of the market.
Emerging Opportunities in Natural Food Colorants Market
The Natural Food Colorants Market presents several emerging opportunities. The growing demand for natural colors in functional foods and nutraceuticals opens new avenues for market expansion. Exploring and developing innovative extraction and processing technologies can create more sustainable and efficient production methods. The increasing interest in personalized nutrition and customized food products creates opportunities to tailor-make color solutions for specific applications. Expansion into new geographic markets, particularly in developing economies, offers considerable growth potential.
Leading Players in the Natural Food Colorants Market Market
- Kalsec Inc
- DDW Inc
- Chr. Hansen Holding AS
- Sensient Technologies
- Givaudan SA
- Koninklijke DSM NV
- Synthite Industries Private Ltd
- Symrise AG
- Archer Daniels Midland Company *List Not Exhaustive
Key Developments in Natural Food Colorants Market Industry
- January 2021: GNT Group launched EXBERRY® Shade Pink - OD, a new pink coloring agent for fat-based applications.
- October 2020: Chr. Hansen Natural Colors established an R&D center in Montpellier, France, focusing on green, blue, and brown hues.
- September 2018: Givaudan SA acquired Naturex, expanding its natural ingredient portfolio.
- April 2016: Sensient® Colors launched SupraRed™, a heat-stable natural red color for baking and dry grocery products.
Strategic Outlook for Natural Food Colorants Market Market
The Natural Food Colorants market is poised for continued growth, driven by the increasing demand for natural and healthy food products. Innovation in extraction technologies and the development of new, stable colorants will further propel market expansion. Companies focusing on sustainability and traceability will gain a competitive edge. Expansion into emerging markets and the development of customized solutions for specific applications will also contribute to future market growth.
Natural Food Colorants Market Segmentation
-
1. Application
- 1.1. Bakery
-
1.2. Dairy-based Products
- 1.2.1. Ice Cream
- 1.2.2. Other Products
-
1.3. Beverages
- 1.3.1. Alcoholic Beverages
- 1.3.2. Non-alcoholic Beverages
- 1.4. Confectionery
- 1.5. Nutraceuticals
- 1.6. Snacks and Cereals
- 1.7. Other Applications
Natural Food Colorants Market Segmentation By Geography
-
1. North America
- 1.1. United States
- 1.2. Canada
- 1.3. Mexico
- 1.4. Rest of North America
-
2. Europe
- 2.1. United Kingdom
- 2.2. Germany
- 2.3. Italy
- 2.4. Russia
- 2.5. Spain
- 2.6. France
- 2.7. Rest of Europe
-
3. Asia Pacific
- 3.1. China
- 3.2. Japan
- 3.3. India
- 3.4. Australia
- 3.5. Rest of Asia Pacific
-
4. South America
- 4.1. Brazil
- 4.2. Argentina
- 4.3. Rest of South America
- 5. Middle East
-
6. United Arab Emirates
- 6.1. Saudi Arabia
- 6.2. Egypt
- 6.3. South Africa
- 6.4. Rest of Middle East
Natural Food Colorants Market REPORT HIGHLIGHTS
| Aspects | Details |
|---|---|
| Study Period | 2019-2033 |
| Base Year | 2024 |
| Estimated Year | 2025 |
| Forecast Period | 2025-2033 |
| Historical Period | 2019-2024 |
| Growth Rate | CAGR of 8.47% from 2019-2033 |
| Segmentation |
|
Table of Contents
- 1. Introduction
- 1.1. Research Scope
- 1.2. Market Segmentation
- 1.3. Research Methodology
- 1.4. Definitions and Assumptions
- 2. Executive Summary
- 2.1. Introduction
- 3. Market Dynamics
- 3.1. Introduction
- 3.2. Market Drivers
- 3.2.1. Rising Health Consciousness among consumer
- 3.3. Market Restrains
- 3.3.1. High Cost of natural Ingredients
- 3.4. Market Trends
- 3.4.1. Brightening Spotlight on Coloring Foodstuff
- 4. Market Factor Analysis
- 4.1. Porters Five Forces
- 4.2. Supply/Value Chain
- 4.3. PESTEL analysis
- 4.4. Market Entropy
- 4.5. Patent/Trademark Analysis
- 5. Global Natural Food Colorants Market Analysis, Insights and Forecast, 2019-2031
- 5.1. Market Analysis, Insights and Forecast - by Application
- 5.1.1. Bakery
- 5.1.2. Dairy-based Products
- 5.1.2.1. Ice Cream
- 5.1.2.2. Other Products
- 5.1.3. Beverages
- 5.1.3.1. Alcoholic Beverages
- 5.1.3.2. Non-alcoholic Beverages
- 5.1.4. Confectionery
- 5.1.5. Nutraceuticals
- 5.1.6. Snacks and Cereals
- 5.1.7. Other Applications
- 5.2. Market Analysis, Insights and Forecast - by Region
- 5.2.1. North America
- 5.2.2. Europe
- 5.2.3. Asia Pacific
- 5.2.4. South America
- 5.2.5. Middle East
- 5.2.6. United Arab Emirates
- 5.1. Market Analysis, Insights and Forecast - by Application
- 6. North America Natural Food Colorants Market Analysis, Insights and Forecast, 2019-2031
- 6.1. Market Analysis, Insights and Forecast - by Application
- 6.1.1. Bakery
- 6.1.2. Dairy-based Products
- 6.1.2.1. Ice Cream
- 6.1.2.2. Other Products
- 6.1.3. Beverages
- 6.1.3.1. Alcoholic Beverages
- 6.1.3.2. Non-alcoholic Beverages
- 6.1.4. Confectionery
- 6.1.5. Nutraceuticals
- 6.1.6. Snacks and Cereals
- 6.1.7. Other Applications
- 6.1. Market Analysis, Insights and Forecast - by Application
- 7. Europe Natural Food Colorants Market Analysis, Insights and Forecast, 2019-2031
- 7.1. Market Analysis, Insights and Forecast - by Application
- 7.1.1. Bakery
- 7.1.2. Dairy-based Products
- 7.1.2.1. Ice Cream
- 7.1.2.2. Other Products
- 7.1.3. Beverages
- 7.1.3.1. Alcoholic Beverages
- 7.1.3.2. Non-alcoholic Beverages
- 7.1.4. Confectionery
- 7.1.5. Nutraceuticals
- 7.1.6. Snacks and Cereals
- 7.1.7. Other Applications
- 7.1. Market Analysis, Insights and Forecast - by Application
- 8. Asia Pacific Natural Food Colorants Market Analysis, Insights and Forecast, 2019-2031
- 8.1. Market Analysis, Insights and Forecast - by Application
- 8.1.1. Bakery
- 8.1.2. Dairy-based Products
- 8.1.2.1. Ice Cream
- 8.1.2.2. Other Products
- 8.1.3. Beverages
- 8.1.3.1. Alcoholic Beverages
- 8.1.3.2. Non-alcoholic Beverages
- 8.1.4. Confectionery
- 8.1.5. Nutraceuticals
- 8.1.6. Snacks and Cereals
- 8.1.7. Other Applications
- 8.1. Market Analysis, Insights and Forecast - by Application
- 9. South America Natural Food Colorants Market Analysis, Insights and Forecast, 2019-2031
- 9.1. Market Analysis, Insights and Forecast - by Application
- 9.1.1. Bakery
- 9.1.2. Dairy-based Products
- 9.1.2.1. Ice Cream
- 9.1.2.2. Other Products
- 9.1.3. Beverages
- 9.1.3.1. Alcoholic Beverages
- 9.1.3.2. Non-alcoholic Beverages
- 9.1.4. Confectionery
- 9.1.5. Nutraceuticals
- 9.1.6. Snacks and Cereals
- 9.1.7. Other Applications
- 9.1. Market Analysis, Insights and Forecast - by Application
- 10. Middle East Natural Food Colorants Market Analysis, Insights and Forecast, 2019-2031
- 10.1. Market Analysis, Insights and Forecast - by Application
- 10.1.1. Bakery
- 10.1.2. Dairy-based Products
- 10.1.2.1. Ice Cream
- 10.1.2.2. Other Products
- 10.1.3. Beverages
- 10.1.3.1. Alcoholic Beverages
- 10.1.3.2. Non-alcoholic Beverages
- 10.1.4. Confectionery
- 10.1.5. Nutraceuticals
- 10.1.6. Snacks and Cereals
- 10.1.7. Other Applications
- 10.1. Market Analysis, Insights and Forecast - by Application
- 11. United Arab Emirates Natural Food Colorants Market Analysis, Insights and Forecast, 2019-2031
- 11.1. Market Analysis, Insights and Forecast - by Application
- 11.1.1. Bakery
- 11.1.2. Dairy-based Products
- 11.1.2.1. Ice Cream
- 11.1.2.2. Other Products
- 11.1.3. Beverages
- 11.1.3.1. Alcoholic Beverages
- 11.1.3.2. Non-alcoholic Beverages
- 11.1.4. Confectionery
- 11.1.5. Nutraceuticals
- 11.1.6. Snacks and Cereals
- 11.1.7. Other Applications
- 11.1. Market Analysis, Insights and Forecast - by Application
- 12. North America Natural Food Colorants Market Analysis, Insights and Forecast, 2019-2031
- 12.1. Market Analysis, Insights and Forecast - By Country/Sub-region
- 12.1.1 United States
- 12.1.2 Canada
- 12.1.3 Mexico
- 12.1.4 Rest of North America
- 13. Europe Natural Food Colorants Market Analysis, Insights and Forecast, 2019-2031
- 13.1. Market Analysis, Insights and Forecast - By Country/Sub-region
- 13.1.1 United Kingdom
- 13.1.2 Germany
- 13.1.3 Italy
- 13.1.4 Russia
- 13.1.5 Spain
- 13.1.6 France
- 13.1.7 Rest of Europe
- 14. Asia Pacific Natural Food Colorants Market Analysis, Insights and Forecast, 2019-2031
- 14.1. Market Analysis, Insights and Forecast - By Country/Sub-region
- 14.1.1 China
- 14.1.2 Japan
- 14.1.3 India
- 14.1.4 Australia
- 14.1.5 Rest of Asia Pacific
- 15. South America Natural Food Colorants Market Analysis, Insights and Forecast, 2019-2031
- 15.1. Market Analysis, Insights and Forecast - By Country/Sub-region
- 15.1.1 Brazil
- 15.1.2 Argentina
- 15.1.3 Rest of South America
- 16. Middle East Natural Food Colorants Market Analysis, Insights and Forecast, 2019-2031
- 16.1. Market Analysis, Insights and Forecast - By Country/Sub-region
- 16.1.1.
- 17. United Arab Emirates Natural Food Colorants Market Analysis, Insights and Forecast, 2019-2031
- 17.1. Market Analysis, Insights and Forecast - By Country/Sub-region
- 17.1.1 Saudi Arabia
- 17.1.2 Egypt
- 17.1.3 South Africa
- 17.1.4 Rest of Middle East
- 18. Competitive Analysis
- 18.1. Global Market Share Analysis 2024
- 18.2. Company Profiles
- 18.2.1 Kalsec Inc
- 18.2.1.1. Overview
- 18.2.1.2. Products
- 18.2.1.3. SWOT Analysis
- 18.2.1.4. Recent Developments
- 18.2.1.5. Financials (Based on Availability)
- 18.2.2 DDW Inc
- 18.2.2.1. Overview
- 18.2.2.2. Products
- 18.2.2.3. SWOT Analysis
- 18.2.2.4. Recent Developments
- 18.2.2.5. Financials (Based on Availability)
- 18.2.3 Chr Hansen Holding AS
- 18.2.3.1. Overview
- 18.2.3.2. Products
- 18.2.3.3. SWOT Analysis
- 18.2.3.4. Recent Developments
- 18.2.3.5. Financials (Based on Availability)
- 18.2.4 Sensient Technologies
- 18.2.4.1. Overview
- 18.2.4.2. Products
- 18.2.4.3. SWOT Analysis
- 18.2.4.4. Recent Developments
- 18.2.4.5. Financials (Based on Availability)
- 18.2.5 Givaudan SA
- 18.2.5.1. Overview
- 18.2.5.2. Products
- 18.2.5.3. SWOT Analysis
- 18.2.5.4. Recent Developments
- 18.2.5.5. Financials (Based on Availability)
- 18.2.6 Koninklijke DSM NV
- 18.2.6.1. Overview
- 18.2.6.2. Products
- 18.2.6.3. SWOT Analysis
- 18.2.6.4. Recent Developments
- 18.2.6.5. Financials (Based on Availability)
- 18.2.7 Synthite Industries Private Ltd
- 18.2.7.1. Overview
- 18.2.7.2. Products
- 18.2.7.3. SWOT Analysis
- 18.2.7.4. Recent Developments
- 18.2.7.5. Financials (Based on Availability)
- 18.2.8 Symrise AG
- 18.2.8.1. Overview
- 18.2.8.2. Products
- 18.2.8.3. SWOT Analysis
- 18.2.8.4. Recent Developments
- 18.2.8.5. Financials (Based on Availability)
- 18.2.9 Archer Daniels Midland Company*List Not Exhaustive
- 18.2.9.1. Overview
- 18.2.9.2. Products
- 18.2.9.3. SWOT Analysis
- 18.2.9.4. Recent Developments
- 18.2.9.5. Financials (Based on Availability)
- 18.2.1 Kalsec Inc
List of Figures
- Figure 1: Global Natural Food Colorants Market Revenue Breakdown (Million, %) by Region 2024 & 2032
- Figure 2: North America Natural Food Colorants Market Revenue (Million), by Country 2024 & 2032
- Figure 3: North America Natural Food Colorants Market Revenue Share (%), by Country 2024 & 2032
- Figure 4: Europe Natural Food Colorants Market Revenue (Million), by Country 2024 & 2032
- Figure 5: Europe Natural Food Colorants Market Revenue Share (%), by Country 2024 & 2032
- Figure 6: Asia Pacific Natural Food Colorants Market Revenue (Million), by Country 2024 & 2032
- Figure 7: Asia Pacific Natural Food Colorants Market Revenue Share (%), by Country 2024 & 2032
- Figure 8: South America Natural Food Colorants Market Revenue (Million), by Country 2024 & 2032
- Figure 9: South America Natural Food Colorants Market Revenue Share (%), by Country 2024 & 2032
- Figure 10: Middle East Natural Food Colorants Market Revenue (Million), by Country 2024 & 2032
- Figure 11: Middle East Natural Food Colorants Market Revenue Share (%), by Country 2024 & 2032
- Figure 12: United Arab Emirates Natural Food Colorants Market Revenue (Million), by Country 2024 & 2032
- Figure 13: United Arab Emirates Natural Food Colorants Market Revenue Share (%), by Country 2024 & 2032
- Figure 14: North America Natural Food Colorants Market Revenue (Million), by Application 2024 & 2032
- Figure 15: North America Natural Food Colorants Market Revenue Share (%), by Application 2024 & 2032
- Figure 16: North America Natural Food Colorants Market Revenue (Million), by Country 2024 & 2032
- Figure 17: North America Natural Food Colorants Market Revenue Share (%), by Country 2024 & 2032
- Figure 18: Europe Natural Food Colorants Market Revenue (Million), by Application 2024 & 2032
- Figure 19: Europe Natural Food Colorants Market Revenue Share (%), by Application 2024 & 2032
- Figure 20: Europe Natural Food Colorants Market Revenue (Million), by Country 2024 & 2032
- Figure 21: Europe Natural Food Colorants Market Revenue Share (%), by Country 2024 & 2032
- Figure 22: Asia Pacific Natural Food Colorants Market Revenue (Million), by Application 2024 & 2032
- Figure 23: Asia Pacific Natural Food Colorants Market Revenue Share (%), by Application 2024 & 2032
- Figure 24: Asia Pacific Natural Food Colorants Market Revenue (Million), by Country 2024 & 2032
- Figure 25: Asia Pacific Natural Food Colorants Market Revenue Share (%), by Country 2024 & 2032
- Figure 26: South America Natural Food Colorants Market Revenue (Million), by Application 2024 & 2032
- Figure 27: South America Natural Food Colorants Market Revenue Share (%), by Application 2024 & 2032
- Figure 28: South America Natural Food Colorants Market Revenue (Million), by Country 2024 & 2032
- Figure 29: South America Natural Food Colorants Market Revenue Share (%), by Country 2024 & 2032
- Figure 30: Middle East Natural Food Colorants Market Revenue (Million), by Application 2024 & 2032
- Figure 31: Middle East Natural Food Colorants Market Revenue Share (%), by Application 2024 & 2032
- Figure 32: Middle East Natural Food Colorants Market Revenue (Million), by Country 2024 & 2032
- Figure 33: Middle East Natural Food Colorants Market Revenue Share (%), by Country 2024 & 2032
- Figure 34: United Arab Emirates Natural Food Colorants Market Revenue (Million), by Application 2024 & 2032
- Figure 35: United Arab Emirates Natural Food Colorants Market Revenue Share (%), by Application 2024 & 2032
- Figure 36: United Arab Emirates Natural Food Colorants Market Revenue (Million), by Country 2024 & 2032
- Figure 37: United Arab Emirates Natural Food Colorants Market Revenue Share (%), by Country 2024 & 2032
List of Tables
- Table 1: Global Natural Food Colorants Market Revenue Million Forecast, by Region 2019 & 2032
- Table 2: Global Natural Food Colorants Market Revenue Million Forecast, by Application 2019 & 2032
- Table 3: Global Natural Food Colorants Market Revenue Million Forecast, by Region 2019 & 2032
- Table 4: Global Natural Food Colorants Market Revenue Million Forecast, by Country 2019 & 2032
- Table 5: United States Natural Food Colorants Market Revenue (Million) Forecast, by Application 2019 & 2032
- Table 6: Canada Natural Food Colorants Market Revenue (Million) Forecast, by Application 2019 & 2032
- Table 7: Mexico Natural Food Colorants Market Revenue (Million) Forecast, by Application 2019 & 2032
- Table 8: Rest of North America Natural Food Colorants Market Revenue (Million) Forecast, by Application 2019 & 2032
- Table 9: Global Natural Food Colorants Market Revenue Million Forecast, by Country 2019 & 2032
- Table 10: United Kingdom Natural Food Colorants Market Revenue (Million) Forecast, by Application 2019 & 2032
- Table 11: Germany Natural Food Colorants Market Revenue (Million) Forecast, by Application 2019 & 2032
- Table 12: Italy Natural Food Colorants Market Revenue (Million) Forecast, by Application 2019 & 2032
- Table 13: Russia Natural Food Colorants Market Revenue (Million) Forecast, by Application 2019 & 2032
- Table 14: Spain Natural Food Colorants Market Revenue (Million) Forecast, by Application 2019 & 2032
- Table 15: France Natural Food Colorants Market Revenue (Million) Forecast, by Application 2019 & 2032
- Table 16: Rest of Europe Natural Food Colorants Market Revenue (Million) Forecast, by Application 2019 & 2032
- Table 17: Global Natural Food Colorants Market Revenue Million Forecast, by Country 2019 & 2032
- Table 18: China Natural Food Colorants Market Revenue (Million) Forecast, by Application 2019 & 2032
- Table 19: Japan Natural Food Colorants Market Revenue (Million) Forecast, by Application 2019 & 2032
- Table 20: India Natural Food Colorants Market Revenue (Million) Forecast, by Application 2019 & 2032
- Table 21: Australia Natural Food Colorants Market Revenue (Million) Forecast, by Application 2019 & 2032
- Table 22: Rest of Asia Pacific Natural Food Colorants Market Revenue (Million) Forecast, by Application 2019 & 2032
- Table 23: Global Natural Food Colorants Market Revenue Million Forecast, by Country 2019 & 2032
- Table 24: Brazil Natural Food Colorants Market Revenue (Million) Forecast, by Application 2019 & 2032
- Table 25: Argentina Natural Food Colorants Market Revenue (Million) Forecast, by Application 2019 & 2032
- Table 26: Rest of South America Natural Food Colorants Market Revenue (Million) Forecast, by Application 2019 & 2032
- Table 27: Global Natural Food Colorants Market Revenue Million Forecast, by Country 2019 & 2032
- Table 28: Natural Food Colorants Market Revenue (Million) Forecast, by Application 2019 & 2032
- Table 29: Global Natural Food Colorants Market Revenue Million Forecast, by Country 2019 & 2032
- Table 30: Saudi Arabia Natural Food Colorants Market Revenue (Million) Forecast, by Application 2019 & 2032
- Table 31: Egypt Natural Food Colorants Market Revenue (Million) Forecast, by Application 2019 & 2032
- Table 32: South Africa Natural Food Colorants Market Revenue (Million) Forecast, by Application 2019 & 2032
- Table 33: Rest of Middle East Natural Food Colorants Market Revenue (Million) Forecast, by Application 2019 & 2032
- Table 34: Global Natural Food Colorants Market Revenue Million Forecast, by Application 2019 & 2032
- Table 35: Global Natural Food Colorants Market Revenue Million Forecast, by Country 2019 & 2032
- Table 36: United States Natural Food Colorants Market Revenue (Million) Forecast, by Application 2019 & 2032
- Table 37: Canada Natural Food Colorants Market Revenue (Million) Forecast, by Application 2019 & 2032
- Table 38: Mexico Natural Food Colorants Market Revenue (Million) Forecast, by Application 2019 & 2032
- Table 39: Rest of North America Natural Food Colorants Market Revenue (Million) Forecast, by Application 2019 & 2032
- Table 40: Global Natural Food Colorants Market Revenue Million Forecast, by Application 2019 & 2032
- Table 41: Global Natural Food Colorants Market Revenue Million Forecast, by Country 2019 & 2032
- Table 42: United Kingdom Natural Food Colorants Market Revenue (Million) Forecast, by Application 2019 & 2032
- Table 43: Germany Natural Food Colorants Market Revenue (Million) Forecast, by Application 2019 & 2032
- Table 44: Italy Natural Food Colorants Market Revenue (Million) Forecast, by Application 2019 & 2032
- Table 45: Russia Natural Food Colorants Market Revenue (Million) Forecast, by Application 2019 & 2032
- Table 46: Spain Natural Food Colorants Market Revenue (Million) Forecast, by Application 2019 & 2032
- Table 47: France Natural Food Colorants Market Revenue (Million) Forecast, by Application 2019 & 2032
- Table 48: Rest of Europe Natural Food Colorants Market Revenue (Million) Forecast, by Application 2019 & 2032
- Table 49: Global Natural Food Colorants Market Revenue Million Forecast, by Application 2019 & 2032
- Table 50: Global Natural Food Colorants Market Revenue Million Forecast, by Country 2019 & 2032
- Table 51: China Natural Food Colorants Market Revenue (Million) Forecast, by Application 2019 & 2032
- Table 52: Japan Natural Food Colorants Market Revenue (Million) Forecast, by Application 2019 & 2032
- Table 53: India Natural Food Colorants Market Revenue (Million) Forecast, by Application 2019 & 2032
- Table 54: Australia Natural Food Colorants Market Revenue (Million) Forecast, by Application 2019 & 2032
- Table 55: Rest of Asia Pacific Natural Food Colorants Market Revenue (Million) Forecast, by Application 2019 & 2032
- Table 56: Global Natural Food Colorants Market Revenue Million Forecast, by Application 2019 & 2032
- Table 57: Global Natural Food Colorants Market Revenue Million Forecast, by Country 2019 & 2032
- Table 58: Brazil Natural Food Colorants Market Revenue (Million) Forecast, by Application 2019 & 2032
- Table 59: Argentina Natural Food Colorants Market Revenue (Million) Forecast, by Application 2019 & 2032
- Table 60: Rest of South America Natural Food Colorants Market Revenue (Million) Forecast, by Application 2019 & 2032
- Table 61: Global Natural Food Colorants Market Revenue Million Forecast, by Application 2019 & 2032
- Table 62: Global Natural Food Colorants Market Revenue Million Forecast, by Country 2019 & 2032
- Table 63: Global Natural Food Colorants Market Revenue Million Forecast, by Application 2019 & 2032
- Table 64: Global Natural Food Colorants Market Revenue Million Forecast, by Country 2019 & 2032
- Table 65: Saudi Arabia Natural Food Colorants Market Revenue (Million) Forecast, by Application 2019 & 2032
- Table 66: Egypt Natural Food Colorants Market Revenue (Million) Forecast, by Application 2019 & 2032
- Table 67: South Africa Natural Food Colorants Market Revenue (Million) Forecast, by Application 2019 & 2032
- Table 68: Rest of Middle East Natural Food Colorants Market Revenue (Million) Forecast, by Application 2019 & 2032
Frequently Asked Questions
1. What is the projected Compound Annual Growth Rate (CAGR) of the Natural Food Colorants Market?
The projected CAGR is approximately 8.47%.
2. Which companies are prominent players in the Natural Food Colorants Market?
Key companies in the market include Kalsec Inc, DDW Inc, Chr Hansen Holding AS, Sensient Technologies, Givaudan SA, Koninklijke DSM NV, Synthite Industries Private Ltd, Symrise AG, Archer Daniels Midland Company*List Not Exhaustive.
3. What are the main segments of the Natural Food Colorants Market?
The market segments include Application.
4. Can you provide details about the market size?
The market size is estimated to be USD 2.07 Million as of 2022.
5. What are some drivers contributing to market growth?
Rising Health Consciousness among consumer.
6. What are the notable trends driving market growth?
Brightening Spotlight on Coloring Foodstuff.
7. Are there any restraints impacting market growth?
High Cost of natural Ingredients.
8. Can you provide examples of recent developments in the market?
In January 2021, GNT Group added a new pink shade coloring agent under its EXBERRY® brand with the name EXBERRY® Shade Pink - OD, which is developed for use in fat-based applications. It is also available in red, yellow, orange, blue, and green variants.
9. What pricing options are available for accessing the report?
Pricing options include single-user, multi-user, and enterprise licenses priced at USD 4750, USD 5250, and USD 8750 respectively.
10. Is the market size provided in terms of value or volume?
The market size is provided in terms of value, measured in Million.
11. Are there any specific market keywords associated with the report?
Yes, the market keyword associated with the report is "Natural Food Colorants Market," which aids in identifying and referencing the specific market segment covered.
12. How do I determine which pricing option suits my needs best?
The pricing options vary based on user requirements and access needs. Individual users may opt for single-user licenses, while businesses requiring broader access may choose multi-user or enterprise licenses for cost-effective access to the report.
13. Are there any additional resources or data provided in the Natural Food Colorants Market report?
While the report offers comprehensive insights, it's advisable to review the specific contents or supplementary materials provided to ascertain if additional resources or data are available.
14. How can I stay updated on further developments or reports in the Natural Food Colorants Market?
To stay informed about further developments, trends, and reports in the Natural Food Colorants Market, consider subscribing to industry newsletters, following relevant companies and organizations, or regularly checking reputable industry news sources and publications.
Methodology
Step 1 - Identification of Relevant Samples Size from Population Database


Step 2 - Approaches for Defining Global Market Size (Value, Volume* & Price*)

Note*: In applicable scenarios
Step 3 - Data Sources
Primary Research
- Web Analytics
- Survey Reports
- Research Institute
- Latest Research Reports
- Opinion Leaders
Secondary Research
- Annual Reports
- White Paper
- Latest Press Release
- Industry Association
- Paid Database
- Investor Presentations

Step 4 - Data Triangulation
Involves using different sources of information in order to increase the validity of a study
These sources are likely to be stakeholders in a program - participants, other researchers, program staff, other community members, and so on.
Then we put all data in single framework & apply various statistical tools to find out the dynamic on the market.
During the analysis stage, feedback from the stakeholder groups would be compared to determine areas of agreement as well as areas of divergence


