

Key Insights
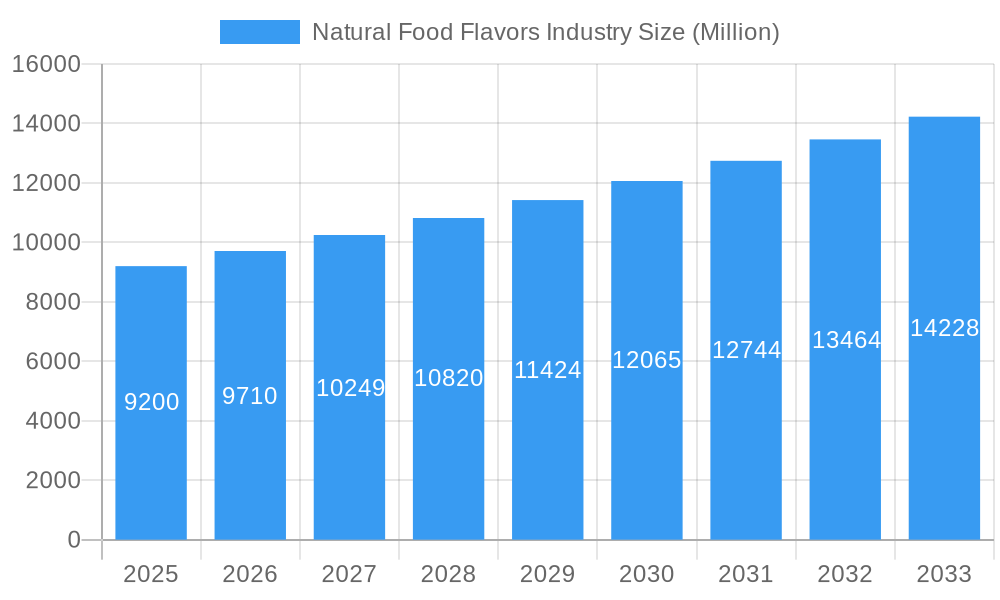
The global Natural Food Flavors market is poised for robust expansion, projected to reach a significant USD 9.2 billion by 2025. This growth is underpinned by a compelling Compound Annual Growth Rate (CAGR) of 5.5% from 2019 to 2033, indicating sustained and healthy demand. Consumers are increasingly seeking natural and clean-label products, driving manufacturers to reformulate their offerings with naturally sourced ingredients. This shift is prominently observed across various application segments, including bakery, confectionery, dairy and desserts, and beverages, where the demand for authentic and recognizable flavor profiles is paramount. The beverage sector, encompassing both alcoholic and non-alcoholic options, is a key beneficiary, with a growing appetite for naturally flavored drinks. Similarly, the savory and snacks segment is experiencing a surge in demand for natural flavor enhancers, reflecting evolving consumer preferences for healthier and more transparent food choices.
Natural Food Flavors Industry Market Size (In Billion)
The market's dynamism is further fueled by innovation and strategic initiatives from leading companies such as Firmenich SA, International Flavors & Fragrances Inc., and Givaudan SA. These industry giants are investing heavily in research and development to create novel natural flavor solutions and expand their product portfolios. Regional analysis indicates a strong presence and projected growth in North America and Europe, driven by mature markets with high consumer awareness and regulatory support for natural ingredients. The Asia Pacific region, however, presents a significant growth opportunity due to its rapidly expanding middle class and increasing adoption of Western dietary trends, coupled with a growing demand for healthier food options. While the market is largely driven by consumer preference for natural products and technological advancements in flavor extraction, potential restraints such as the higher cost of natural flavor ingredients compared to synthetic alternatives and challenges in sourcing consistent raw materials could pose hurdles. Nevertheless, the overarching trend towards healthier and more transparent food choices is expected to largely outweigh these challenges.
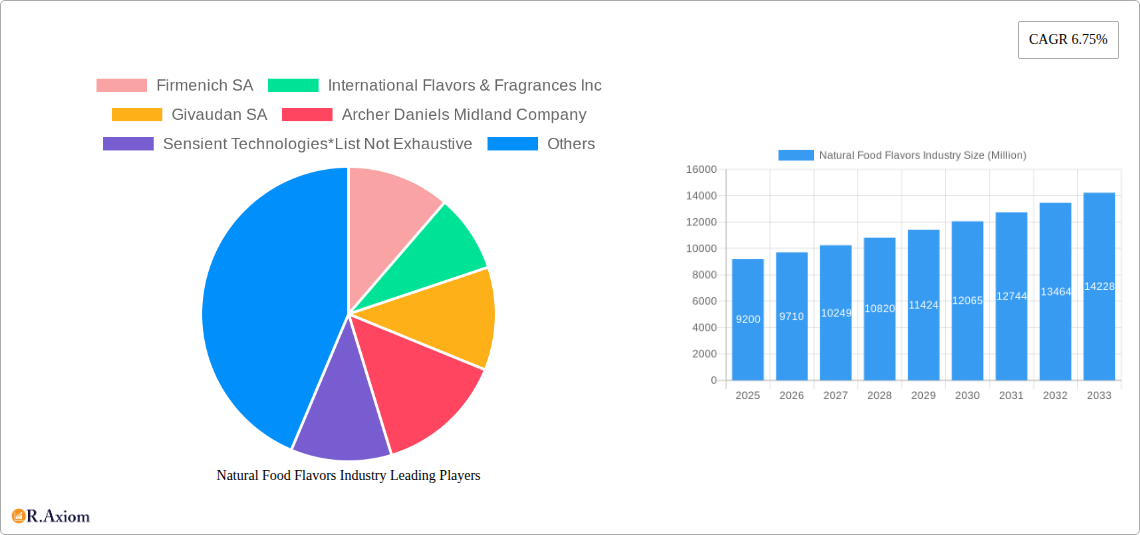
Natural Food Flavors Industry Company Market Share
Natural Food Flavors Industry Market Concentration & Innovation
The global Natural Food Flavors industry is characterized by a moderately concentrated market, with key players like Firmenich SA, International Flavors & Fragrances Inc., Givaudan SA, Archer Daniels Midland Company, and Sensient Technologies holding significant market shares. These industry giants, alongside BASF SE, Kerry Group PLC, and Corbion NV, are at the forefront of innovation, driving the market towards natural and sustainable flavor solutions. Innovation is primarily fueled by increasing consumer demand for clean-label products, a growing awareness of health and wellness, and advancements in extraction and formulation technologies. Regulatory frameworks, particularly those emphasizing stringent labeling requirements and ingredient transparency, also play a crucial role in shaping product development and market entry strategies. While product substitutes exist in the form of artificial flavors, the preference for natural alternatives is steadily growing. End-user trends are dominated by the demand for naturally sourced ingredients, reduced sugar and salt content, and enhanced sensory experiences. Merger and acquisition activities are strategically focused on expanding product portfolios, geographic reach, and technological capabilities. Notable M&A deal values are projected to exceed $5 billion within the forecast period, as companies seek to consolidate their positions and acquire specialized expertise in natural flavor extraction and encapsulation.
Natural Food Flavors Industry Industry Trends & Insights
The Natural Food Flavors industry is experiencing robust growth, driven by a confluence of powerful trends that are fundamentally reshaping the food and beverage landscape. The projected Compound Annual Growth Rate (CAGR) for this sector stands at an impressive 6.8% from 2025 to 2033, reflecting sustained consumer preference and increasing market penetration. A primary growth driver is the escalating consumer demand for "clean label" products, where consumers actively seek out ingredients they recognize and trust, with a clear preference for naturally derived sources over synthetic alternatives. This trend is amplified by a growing global awareness of health and wellness, leading consumers to associate natural flavors with healthier choices. Technological disruptions are also playing a pivotal role, with advancements in areas such as biotechnological production of flavor compounds, sophisticated extraction techniques (like supercritical fluid extraction), and encapsulation technologies that enhance flavor stability and delivery. These innovations enable the creation of more authentic, nuanced, and cost-effective natural flavors. Consumer preferences are increasingly leaning towards plant-based ingredients, ethically sourced materials, and flavors that evoke natural origins and artisanal qualities. This translates into a demand for a wider variety of natural fruit, vegetable, herb, and spice flavors. The competitive dynamics within the industry are intensifying, with established players investing heavily in research and development to maintain their edge, while agile new entrants are carving out niches by focusing on specific natural ingredients or novel applications. Market penetration is expected to reach over 75% in developed economies by 2033, with emerging markets showing accelerated adoption rates. The industry is also witnessing a significant shift in product development, moving beyond simple flavor replication to creating complex flavor profiles that enhance the overall sensory experience of food and beverages, driving innovation in everything from savory applications to indulgent confectionery. The projected market size is estimated to reach $25 billion by 2025 and is poised to grow substantially beyond that.
Dominant Markets & Segments in Natural Food Flavors Industry
The global Natural Food Flavors industry's dominance is a complex interplay of regional demand, application-specific needs, and evolving consumer preferences. North America and Europe currently represent the largest markets, driven by high consumer awareness of health and wellness trends and stringent regulatory frameworks that favor natural ingredients. Within these regions, the United States and Germany are leading countries, exhibiting strong demand across various segments.
- Beverages (Alcoholic, Non-alcoholic): This segment is a major revenue generator, accounting for an estimated 30% of the total market value, projected to reach $7.5 billion by 2025. Key drivers include the growing popularity of natural fruit juices, functional beverages infused with botanical extracts, and craft alcoholic drinks featuring natural flavor profiles. The demand for low-sugar and naturally sweetened beverages is also a significant contributor.
- Dairy and Desserts: This segment holds a substantial market share of approximately 20%, with a market size estimated at $5 billion by 2025. Consumer preference for natural fruit and vanilla flavors in yogurts, ice creams, and other dairy-based products, coupled with the trend towards indulgence and premiumization, fuels growth.
- Confectionery: Accounting for around 18% of the market, this segment is valued at approximately $4.5 billion by 2025. The demand for natural fruit flavors in candies, chocolates, and baked goods, aligning with a desire for perceived healthier treat options, is a primary driver.
- Bakery: With an estimated 15% market share and a value of $3.75 billion by 2025, the bakery segment benefits from the demand for natural flavors in breads, pastries, and cakes. The trend towards artisanal baking and the use of natural ingredients like spices and fruit purees are key growth factors.
- Savory and Snacks: This segment, representing 12% of the market and valued at $3 billion by 2025, is experiencing rapid growth. The increasing popularity of natural umami flavors, spice blends, and herb extracts in chips, extruded snacks, and ready-to-eat meals is driving demand.
- Sauces, Soups, and Seasonings: This segment accounts for 10% of the market, with an estimated value of $2.5 billion by 2025. Natural flavor enhancers, spice blends, and aromatic extracts are crucial for providing authentic taste profiles in these products.
- Meat and Meat Products: This segment, representing 8% of the market and valued at $2 billion by 2025, sees demand for natural smoke flavors, herb and spice blends to enhance the taste of processed meats and meat alternatives.
- Other Applications: This residual segment, comprising the remaining 7% and valued at $1.75 billion by 2025, includes diverse applications such as pet food and animal feed, where natural flavoring is increasingly being incorporated.
Natural Food Flavors Industry Product Developments
Product developments in the Natural Food Flavors industry are heavily focused on innovation in extraction technologies and the creation of complex, authentic flavor profiles. Companies are leveraging advanced methods like enzymatic processing and fermentation to unlock novel natural flavor compounds from a wider range of botanical sources. There's a distinct trend towards developing concentrated liquid and powder forms that offer superior stability and ease of application across various food matrices. Key competitive advantages are being gained through the development of "clean label" solutions that meet stringent regulatory and consumer demands for transparency, as well as through the creation of flavors that mimic traditionally artificial taste profiles with natural ingredients. This includes innovative approaches to replicating sweet, savory, and umami notes, catering to evolving dietary trends like reduced sugar and salt.
Report Scope & Segmentation Analysis
This report provides a comprehensive analysis of the Natural Food Flavors industry, segmented by application type to offer granular insights into market dynamics.
- Bakery: This segment is projected to witness a CAGR of 6.5%, with a market size estimated at $4.5 billion by 2033. Growth is driven by the demand for natural fruit, spice, and vanilla flavors in a variety of baked goods.
- Confectionery: Expected to grow at a CAGR of 7.0%, this segment's market size is forecast to reach $6 billion by 2033. Consumer preference for natural fruit and berry flavors in candies and chocolates fuels this expansion.
- Dairy and Desserts: This segment is anticipated to achieve a CAGR of 7.2%, with a projected market size of $6.5 billion by 2033. Natural fruit and vanilla flavors are dominant in yogurts, ice creams, and other dairy-based desserts.
- Beverages (Alcoholic, Non-alcoholic): With a projected CAGR of 7.5%, this segment is expected to reach $9 billion by 2033. The rising demand for natural fruit juices, functional beverages, and flavored alcoholic drinks is a key driver.
- Savory and Snacks: This segment is poised for significant growth at a CAGR of 7.8%, reaching $5 billion by 2033. The increasing demand for natural umami, spice, and herb flavors in savory products is a major factor.
- Meat and Meat Products: Projected to grow at a CAGR of 6.2%, this segment's market size is estimated at $2.5 billion by 2033. Natural smoke flavors and spice blends are key to this segment's expansion.
- Sauces, Soups, and Seasonings: This segment is expected to grow at a CAGR of 6.8%, with a market size of $3.5 billion by 2033, driven by the demand for authentic, natural flavor profiles.
- Other Applications: This segment is projected to grow at a CAGR of 6.0%, reaching $2 billion by 2033, encompassing niche applications where natural flavoring is increasingly sought.
Key Drivers of Natural Food Flavors Industry Growth
The Natural Food Flavors industry's growth is propelled by several interconnected factors. Consumer demand for natural and clean-label products is paramount, driven by growing health consciousness and a desire for transparent ingredient lists. Technological advancements in extraction, fermentation, and encapsulation are enabling the creation of more authentic, stable, and cost-effective natural flavors. Stringent regulatory environments in many regions favor the use of natural ingredients and mandate clear labeling, indirectly boosting demand for natural flavors. Furthermore, the rising trend of plant-based diets and the demand for meat alternatives are creating new avenues for natural savory and umami flavor development. Economic factors such as increasing disposable incomes in emerging markets are also contributing to a greater willingness to spend on premium, natural food options.
Challenges in the Natural Food Flavors Industry Sector
Despite its strong growth trajectory, the Natural Food Flavors industry faces several challenges. Supply chain volatility and sourcing challenges for natural ingredients, influenced by climate change and geopolitical factors, can impact availability and cost. Higher production costs compared to synthetic flavors can be a barrier for price-sensitive markets. Regulatory complexities and varying standards across different regions can create hurdles for market entry and product standardization. Consumer education and perception still play a role, with some consumers needing to be further convinced of the efficacy and value of natural flavors. Intense competitive pressure from both established players and emerging companies also necessitates continuous innovation and efficient operational strategies to maintain market share.
Emerging Opportunities in Natural Food Flavors Industry
Emerging opportunities within the Natural Food Flavors industry are diverse and promising. The burgeoning plant-based food market presents a significant opportunity for developing nuanced, authentic savory and umami natural flavors. Functional foods and beverages incorporating natural flavors with perceived health benefits, such as antioxidant-rich extracts or mood-enhancing botanical notes, are gaining traction. The increasing demand for artisanal and premium food products creates space for unique and exotic natural flavor profiles. Furthermore, advancements in biotechnology and fermentation are opening doors to producing rare and complex natural flavor compounds sustainably and cost-effectively. The expansion into emerging economies with growing middle classes and increasing awareness of health and wellness trends also represents a substantial growth frontier.
Leading Players in the Natural Food Flavors Industry Market
- Firmenich SA
- International Flavors & Fragrances Inc.
- Givaudan SA
- Archer Daniels Midland Company
- Sensient Technologies
- BASF SE
- Kerry Group PLC
- Corbion NV
Key Developments in Natural Food Flavors Industry Industry
- 2023/10: Firmenich SA and DSM merge to form DSM-Firmenich, a leading innovation partner in nutrition, health, and beauty, with a strong focus on sustainable ingredients and flavors.
- 2024/01: International Flavors & Fragrances Inc. announces strategic investments in expanding its natural flavor production capabilities in Southeast Asia to meet growing regional demand.
- 2024/03: Givaudan SA launches a new range of natural flavor solutions for plant-based meat alternatives, focusing on authentic savory and smoky profiles.
- 2024/05: Archer Daniels Midland Company acquires a key supplier of natural fruit extracts, enhancing its portfolio and vertical integration in the natural food flavors sector.
- 2024/07: Sensient Technologies invests in R&D for novel encapsulation technologies to improve the stability and shelf-life of natural fruit flavors in dry food applications.
- 2024/09: BASF SE expands its portfolio of natural aroma ingredients derived from renewable resources, reinforcing its commitment to sustainability.
- 2024/11: Kerry Group PLC introduces a new line of natural flavor enhancers for savory applications, addressing the demand for clean-label sodium reduction solutions.
- 2025/01: Corbion NV develops new bio-based ingredients that can improve the texture and flavor profile of baked goods, utilizing natural fermentation processes.
Strategic Outlook for Natural Food Flavors Industry Market
The strategic outlook for the Natural Food Flavors industry is overwhelmingly positive, driven by persistent consumer demand for healthier, cleaner, and more authentic food experiences. Companies are strategically focusing on innovation in sustainable sourcing, advanced extraction technologies, and the development of complex flavor profiles that mimic natural nuances. Expansion into emerging markets, capitalizing on rising disposable incomes and health consciousness, will be a key growth catalyst. Furthermore, strategic partnerships and targeted acquisitions aimed at enhancing technological capabilities and broadening product portfolios will continue to shape the competitive landscape. The industry's ability to adapt to evolving regulatory frameworks and consumer preferences, while maintaining cost-effectiveness and supply chain resilience, will determine its long-term success. The pursuit of naturally derived, high-impact flavors for increasingly diverse applications, from plant-based foods to functional beverages, presents a substantial and sustained opportunity for market expansion and value creation.
Natural Food Flavors Industry Segmentation
-
1. Application Type
- 1.1. Bakery
- 1.2. Confectionery
- 1.3. Dairy and Desserts
-
1.4. Beverages
- 1.4.1. Alcoholic
- 1.4.2. Non-alcoholic
- 1.5. Savory and Snacks
- 1.6. Meat and Meat Products
- 1.7. Sauces, Soups, and Seasonings
- 1.8. Other Applications
Natural Food Flavors Industry Segmentation By Geography
-
1. North America
- 1.1. United States
- 1.2. Canada
- 1.3. Mexico
- 1.4. Rest of North America
-
2. Europe
- 2.1. Germany
- 2.2. United Kingdom
- 2.3. France
- 2.4. Spain
- 2.5. Italy
- 2.6. Rest of Europe
-
3. Asia Pacific
- 3.1. China
- 3.2. Japan
- 3.3. India
- 3.4. Australia
- 3.5. Rest of Asia Pacific
-
4. Rest of the World
- 4.1. South America
- 4.2. Middle East
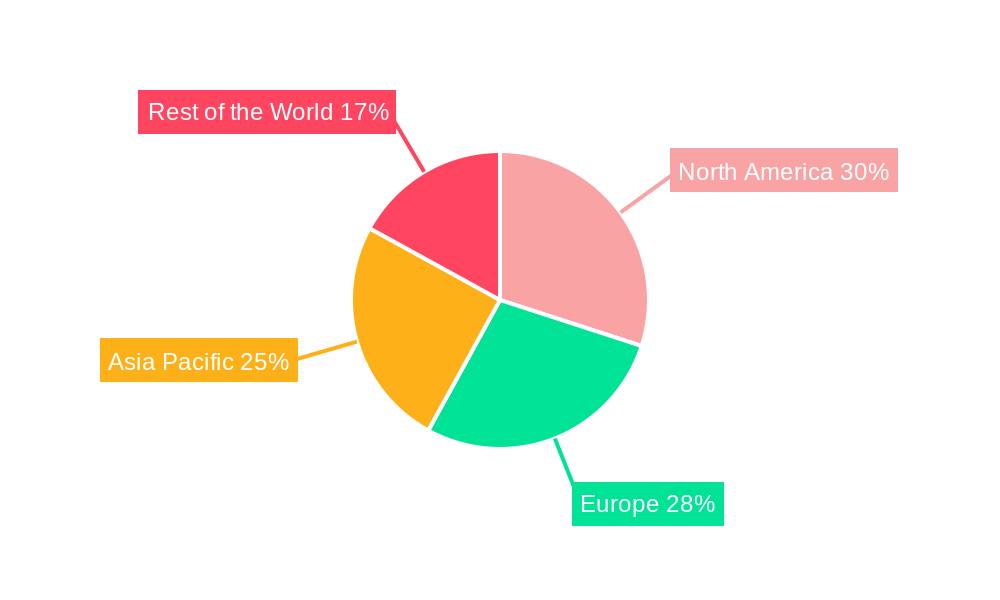
Natural Food Flavors Industry Regional Market Share
Geographic Coverage of Natural Food Flavors Industry
Natural Food Flavors Industry REPORT HIGHLIGHTS
| Aspects | Details |
|---|---|
| Study Period | 2020-2034 |
| Base Year | 2025 |
| Estimated Year | 2026 |
| Forecast Period | 2026-2034 |
| Historical Period | 2020-2025 |
| Growth Rate | CAGR of 6.2% from 2020-2034 |
| Segmentation |
|
Table of Contents
- 1. Introduction
- 1.1. Research Scope
- 1.2. Market Segmentation
- 1.3. Research Objective
- 1.4. Definitions and Assumptions
- 2. Executive Summary
- 2.1. Market Snapshot
- 3. Market Dynamics
- 3.1. Market Drivers
- 3.2. Market Restrains
- 3.3. Market Trends
- 3.4. Market Opportunities
- 4. Market Factor Analysis
- 4.1. Porters Five Forces
- 4.1.1. Bargaining Power of Suppliers
- 4.1.2. Bargaining Power of Buyers
- 4.1.3. Threat of New Entrants
- 4.1.4. Threat of Substitutes
- 4.1.5. Competitive Rivalry
- 4.2. PESTEL analysis
- 4.3. BCG Analysis
- 4.3.1. Stars (High Growth, High Market Share)
- 4.3.2. Cash Cows (Low Growth, High Market Share)
- 4.3.3. Question Mark (High Growth, Low Market Share)
- 4.3.4. Dogs (Low Growth, Low Market Share)
- 4.4. Ansoff Matrix Analysis
- 4.5. Supply Chain Analysis
- 4.6. Regulatory Landscape
- 4.7. Current Market Potential and Opportunity Assessment (TAM–SAM–SOM Framework)
- 4.8. RAX Analyst Note
- 4.1. Porters Five Forces
- 5. Market Analysis, Insights and Forecast 2021-2033
- 5.1. Market Analysis, Insights and Forecast - by Application Type
- 5.1.1. Bakery
- 5.1.2. Confectionery
- 5.1.3. Dairy and Desserts
- 5.1.4. Beverages
- 5.1.4.1. Alcoholic
- 5.1.4.2. Non-alcoholic
- 5.1.5. Savory and Snacks
- 5.1.6. Meat and Meat Products
- 5.1.7. Sauces, Soups, and Seasonings
- 5.1.8. Other Applications
- 5.2. Market Analysis, Insights and Forecast - by Region
- 5.2.1. North America
- 5.2.2. Europe
- 5.2.3. Asia Pacific
- 5.2.4. Rest of the World
- 5.1. Market Analysis, Insights and Forecast - by Application Type
- 6. Global Natural Food Flavors Industry Analysis, Insights and Forecast, 2021-2033
- 6.1. Market Analysis, Insights and Forecast - by Application Type
- 6.1.1. Bakery
- 6.1.2. Confectionery
- 6.1.3. Dairy and Desserts
- 6.1.4. Beverages
- 6.1.4.1. Alcoholic
- 6.1.4.2. Non-alcoholic
- 6.1.5. Savory and Snacks
- 6.1.6. Meat and Meat Products
- 6.1.7. Sauces, Soups, and Seasonings
- 6.1.8. Other Applications
- 6.1. Market Analysis, Insights and Forecast - by Application Type
- 7. North America Natural Food Flavors Industry Analysis, Insights and Forecast, 2020-2032
- 7.1. Market Analysis, Insights and Forecast - by Application Type
- 7.1.1. Bakery
- 7.1.2. Confectionery
- 7.1.3. Dairy and Desserts
- 7.1.4. Beverages
- 7.1.4.1. Alcoholic
- 7.1.4.2. Non-alcoholic
- 7.1.5. Savory and Snacks
- 7.1.6. Meat and Meat Products
- 7.1.7. Sauces, Soups, and Seasonings
- 7.1.8. Other Applications
- 7.1. Market Analysis, Insights and Forecast - by Application Type
- 8. Europe Natural Food Flavors Industry Analysis, Insights and Forecast, 2020-2032
- 8.1. Market Analysis, Insights and Forecast - by Application Type
- 8.1.1. Bakery
- 8.1.2. Confectionery
- 8.1.3. Dairy and Desserts
- 8.1.4. Beverages
- 8.1.4.1. Alcoholic
- 8.1.4.2. Non-alcoholic
- 8.1.5. Savory and Snacks
- 8.1.6. Meat and Meat Products
- 8.1.7. Sauces, Soups, and Seasonings
- 8.1.8. Other Applications
- 8.1. Market Analysis, Insights and Forecast - by Application Type
- 9. Asia Pacific Natural Food Flavors Industry Analysis, Insights and Forecast, 2020-2032
- 9.1. Market Analysis, Insights and Forecast - by Application Type
- 9.1.1. Bakery
- 9.1.2. Confectionery
- 9.1.3. Dairy and Desserts
- 9.1.4. Beverages
- 9.1.4.1. Alcoholic
- 9.1.4.2. Non-alcoholic
- 9.1.5. Savory and Snacks
- 9.1.6. Meat and Meat Products
- 9.1.7. Sauces, Soups, and Seasonings
- 9.1.8. Other Applications
- 9.1. Market Analysis, Insights and Forecast - by Application Type
- 10. Rest of the World Natural Food Flavors Industry Analysis, Insights and Forecast, 2020-2032
- 10.1. Market Analysis, Insights and Forecast - by Application Type
- 10.1.1. Bakery
- 10.1.2. Confectionery
- 10.1.3. Dairy and Desserts
- 10.1.4. Beverages
- 10.1.4.1. Alcoholic
- 10.1.4.2. Non-alcoholic
- 10.1.5. Savory and Snacks
- 10.1.6. Meat and Meat Products
- 10.1.7. Sauces, Soups, and Seasonings
- 10.1.8. Other Applications
- 10.1. Market Analysis, Insights and Forecast - by Application Type
- 11. Competitive Analysis
- 11.1. Company Profiles
- 11.1.1 Firmenich SA
- 11.1.1.1. Company Overview
- 11.1.1.2. Products
- 11.1.1.3. Company Financials
- 11.1.1.4. SWOT Analysis
- 11.1.2 International Flavors & Fragrances Inc
- 11.1.2.1. Company Overview
- 11.1.2.2. Products
- 11.1.2.3. Company Financials
- 11.1.2.4. SWOT Analysis
- 11.1.3 Givaudan SA
- 11.1.3.1. Company Overview
- 11.1.3.2. Products
- 11.1.3.3. Company Financials
- 11.1.3.4. SWOT Analysis
- 11.1.4 Archer Daniels Midland Company
- 11.1.4.1. Company Overview
- 11.1.4.2. Products
- 11.1.4.3. Company Financials
- 11.1.4.4. SWOT Analysis
- 11.1.5 Sensient Technologies*List Not Exhaustive
- 11.1.5.1. Company Overview
- 11.1.5.2. Products
- 11.1.5.3. Company Financials
- 11.1.5.4. SWOT Analysis
- 11.1.6 BASF SE
- 11.1.6.1. Company Overview
- 11.1.6.2. Products
- 11.1.6.3. Company Financials
- 11.1.6.4. SWOT Analysis
- 11.1.7 Kerry Group PLC
- 11.1.7.1. Company Overview
- 11.1.7.2. Products
- 11.1.7.3. Company Financials
- 11.1.7.4. SWOT Analysis
- 11.1.8 Corbion NV
- 11.1.8.1. Company Overview
- 11.1.8.2. Products
- 11.1.8.3. Company Financials
- 11.1.8.4. SWOT Analysis
- 11.1.1 Firmenich SA
- 11.2. Market Entropy
- 11.2.1 Company's Key Areas Served
- 11.2.2 Recent Developments
- 11.3. Company Market Share Analysis 2025
- 11.3.1 Top 5 Companies Market Share Analysis
- 11.3.2 Top 3 Companies Market Share Analysis
- 11.4. List of Potential Customers
- 12. Research Methodology
List of Figures
- Figure 1: Global Natural Food Flavors Industry Revenue Breakdown (billion, %) by Region 2025 & 2033
- Figure 2: North America Natural Food Flavors Industry Revenue (billion), by Application Type 2025 & 2033
- Figure 3: North America Natural Food Flavors Industry Revenue Share (%), by Application Type 2025 & 2033
- Figure 4: North America Natural Food Flavors Industry Revenue (billion), by Country 2025 & 2033
- Figure 5: North America Natural Food Flavors Industry Revenue Share (%), by Country 2025 & 2033
- Figure 6: Europe Natural Food Flavors Industry Revenue (billion), by Application Type 2025 & 2033
- Figure 7: Europe Natural Food Flavors Industry Revenue Share (%), by Application Type 2025 & 2033
- Figure 8: Europe Natural Food Flavors Industry Revenue (billion), by Country 2025 & 2033
- Figure 9: Europe Natural Food Flavors Industry Revenue Share (%), by Country 2025 & 2033
- Figure 10: Asia Pacific Natural Food Flavors Industry Revenue (billion), by Application Type 2025 & 2033
- Figure 11: Asia Pacific Natural Food Flavors Industry Revenue Share (%), by Application Type 2025 & 2033
- Figure 12: Asia Pacific Natural Food Flavors Industry Revenue (billion), by Country 2025 & 2033
- Figure 13: Asia Pacific Natural Food Flavors Industry Revenue Share (%), by Country 2025 & 2033
- Figure 14: Rest of the World Natural Food Flavors Industry Revenue (billion), by Application Type 2025 & 2033
- Figure 15: Rest of the World Natural Food Flavors Industry Revenue Share (%), by Application Type 2025 & 2033
- Figure 16: Rest of the World Natural Food Flavors Industry Revenue (billion), by Country 2025 & 2033
- Figure 17: Rest of the World Natural Food Flavors Industry Revenue Share (%), by Country 2025 & 2033
List of Tables
- Table 1: Global Natural Food Flavors Industry Revenue billion Forecast, by Application Type 2020 & 2033
- Table 2: Global Natural Food Flavors Industry Revenue billion Forecast, by Region 2020 & 2033
- Table 3: Global Natural Food Flavors Industry Revenue billion Forecast, by Application Type 2020 & 2033
- Table 4: Global Natural Food Flavors Industry Revenue billion Forecast, by Country 2020 & 2033
- Table 5: United States Natural Food Flavors Industry Revenue (billion) Forecast, by Application 2020 & 2033
- Table 6: Canada Natural Food Flavors Industry Revenue (billion) Forecast, by Application 2020 & 2033
- Table 7: Mexico Natural Food Flavors Industry Revenue (billion) Forecast, by Application 2020 & 2033
- Table 8: Rest of North America Natural Food Flavors Industry Revenue (billion) Forecast, by Application 2020 & 2033
- Table 9: Global Natural Food Flavors Industry Revenue billion Forecast, by Application Type 2020 & 2033
- Table 10: Global Natural Food Flavors Industry Revenue billion Forecast, by Country 2020 & 2033
- Table 11: Germany Natural Food Flavors Industry Revenue (billion) Forecast, by Application 2020 & 2033
- Table 12: United Kingdom Natural Food Flavors Industry Revenue (billion) Forecast, by Application 2020 & 2033
- Table 13: France Natural Food Flavors Industry Revenue (billion) Forecast, by Application 2020 & 2033
- Table 14: Spain Natural Food Flavors Industry Revenue (billion) Forecast, by Application 2020 & 2033
- Table 15: Italy Natural Food Flavors Industry Revenue (billion) Forecast, by Application 2020 & 2033
- Table 16: Rest of Europe Natural Food Flavors Industry Revenue (billion) Forecast, by Application 2020 & 2033
- Table 17: Global Natural Food Flavors Industry Revenue billion Forecast, by Application Type 2020 & 2033
- Table 18: Global Natural Food Flavors Industry Revenue billion Forecast, by Country 2020 & 2033
- Table 19: China Natural Food Flavors Industry Revenue (billion) Forecast, by Application 2020 & 2033
- Table 20: Japan Natural Food Flavors Industry Revenue (billion) Forecast, by Application 2020 & 2033
- Table 21: India Natural Food Flavors Industry Revenue (billion) Forecast, by Application 2020 & 2033
- Table 22: Australia Natural Food Flavors Industry Revenue (billion) Forecast, by Application 2020 & 2033
- Table 23: Rest of Asia Pacific Natural Food Flavors Industry Revenue (billion) Forecast, by Application 2020 & 2033
- Table 24: Global Natural Food Flavors Industry Revenue billion Forecast, by Application Type 2020 & 2033
- Table 25: Global Natural Food Flavors Industry Revenue billion Forecast, by Country 2020 & 2033
- Table 26: South America Natural Food Flavors Industry Revenue (billion) Forecast, by Application 2020 & 2033
- Table 27: Middle East Natural Food Flavors Industry Revenue (billion) Forecast, by Application 2020 & 2033
Frequently Asked Questions
1. What is the projected Compound Annual Growth Rate (CAGR) of the Natural Food Flavors Industry?
The projected CAGR is approximately 6.2%.
2. Which companies are prominent players in the Natural Food Flavors Industry?
Key companies in the market include Firmenich SA, International Flavors & Fragrances Inc, Givaudan SA, Archer Daniels Midland Company, Sensient Technologies*List Not Exhaustive, BASF SE, Kerry Group PLC, Corbion NV.
3. What are the main segments of the Natural Food Flavors Industry?
The market segments include Application Type.
4. Can you provide details about the market size?
The market size is estimated to be USD 8.3 billion as of 2022.
5. What are some drivers contributing to market growth?
Demand for Convenient Ready-to-Eat Food Products; Growing Affinity Toward Ethnic and Organic Frozen Ready Meals.
6. What are the notable trends driving market growth?
Resurgance of Natural Food Products Among Consumers.
7. Are there any restraints impacting market growth?
Rising Concerns Over Food Safety and Quality.
8. Can you provide examples of recent developments in the market?
N/A
9. What pricing options are available for accessing the report?
Pricing options include single-user, multi-user, and enterprise licenses priced at USD 4750, USD 5250, and USD 8750 respectively.
10. Is the market size provided in terms of value or volume?
The market size is provided in terms of value, measured in billion.
11. Are there any specific market keywords associated with the report?
Yes, the market keyword associated with the report is "Natural Food Flavors Industry," which aids in identifying and referencing the specific market segment covered.
12. How do I determine which pricing option suits my needs best?
The pricing options vary based on user requirements and access needs. Individual users may opt for single-user licenses, while businesses requiring broader access may choose multi-user or enterprise licenses for cost-effective access to the report.
13. Are there any additional resources or data provided in the Natural Food Flavors Industry report?
While the report offers comprehensive insights, it's advisable to review the specific contents or supplementary materials provided to ascertain if additional resources or data are available.
14. How can I stay updated on further developments or reports in the Natural Food Flavors Industry?
To stay informed about further developments, trends, and reports in the Natural Food Flavors Industry, consider subscribing to industry newsletters, following relevant companies and organizations, or regularly checking reputable industry news sources and publications.
Methodology
Step 1 - Identification of Relevant Samples Size from Population Database


Step 2 - Approaches for Defining Global Market Size (Value, Volume* & Price*)

Note*: In applicable scenarios
Step 3 - Data Sources
Primary Research
- Web Analytics
- Survey Reports
- Research Institute
- Latest Research Reports
- Opinion Leaders
Secondary Research
- Annual Reports
- White Paper
- Latest Press Release
- Industry Association
- Paid Database
- Investor Presentations

Step 4 - Data Triangulation
Involves using different sources of information in order to increase the validity of a study
These sources are likely to be stakeholders in a program - participants, other researchers, program staff, other community members, and so on.
Then we put all data in single framework & apply various statistical tools to find out the dynamic on the market.
During the analysis stage, feedback from the stakeholder groups would be compared to determine areas of agreement as well as areas of divergence