

Key Insights
The global natural melatonin supplement market is experiencing robust expansion, driven by heightened consumer awareness of its sleep-enhancing properties and the escalating prevalence of sleep disorders. Projected to reach approximately $529.86 million by 2025, the market is anticipated to sustain a significant compound annual growth rate (CAGR) exceeding 10% through 2033. Key growth drivers include the increasing adoption of natural remedies for sleep disturbances, an expanding geriatric population prone to sleep issues, and rising stress levels associated with modern lifestyles, which are consequently elevating demand for sleep aids. The dietary supplement segment currently leads, reflecting consumer preference for accessible, natural, over-the-counter solutions. However, ongoing research into melatonin's therapeutic applications is fostering greater integration within the medical segment for specific sleep disorders. Geographic expansion, particularly in North America and Asia-Pacific, fueled by large populations and rising disposable incomes, is another crucial growth factor. Potential restraints include concerns regarding long-term melatonin effects and variability in product quality across brands.
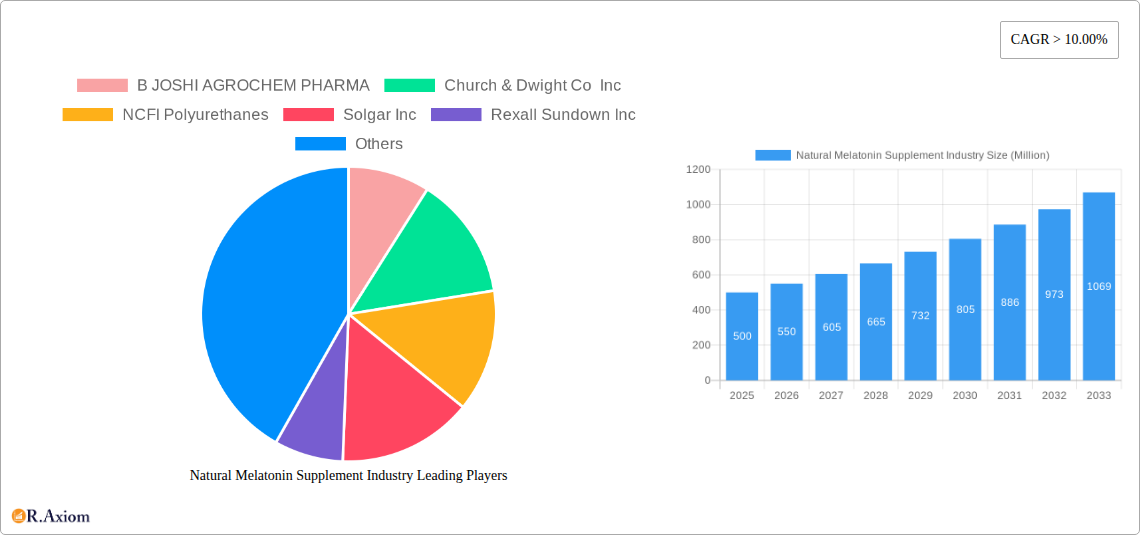
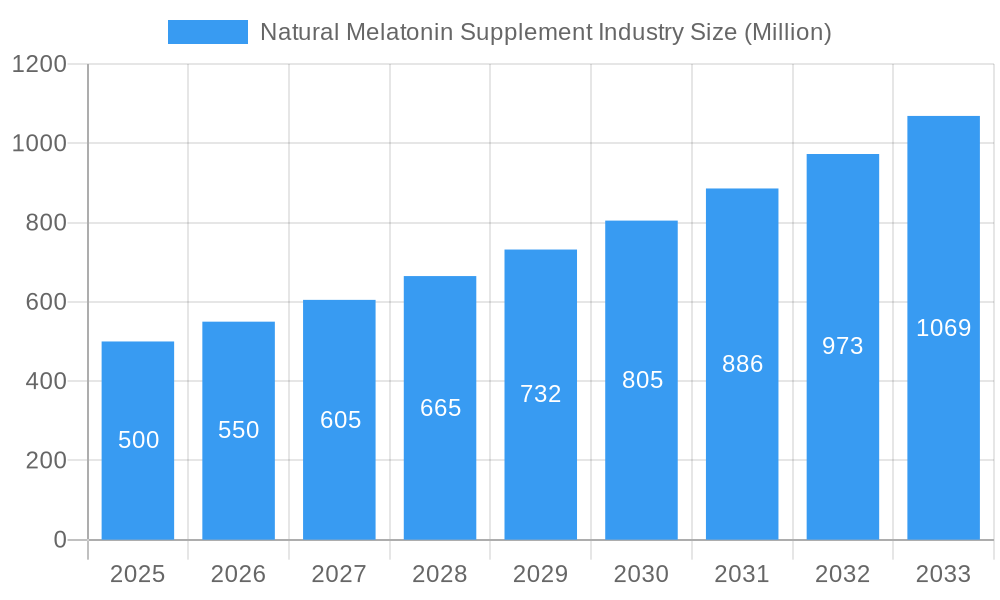
Natural Melatonin Supplement Industry Market Size (In Million)
The market's competitive environment is dynamic, featuring established entities such as Nature's Bounty, Solgar Inc., and Pfizer Inc., alongside emerging niche brands. Success in this sector is contingent upon product quality, impactful marketing emphasizing natural ingredients and proven efficacy, and extensive distribution networks spanning both online and physical retail channels. Future growth will be propelled by innovative product development (e.g., extended-release formulations), strategic distribution partnerships, and continued research validating the safety and effectiveness of natural melatonin supplements for diverse sleep-related conditions. The market's sustained upward trajectory highlights substantial opportunities for companies adept at meeting consumer demand for safe, effective, and natural sleep solutions.
Natural Melatonin Supplement Industry Company Market Share
Natural Melatonin Supplement Industry Market Report: 2019-2033
This comprehensive report provides a detailed analysis of the Natural Melatonin Supplement industry, covering market size, segmentation, growth drivers, challenges, key players, and future outlook. The study period spans from 2019 to 2033, with 2025 serving as the base and estimated year. The report is crucial for industry stakeholders, investors, and market entrants seeking actionable insights into this dynamic sector. The total market size in 2025 is estimated at xx Million.
Natural Melatonin Supplement Industry Market Concentration & Innovation
The natural melatonin supplement market exhibits a moderately consolidated structure, with a few key players holding significant market share. Market concentration is influenced by factors such as brand recognition, distribution networks, and R&D capabilities. While precise market share figures for individual companies are not publicly available, leading players such as Nature's Bounty, Natrol LLC, and Solgar Inc. likely command substantial portions of the market. Innovation in this sector focuses on improving product formulation (e.g., sustained-release melatonin, novel delivery systems), expanding product lines (e.g., melatonin combined with other sleep aids), and enhancing product efficacy and safety. Regulatory frameworks, particularly concerning labeling and dosage claims, significantly impact market dynamics. The market faces competition from other sleep aids, both pharmaceutical and over-the-counter. Consumer trends toward natural and holistic health solutions favor natural melatonin supplements. Mergers and acquisitions (M&A) activity has been moderate, with companies focusing on expanding their product portfolios and strengthening their market positions. The value of M&A deals in recent years has ranged from xx Million to xx Million.
Natural Melatonin Supplement Industry Industry Trends & Insights
The natural melatonin supplement market is experiencing robust growth, driven primarily by the increasing prevalence of sleep disorders, growing consumer awareness of natural health solutions, and the rising demand for convenient and effective sleep aids. The compound annual growth rate (CAGR) during the forecast period (2025-2033) is projected to be xx%. Market penetration is high in developed countries, with significant growth potential in emerging markets. Technological disruptions, particularly in formulation and delivery systems, are enhancing product efficacy and consumer acceptance. Consumer preferences are shifting towards natural, organic, and non-GMO melatonin supplements, driving demand for higher-quality products. Competitive dynamics are shaped by factors such as pricing, product differentiation, brand reputation, and marketing strategies. The market is witnessing an influx of new entrants, alongside aggressive marketing and expansion strategies from established players, which is intensifying competition.
Dominant Markets & Segments in Natural Melatonin Supplement Industry
- Leading Region: North America currently holds the apex position in the natural melatonin supplement market. This dominance is attributed to a confluence of factors including heightened consumer awareness regarding sleep health, robust regulatory frameworks that ensure product quality and safety, and well-established distribution networks facilitating broad accessibility. The region's significant prevalence of sleep disorders, coupled with considerable disposable income and a strong inclination towards proactive self-care and wellness solutions, further solidifies its leadership.
- Leading Country: Within the North American landscape, the United States commands the largest market share. This is propelled by its substantial population base, extensive and varied retail channels encompassing online and brick-and-mortar stores, and aggressive marketing endeavors by leading industry players.
- Dominant Segment (Type): When categorizing by type, natural melatonin supplements represent the more substantial market segment, significantly outpacing synthetic melatonin. A discernible and growing consumer preference for naturally derived products is a primary catalyst for this segment's expansion, reflecting a broader trend towards 'clean label' and plant-based alternatives.
- Dominant Segment (Application): The dietary supplement application segment reigns supreme, catering to a vast and diverse consumer base seeking accessible sleep support. This segment significantly outweighs the medical application segment, which is primarily characterized by prescription-based melatonin products. The dietary supplement segment's growth is further amplified by direct-to-consumer marketing strategies, widespread availability across numerous retail outlets, and supportive economic policies that foster the health and wellness sector. The robust healthcare infrastructure present in developed nations also plays a pivotal role in bolstering the dominance of these segments.
The overarching dominance of North America in this sector is further reinforced by its strong economic footing, sophisticated and well-resourced healthcare systems, and a deeply ingrained cultural emphasis on proactive health management and preventative wellness.
Natural Melatonin Supplement Industry Product Developments
Recent innovations include sustained-release melatonin formulations for improved sleep duration and time-release gummies for easier consumption. Companies are focusing on developing unique product formulations to offer improved efficacy and bioavailability. The integration of melatonin with other sleep-promoting ingredients, such as chamomile and valerian root, has also gained traction. These developments reflect the industry's focus on meeting evolving consumer demands for effective and convenient sleep solutions. The market fit for these new products is strong, driven by consumer preference for natural and improved efficacy.
Report Scope & Segmentation Analysis
This comprehensive report meticulously segments the natural melatonin supplement market, offering deep insights into its various facets. The analysis is structured by Type, distinguishing between Natural Melatonin and Synthetic Melatonin, and by Application, encompassing both Medical and Dietary Supplement uses.
Type:
Natural Melatonin: This segment is poised for robust and accelerated growth, predominantly driven by an escalating consumer demand for natural and organic health products. The market size for natural melatonin supplements, estimated at xx Million in 2025, is projected to ascend to an impressive xx Million by 2033, reflecting a significant compound annual growth rate. The competitive landscape within this segment is highly dynamic, with key players actively engaged in product differentiation, innovative branding, and strategic market penetration to capture a larger share.
Synthetic Melatonin: While currently holding a more modest market share compared to its natural counterpart, the synthetic melatonin segment is anticipated to experience steady and moderate growth. This expansion is fueled by its inherent cost-effectiveness, consistent quality, and established presence in certain therapeutic applications. The market size for synthetic melatonin is estimated at xx Million in 2025 and is projected to reach xx Million by 2033.
Application:
Medical: This segment primarily encompasses prescription-based melatonin products that are integral in the treatment of specific diagnosed sleep disorders. Market growth within this segment is characterized as moderate, largely due to the inherent constraints of prescription-only accessibility. The market size in 2025 is predicted at xx Million, with projections indicating a reach of xx Million by 2033.
Dietary Supplement: Constituting the largest and most dynamic portion of the overall market, the dietary supplement segment is driven by widespread consumer accessibility and demand. The market size is estimated at a substantial xx Million in 2025, with forecasts showing it escalating to xx Million by 2033. The primary growth engines for this segment are high consumer demand for over-the-counter sleep aids and its extensive availability across diverse retail platforms, from pharmacies to online marketplaces.
Key Drivers of Natural Melatonin Supplement Industry Growth
The trajectory of growth for the natural melatonin supplement industry is significantly influenced by a compelling set of interconnected factors. Foremost among these is the escalating global prevalence of sleep disorders, a condition affecting a substantial portion of the population. Concurrently, there is a pronounced and growing consumer preference for natural health solutions, a trend that directly benefits melatonin sourced from natural origins. Increased public awareness regarding the multifaceted benefits of melatonin in improving sleep quality and regulating circadian rhythms further fuels demand. The expanding accessibility of melatonin supplements, facilitated by a proliferation of retail channels including online platforms, pharmacies, and health food stores, also plays a crucial role. Moreover, the rising incidence of stress-induced insomnia, a common byproduct of modern lifestyles, and continuous innovation in delivery systems, such as advanced time-release formulations and fast-acting sublingual options, are substantial contributors to the industry's robust growth.
Challenges in the Natural Melatonin Supplement Industry Sector
Despite its promising growth, the natural melatonin supplement market is not without its hurdles. Stringent and evolving regulatory requirements pertaining to product labeling, health claims, and permissible dosage levels present a consistent challenge for manufacturers. Furthermore, the market grapples with issues of inconsistent product quality and standardization across different brands, leading to potential consumer confusion and dissatisfaction. While generally considered safe, there remains a potential for adverse effects in certain individuals, necessitating careful consumer education. The competitive landscape is exceptionally fierce, with a multitude of other sleep aids, both natural and pharmaceutical, vying for consumer attention and market share. Supply chain disruptions, particularly concerning the sourcing of raw materials, can impact production costs and market availability, thereby affecting overall stability. Additionally, ongoing concerns regarding the purity and precise standardization of melatonin content in supplements continue to be a point of scrutiny, potentially influencing consumer trust and market perception.
Emerging Opportunities in Natural Melatonin Supplement Industry
The natural melatonin supplement industry is ripe with emerging opportunities that promise to shape its future trajectory. A significant avenue lies in the development of personalized melatonin formulations, tailored to the unique sleep patterns and individual needs of consumers, leveraging advancements in diagnostics and personalized nutrition. Expansion into nascent and developing markets, particularly those in regions with growing healthcare awareness and increasing disposable incomes, presents a substantial growth frontier. The strategic integration of melatonin with other synergistic nutraceuticals and adaptogens, aimed at enhancing its efficacy for sleep and promoting overall well-being, offers exciting product development possibilities. Innovations in novel delivery systems, such as advanced sublingual tablets for rapid absorption or sophisticated sustained-release capsules designed for extended efficacy, represent significant technological opportunities. Beyond its primary use for sleep, exploring and validating the potential of melatonin for other associated health applications, such as its antioxidant or anti-inflammatory properties, could unlock entirely new market segments and revenue streams.
Leading Players in the Natural Melatonin Supplement Industry Market
- B JOSHI AGROCHEM PHARMA
- Church & Dwight Co Inc
- NCFI Polyurethanes
- Solgar Inc
- Rexall Sundown Inc
- Nature's Bounty
- Aurobindo Pharma
- Aspen Holdings
- Biotics Research Corporation
- Pharmavite
- Jameison
- Natrol LLC
- Pfizer Inc
Key Developments in Natural Melatonin Supplement Industry Industry
November 2022: Natrol released MelatoninMax, a single-gummy sleep aid containing 10mg of melatonin—the maximum recommended dosage. This launch highlights the ongoing innovation in product formats and dosage optimization.
January 2023: Pfizer Inc.'s increased commitment to the "Agreement for a Healthier World" indicates a broader industry trend toward social responsibility, although its direct impact on the melatonin supplement market is indirect.
Strategic Outlook for Natural Melatonin Supplement Industry Market
The natural melatonin supplement market is poised for continued growth, driven by sustained demand for natural sleep aids, increasing product innovation, and expansion into new geographical markets. Companies will need to focus on product differentiation, robust marketing strategies, and adherence to stringent regulatory standards to maintain a competitive edge. The potential for personalized melatonin products and exploration of synergistic combinations with other nutraceuticals present significant opportunities for future expansion. This growth is expected to continue over the forecast period (2025-2033), presenting lucrative opportunities for market players who can adapt to evolving consumer needs and market dynamics.
Natural Melatonin Supplement Industry Segmentation
-
1. Type
- 1.1. Natural Melatonin
- 1.2. Synthetic Melatonin
-
2. Application
- 2.1. Medical
- 2.2. Dietary Supplement
Natural Melatonin Supplement Industry Segmentation By Geography
-
1. Asia Pacific
- 1.1. China
- 1.2. India
- 1.3. Japan
- 1.4. South Korea
- 1.5. Rest of Asia Pacific
-
2. North America
- 2.1. United States
- 2.2. Canada
- 2.3. Mexico
-
3. Europe
- 3.1. Germany
- 3.2. United Kingdom
- 3.3. France
- 3.4. Italy
- 3.5. Rest of Europe
-
4. South America
- 4.1. Brazil
- 4.2. Argentina
- 4.3. Rest of South America
-
5. Middle East and Africa
- 5.1. Saudi Arabia
- 5.2. South Africa
- 5.3. UAE
- 5.4. Rest of Middle East and Africa
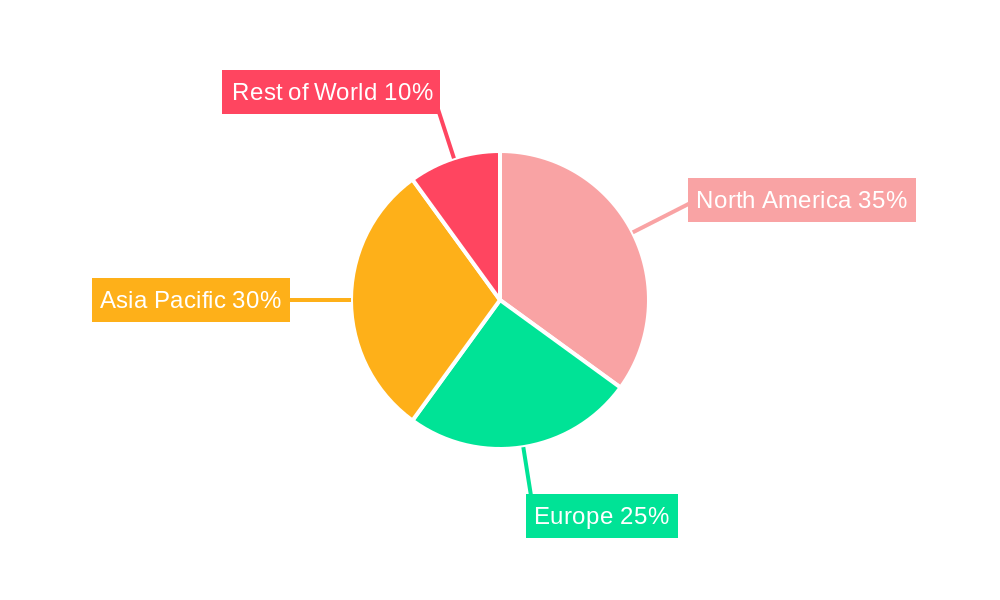
Natural Melatonin Supplement Industry Regional Market Share
Geographic Coverage of Natural Melatonin Supplement Industry
Natural Melatonin Supplement Industry REPORT HIGHLIGHTS
| Aspects | Details |
|---|---|
| Study Period | 2020-2034 |
| Base Year | 2025 |
| Estimated Year | 2026 |
| Forecast Period | 2026-2034 |
| Historical Period | 2020-2025 |
| Growth Rate | CAGR of 10% from 2020-2034 |
| Segmentation |
|
Table of Contents
- 1. Introduction
- 1.1. Research Scope
- 1.2. Market Segmentation
- 1.3. Research Objective
- 1.4. Definitions and Assumptions
- 2. Executive Summary
- 2.1. Market Snapshot
- 3. Market Dynamics
- 3.1. Market Drivers
- 3.2. Market Restrains
- 3.3. Market Trends
- 3.4. Market Opportunities
- 4. Market Factor Analysis
- 4.1. Porters Five Forces
- 4.1.1. Bargaining Power of Suppliers
- 4.1.2. Bargaining Power of Buyers
- 4.1.3. Threat of New Entrants
- 4.1.4. Threat of Substitutes
- 4.1.5. Competitive Rivalry
- 4.2. PESTEL analysis
- 4.3. BCG Analysis
- 4.3.1. Stars (High Growth, High Market Share)
- 4.3.2. Cash Cows (Low Growth, High Market Share)
- 4.3.3. Question Mark (High Growth, Low Market Share)
- 4.3.4. Dogs (Low Growth, Low Market Share)
- 4.4. Ansoff Matrix Analysis
- 4.5. Supply Chain Analysis
- 4.6. Regulatory Landscape
- 4.7. Current Market Potential and Opportunity Assessment (TAM–SAM–SOM Framework)
- 4.8. RAX Analyst Note
- 4.1. Porters Five Forces
- 5. Market Analysis, Insights and Forecast 2021-2033
- 5.1. Market Analysis, Insights and Forecast - by Type
- 5.1.1. Natural Melatonin
- 5.1.2. Synthetic Melatonin
- 5.2. Market Analysis, Insights and Forecast - by Application
- 5.2.1. Medical
- 5.2.2. Dietary Supplement
- 5.3. Market Analysis, Insights and Forecast - by Region
- 5.3.1. Asia Pacific
- 5.3.2. North America
- 5.3.3. Europe
- 5.3.4. South America
- 5.3.5. Middle East and Africa
- 5.1. Market Analysis, Insights and Forecast - by Type
- 6. Global Natural Melatonin Supplement Industry Analysis, Insights and Forecast, 2021-2033
- 6.1. Market Analysis, Insights and Forecast - by Type
- 6.1.1. Natural Melatonin
- 6.1.2. Synthetic Melatonin
- 6.2. Market Analysis, Insights and Forecast - by Application
- 6.2.1. Medical
- 6.2.2. Dietary Supplement
- 6.1. Market Analysis, Insights and Forecast - by Type
- 7. Asia Pacific Natural Melatonin Supplement Industry Analysis, Insights and Forecast, 2020-2032
- 7.1. Market Analysis, Insights and Forecast - by Type
- 7.1.1. Natural Melatonin
- 7.1.2. Synthetic Melatonin
- 7.2. Market Analysis, Insights and Forecast - by Application
- 7.2.1. Medical
- 7.2.2. Dietary Supplement
- 7.1. Market Analysis, Insights and Forecast - by Type
- 8. North America Natural Melatonin Supplement Industry Analysis, Insights and Forecast, 2020-2032
- 8.1. Market Analysis, Insights and Forecast - by Type
- 8.1.1. Natural Melatonin
- 8.1.2. Synthetic Melatonin
- 8.2. Market Analysis, Insights and Forecast - by Application
- 8.2.1. Medical
- 8.2.2. Dietary Supplement
- 8.1. Market Analysis, Insights and Forecast - by Type
- 9. Europe Natural Melatonin Supplement Industry Analysis, Insights and Forecast, 2020-2032
- 9.1. Market Analysis, Insights and Forecast - by Type
- 9.1.1. Natural Melatonin
- 9.1.2. Synthetic Melatonin
- 9.2. Market Analysis, Insights and Forecast - by Application
- 9.2.1. Medical
- 9.2.2. Dietary Supplement
- 9.1. Market Analysis, Insights and Forecast - by Type
- 10. South America Natural Melatonin Supplement Industry Analysis, Insights and Forecast, 2020-2032
- 10.1. Market Analysis, Insights and Forecast - by Type
- 10.1.1. Natural Melatonin
- 10.1.2. Synthetic Melatonin
- 10.2. Market Analysis, Insights and Forecast - by Application
- 10.2.1. Medical
- 10.2.2. Dietary Supplement
- 10.1. Market Analysis, Insights and Forecast - by Type
- 11. Middle East and Africa Natural Melatonin Supplement Industry Analysis, Insights and Forecast, 2020-2032
- 11.1. Market Analysis, Insights and Forecast - by Type
- 11.1.1. Natural Melatonin
- 11.1.2. Synthetic Melatonin
- 11.2. Market Analysis, Insights and Forecast - by Application
- 11.2.1. Medical
- 11.2.2. Dietary Supplement
- 11.1. Market Analysis, Insights and Forecast - by Type
- 12. Competitive Analysis
- 12.1. Company Profiles
- 12.1.1 B JOSHI AGROCHEM PHARMA
- 12.1.1.1. Company Overview
- 12.1.1.2. Products
- 12.1.1.3. Company Financials
- 12.1.1.4. SWOT Analysis
- 12.1.2 Church & Dwight Co Inc
- 12.1.2.1. Company Overview
- 12.1.2.2. Products
- 12.1.2.3. Company Financials
- 12.1.2.4. SWOT Analysis
- 12.1.3 NCFI Polyurethanes
- 12.1.3.1. Company Overview
- 12.1.3.2. Products
- 12.1.3.3. Company Financials
- 12.1.3.4. SWOT Analysis
- 12.1.4 Solgar Inc
- 12.1.4.1. Company Overview
- 12.1.4.2. Products
- 12.1.4.3. Company Financials
- 12.1.4.4. SWOT Analysis
- 12.1.5 Rexall Sundown Inc
- 12.1.5.1. Company Overview
- 12.1.5.2. Products
- 12.1.5.3. Company Financials
- 12.1.5.4. SWOT Analysis
- 12.1.6 Nature's Bounty
- 12.1.6.1. Company Overview
- 12.1.6.2. Products
- 12.1.6.3. Company Financials
- 12.1.6.4. SWOT Analysis
- 12.1.7 Aurobindo Pharma
- 12.1.7.1. Company Overview
- 12.1.7.2. Products
- 12.1.7.3. Company Financials
- 12.1.7.4. SWOT Analysis
- 12.1.8 Aspen Holdings
- 12.1.8.1. Company Overview
- 12.1.8.2. Products
- 12.1.8.3. Company Financials
- 12.1.8.4. SWOT Analysis
- 12.1.9 Biotics Research Corporation
- 12.1.9.1. Company Overview
- 12.1.9.2. Products
- 12.1.9.3. Company Financials
- 12.1.9.4. SWOT Analysis
- 12.1.10 Pharmavite
- 12.1.10.1. Company Overview
- 12.1.10.2. Products
- 12.1.10.3. Company Financials
- 12.1.10.4. SWOT Analysis
- 12.1.11 Jameison
- 12.1.11.1. Company Overview
- 12.1.11.2. Products
- 12.1.11.3. Company Financials
- 12.1.11.4. SWOT Analysis
- 12.1.12 Natrol LLC
- 12.1.12.1. Company Overview
- 12.1.12.2. Products
- 12.1.12.3. Company Financials
- 12.1.12.4. SWOT Analysis
- 12.1.13 Pfizer Inc
- 12.1.13.1. Company Overview
- 12.1.13.2. Products
- 12.1.13.3. Company Financials
- 12.1.13.4. SWOT Analysis
- 12.1.1 B JOSHI AGROCHEM PHARMA
- 12.2. Market Entropy
- 12.2.1 Company's Key Areas Served
- 12.2.2 Recent Developments
- 12.3. Company Market Share Analysis 2025
- 12.3.1 Top 5 Companies Market Share Analysis
- 12.3.2 Top 3 Companies Market Share Analysis
- 12.4. List of Potential Customers
- 13. Research Methodology
List of Figures
- Figure 1: Global Natural Melatonin Supplement Industry Revenue Breakdown (million, %) by Region 2025 & 2033
- Figure 2: Global Natural Melatonin Supplement Industry Volume Breakdown (K Tons, %) by Region 2025 & 2033
- Figure 3: Asia Pacific Natural Melatonin Supplement Industry Revenue (million), by Type 2025 & 2033
- Figure 4: Asia Pacific Natural Melatonin Supplement Industry Volume (K Tons), by Type 2025 & 2033
- Figure 5: Asia Pacific Natural Melatonin Supplement Industry Revenue Share (%), by Type 2025 & 2033
- Figure 6: Asia Pacific Natural Melatonin Supplement Industry Volume Share (%), by Type 2025 & 2033
- Figure 7: Asia Pacific Natural Melatonin Supplement Industry Revenue (million), by Application 2025 & 2033
- Figure 8: Asia Pacific Natural Melatonin Supplement Industry Volume (K Tons), by Application 2025 & 2033
- Figure 9: Asia Pacific Natural Melatonin Supplement Industry Revenue Share (%), by Application 2025 & 2033
- Figure 10: Asia Pacific Natural Melatonin Supplement Industry Volume Share (%), by Application 2025 & 2033
- Figure 11: Asia Pacific Natural Melatonin Supplement Industry Revenue (million), by Country 2025 & 2033
- Figure 12: Asia Pacific Natural Melatonin Supplement Industry Volume (K Tons), by Country 2025 & 2033
- Figure 13: Asia Pacific Natural Melatonin Supplement Industry Revenue Share (%), by Country 2025 & 2033
- Figure 14: Asia Pacific Natural Melatonin Supplement Industry Volume Share (%), by Country 2025 & 2033
- Figure 15: North America Natural Melatonin Supplement Industry Revenue (million), by Type 2025 & 2033
- Figure 16: North America Natural Melatonin Supplement Industry Volume (K Tons), by Type 2025 & 2033
- Figure 17: North America Natural Melatonin Supplement Industry Revenue Share (%), by Type 2025 & 2033
- Figure 18: North America Natural Melatonin Supplement Industry Volume Share (%), by Type 2025 & 2033
- Figure 19: North America Natural Melatonin Supplement Industry Revenue (million), by Application 2025 & 2033
- Figure 20: North America Natural Melatonin Supplement Industry Volume (K Tons), by Application 2025 & 2033
- Figure 21: North America Natural Melatonin Supplement Industry Revenue Share (%), by Application 2025 & 2033
- Figure 22: North America Natural Melatonin Supplement Industry Volume Share (%), by Application 2025 & 2033
- Figure 23: North America Natural Melatonin Supplement Industry Revenue (million), by Country 2025 & 2033
- Figure 24: North America Natural Melatonin Supplement Industry Volume (K Tons), by Country 2025 & 2033
- Figure 25: North America Natural Melatonin Supplement Industry Revenue Share (%), by Country 2025 & 2033
- Figure 26: North America Natural Melatonin Supplement Industry Volume Share (%), by Country 2025 & 2033
- Figure 27: Europe Natural Melatonin Supplement Industry Revenue (million), by Type 2025 & 2033
- Figure 28: Europe Natural Melatonin Supplement Industry Volume (K Tons), by Type 2025 & 2033
- Figure 29: Europe Natural Melatonin Supplement Industry Revenue Share (%), by Type 2025 & 2033
- Figure 30: Europe Natural Melatonin Supplement Industry Volume Share (%), by Type 2025 & 2033
- Figure 31: Europe Natural Melatonin Supplement Industry Revenue (million), by Application 2025 & 2033
- Figure 32: Europe Natural Melatonin Supplement Industry Volume (K Tons), by Application 2025 & 2033
- Figure 33: Europe Natural Melatonin Supplement Industry Revenue Share (%), by Application 2025 & 2033
- Figure 34: Europe Natural Melatonin Supplement Industry Volume Share (%), by Application 2025 & 2033
- Figure 35: Europe Natural Melatonin Supplement Industry Revenue (million), by Country 2025 & 2033
- Figure 36: Europe Natural Melatonin Supplement Industry Volume (K Tons), by Country 2025 & 2033
- Figure 37: Europe Natural Melatonin Supplement Industry Revenue Share (%), by Country 2025 & 2033
- Figure 38: Europe Natural Melatonin Supplement Industry Volume Share (%), by Country 2025 & 2033
- Figure 39: South America Natural Melatonin Supplement Industry Revenue (million), by Type 2025 & 2033
- Figure 40: South America Natural Melatonin Supplement Industry Volume (K Tons), by Type 2025 & 2033
- Figure 41: South America Natural Melatonin Supplement Industry Revenue Share (%), by Type 2025 & 2033
- Figure 42: South America Natural Melatonin Supplement Industry Volume Share (%), by Type 2025 & 2033
- Figure 43: South America Natural Melatonin Supplement Industry Revenue (million), by Application 2025 & 2033
- Figure 44: South America Natural Melatonin Supplement Industry Volume (K Tons), by Application 2025 & 2033
- Figure 45: South America Natural Melatonin Supplement Industry Revenue Share (%), by Application 2025 & 2033
- Figure 46: South America Natural Melatonin Supplement Industry Volume Share (%), by Application 2025 & 2033
- Figure 47: South America Natural Melatonin Supplement Industry Revenue (million), by Country 2025 & 2033
- Figure 48: South America Natural Melatonin Supplement Industry Volume (K Tons), by Country 2025 & 2033
- Figure 49: South America Natural Melatonin Supplement Industry Revenue Share (%), by Country 2025 & 2033
- Figure 50: South America Natural Melatonin Supplement Industry Volume Share (%), by Country 2025 & 2033
- Figure 51: Middle East and Africa Natural Melatonin Supplement Industry Revenue (million), by Type 2025 & 2033
- Figure 52: Middle East and Africa Natural Melatonin Supplement Industry Volume (K Tons), by Type 2025 & 2033
- Figure 53: Middle East and Africa Natural Melatonin Supplement Industry Revenue Share (%), by Type 2025 & 2033
- Figure 54: Middle East and Africa Natural Melatonin Supplement Industry Volume Share (%), by Type 2025 & 2033
- Figure 55: Middle East and Africa Natural Melatonin Supplement Industry Revenue (million), by Application 2025 & 2033
- Figure 56: Middle East and Africa Natural Melatonin Supplement Industry Volume (K Tons), by Application 2025 & 2033
- Figure 57: Middle East and Africa Natural Melatonin Supplement Industry Revenue Share (%), by Application 2025 & 2033
- Figure 58: Middle East and Africa Natural Melatonin Supplement Industry Volume Share (%), by Application 2025 & 2033
- Figure 59: Middle East and Africa Natural Melatonin Supplement Industry Revenue (million), by Country 2025 & 2033
- Figure 60: Middle East and Africa Natural Melatonin Supplement Industry Volume (K Tons), by Country 2025 & 2033
- Figure 61: Middle East and Africa Natural Melatonin Supplement Industry Revenue Share (%), by Country 2025 & 2033
- Figure 62: Middle East and Africa Natural Melatonin Supplement Industry Volume Share (%), by Country 2025 & 2033
List of Tables
- Table 1: Global Natural Melatonin Supplement Industry Revenue million Forecast, by Type 2020 & 2033
- Table 2: Global Natural Melatonin Supplement Industry Volume K Tons Forecast, by Type 2020 & 2033
- Table 3: Global Natural Melatonin Supplement Industry Revenue million Forecast, by Application 2020 & 2033
- Table 4: Global Natural Melatonin Supplement Industry Volume K Tons Forecast, by Application 2020 & 2033
- Table 5: Global Natural Melatonin Supplement Industry Revenue million Forecast, by Region 2020 & 2033
- Table 6: Global Natural Melatonin Supplement Industry Volume K Tons Forecast, by Region 2020 & 2033
- Table 7: Global Natural Melatonin Supplement Industry Revenue million Forecast, by Type 2020 & 2033
- Table 8: Global Natural Melatonin Supplement Industry Volume K Tons Forecast, by Type 2020 & 2033
- Table 9: Global Natural Melatonin Supplement Industry Revenue million Forecast, by Application 2020 & 2033
- Table 10: Global Natural Melatonin Supplement Industry Volume K Tons Forecast, by Application 2020 & 2033
- Table 11: Global Natural Melatonin Supplement Industry Revenue million Forecast, by Country 2020 & 2033
- Table 12: Global Natural Melatonin Supplement Industry Volume K Tons Forecast, by Country 2020 & 2033
- Table 13: China Natural Melatonin Supplement Industry Revenue (million) Forecast, by Application 2020 & 2033
- Table 14: China Natural Melatonin Supplement Industry Volume (K Tons) Forecast, by Application 2020 & 2033
- Table 15: India Natural Melatonin Supplement Industry Revenue (million) Forecast, by Application 2020 & 2033
- Table 16: India Natural Melatonin Supplement Industry Volume (K Tons) Forecast, by Application 2020 & 2033
- Table 17: Japan Natural Melatonin Supplement Industry Revenue (million) Forecast, by Application 2020 & 2033
- Table 18: Japan Natural Melatonin Supplement Industry Volume (K Tons) Forecast, by Application 2020 & 2033
- Table 19: South Korea Natural Melatonin Supplement Industry Revenue (million) Forecast, by Application 2020 & 2033
- Table 20: South Korea Natural Melatonin Supplement Industry Volume (K Tons) Forecast, by Application 2020 & 2033
- Table 21: Rest of Asia Pacific Natural Melatonin Supplement Industry Revenue (million) Forecast, by Application 2020 & 2033
- Table 22: Rest of Asia Pacific Natural Melatonin Supplement Industry Volume (K Tons) Forecast, by Application 2020 & 2033
- Table 23: Global Natural Melatonin Supplement Industry Revenue million Forecast, by Type 2020 & 2033
- Table 24: Global Natural Melatonin Supplement Industry Volume K Tons Forecast, by Type 2020 & 2033
- Table 25: Global Natural Melatonin Supplement Industry Revenue million Forecast, by Application 2020 & 2033
- Table 26: Global Natural Melatonin Supplement Industry Volume K Tons Forecast, by Application 2020 & 2033
- Table 27: Global Natural Melatonin Supplement Industry Revenue million Forecast, by Country 2020 & 2033
- Table 28: Global Natural Melatonin Supplement Industry Volume K Tons Forecast, by Country 2020 & 2033
- Table 29: United States Natural Melatonin Supplement Industry Revenue (million) Forecast, by Application 2020 & 2033
- Table 30: United States Natural Melatonin Supplement Industry Volume (K Tons) Forecast, by Application 2020 & 2033
- Table 31: Canada Natural Melatonin Supplement Industry Revenue (million) Forecast, by Application 2020 & 2033
- Table 32: Canada Natural Melatonin Supplement Industry Volume (K Tons) Forecast, by Application 2020 & 2033
- Table 33: Mexico Natural Melatonin Supplement Industry Revenue (million) Forecast, by Application 2020 & 2033
- Table 34: Mexico Natural Melatonin Supplement Industry Volume (K Tons) Forecast, by Application 2020 & 2033
- Table 35: Global Natural Melatonin Supplement Industry Revenue million Forecast, by Type 2020 & 2033
- Table 36: Global Natural Melatonin Supplement Industry Volume K Tons Forecast, by Type 2020 & 2033
- Table 37: Global Natural Melatonin Supplement Industry Revenue million Forecast, by Application 2020 & 2033
- Table 38: Global Natural Melatonin Supplement Industry Volume K Tons Forecast, by Application 2020 & 2033
- Table 39: Global Natural Melatonin Supplement Industry Revenue million Forecast, by Country 2020 & 2033
- Table 40: Global Natural Melatonin Supplement Industry Volume K Tons Forecast, by Country 2020 & 2033
- Table 41: Germany Natural Melatonin Supplement Industry Revenue (million) Forecast, by Application 2020 & 2033
- Table 42: Germany Natural Melatonin Supplement Industry Volume (K Tons) Forecast, by Application 2020 & 2033
- Table 43: United Kingdom Natural Melatonin Supplement Industry Revenue (million) Forecast, by Application 2020 & 2033
- Table 44: United Kingdom Natural Melatonin Supplement Industry Volume (K Tons) Forecast, by Application 2020 & 2033
- Table 45: France Natural Melatonin Supplement Industry Revenue (million) Forecast, by Application 2020 & 2033
- Table 46: France Natural Melatonin Supplement Industry Volume (K Tons) Forecast, by Application 2020 & 2033
- Table 47: Italy Natural Melatonin Supplement Industry Revenue (million) Forecast, by Application 2020 & 2033
- Table 48: Italy Natural Melatonin Supplement Industry Volume (K Tons) Forecast, by Application 2020 & 2033
- Table 49: Rest of Europe Natural Melatonin Supplement Industry Revenue (million) Forecast, by Application 2020 & 2033
- Table 50: Rest of Europe Natural Melatonin Supplement Industry Volume (K Tons) Forecast, by Application 2020 & 2033
- Table 51: Global Natural Melatonin Supplement Industry Revenue million Forecast, by Type 2020 & 2033
- Table 52: Global Natural Melatonin Supplement Industry Volume K Tons Forecast, by Type 2020 & 2033
- Table 53: Global Natural Melatonin Supplement Industry Revenue million Forecast, by Application 2020 & 2033
- Table 54: Global Natural Melatonin Supplement Industry Volume K Tons Forecast, by Application 2020 & 2033
- Table 55: Global Natural Melatonin Supplement Industry Revenue million Forecast, by Country 2020 & 2033
- Table 56: Global Natural Melatonin Supplement Industry Volume K Tons Forecast, by Country 2020 & 2033
- Table 57: Brazil Natural Melatonin Supplement Industry Revenue (million) Forecast, by Application 2020 & 2033
- Table 58: Brazil Natural Melatonin Supplement Industry Volume (K Tons) Forecast, by Application 2020 & 2033
- Table 59: Argentina Natural Melatonin Supplement Industry Revenue (million) Forecast, by Application 2020 & 2033
- Table 60: Argentina Natural Melatonin Supplement Industry Volume (K Tons) Forecast, by Application 2020 & 2033
- Table 61: Rest of South America Natural Melatonin Supplement Industry Revenue (million) Forecast, by Application 2020 & 2033
- Table 62: Rest of South America Natural Melatonin Supplement Industry Volume (K Tons) Forecast, by Application 2020 & 2033
- Table 63: Global Natural Melatonin Supplement Industry Revenue million Forecast, by Type 2020 & 2033
- Table 64: Global Natural Melatonin Supplement Industry Volume K Tons Forecast, by Type 2020 & 2033
- Table 65: Global Natural Melatonin Supplement Industry Revenue million Forecast, by Application 2020 & 2033
- Table 66: Global Natural Melatonin Supplement Industry Volume K Tons Forecast, by Application 2020 & 2033
- Table 67: Global Natural Melatonin Supplement Industry Revenue million Forecast, by Country 2020 & 2033
- Table 68: Global Natural Melatonin Supplement Industry Volume K Tons Forecast, by Country 2020 & 2033
- Table 69: Saudi Arabia Natural Melatonin Supplement Industry Revenue (million) Forecast, by Application 2020 & 2033
- Table 70: Saudi Arabia Natural Melatonin Supplement Industry Volume (K Tons) Forecast, by Application 2020 & 2033
- Table 71: South Africa Natural Melatonin Supplement Industry Revenue (million) Forecast, by Application 2020 & 2033
- Table 72: South Africa Natural Melatonin Supplement Industry Volume (K Tons) Forecast, by Application 2020 & 2033
- Table 73: UAE Natural Melatonin Supplement Industry Revenue (million) Forecast, by Application 2020 & 2033
- Table 74: UAE Natural Melatonin Supplement Industry Volume (K Tons) Forecast, by Application 2020 & 2033
- Table 75: Rest of Middle East and Africa Natural Melatonin Supplement Industry Revenue (million) Forecast, by Application 2020 & 2033
- Table 76: Rest of Middle East and Africa Natural Melatonin Supplement Industry Volume (K Tons) Forecast, by Application 2020 & 2033
Frequently Asked Questions
1. What is the projected Compound Annual Growth Rate (CAGR) of the Natural Melatonin Supplement Industry?
The projected CAGR is approximately 10%.
2. Which companies are prominent players in the Natural Melatonin Supplement Industry?
Key companies in the market include B JOSHI AGROCHEM PHARMA, Church & Dwight Co Inc, NCFI Polyurethanes, Solgar Inc, Rexall Sundown Inc, Nature's Bounty, Aurobindo Pharma, Aspen Holdings, Biotics Research Corporation, Pharmavite, Jameison, Natrol LLC, Pfizer Inc.
3. What are the main segments of the Natural Melatonin Supplement Industry?
The market segments include Type, Application.
4. Can you provide details about the market size?
The market size is estimated to be USD 529.86 million as of 2022.
5. What are some drivers contributing to market growth?
Increasing Demand for Melatonin from the Medical Sector; Other Drivers.
6. What are the notable trends driving market growth?
Increasing Demand for Melatonin from the Medical Industry.
7. Are there any restraints impacting market growth?
Government Regulations on the Use of Melatonin in Insomnia Medicine; Other Restraints.
8. Can you provide examples of recent developments in the market?
January 2023: Pfizer Inc. announced that it has significantly increased its commitment to the "Agreement for a Healthier World" by offering the entire portfolio of medicines and vaccines for which it has global rights on a not-for-profit basis in order to improve the health of 1.2 billion people in 45 low-income countries.
9. What pricing options are available for accessing the report?
Pricing options include single-user, multi-user, and enterprise licenses priced at USD 4750, USD 5250, and USD 8750 respectively.
10. Is the market size provided in terms of value or volume?
The market size is provided in terms of value, measured in million and volume, measured in K Tons.
11. Are there any specific market keywords associated with the report?
Yes, the market keyword associated with the report is "Natural Melatonin Supplement Industry," which aids in identifying and referencing the specific market segment covered.
12. How do I determine which pricing option suits my needs best?
The pricing options vary based on user requirements and access needs. Individual users may opt for single-user licenses, while businesses requiring broader access may choose multi-user or enterprise licenses for cost-effective access to the report.
13. Are there any additional resources or data provided in the Natural Melatonin Supplement Industry report?
While the report offers comprehensive insights, it's advisable to review the specific contents or supplementary materials provided to ascertain if additional resources or data are available.
14. How can I stay updated on further developments or reports in the Natural Melatonin Supplement Industry?
To stay informed about further developments, trends, and reports in the Natural Melatonin Supplement Industry, consider subscribing to industry newsletters, following relevant companies and organizations, or regularly checking reputable industry news sources and publications.
Methodology
Step 1 - Identification of Relevant Samples Size from Population Database


Step 2 - Approaches for Defining Global Market Size (Value, Volume* & Price*)

Note*: In applicable scenarios
Step 3 - Data Sources
Primary Research
- Web Analytics
- Survey Reports
- Research Institute
- Latest Research Reports
- Opinion Leaders
Secondary Research
- Annual Reports
- White Paper
- Latest Press Release
- Industry Association
- Paid Database
- Investor Presentations

Step 4 - Data Triangulation
Involves using different sources of information in order to increase the validity of a study
These sources are likely to be stakeholders in a program - participants, other researchers, program staff, other community members, and so on.
Then we put all data in single framework & apply various statistical tools to find out the dynamic on the market.
During the analysis stage, feedback from the stakeholder groups would be compared to determine areas of agreement as well as areas of divergence