

Key Insights
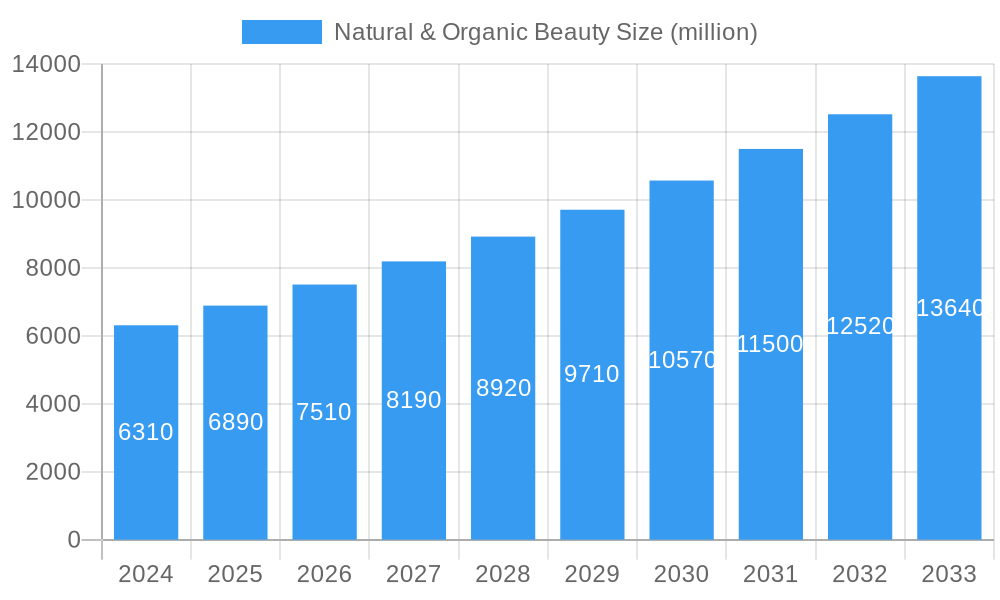
The natural and organic beauty market is experiencing robust growth, driven by increasing consumer awareness of harmful chemicals in conventional cosmetics and a rising preference for sustainable and ethically sourced products. The market, estimated at $15 billion in 2025, is projected to exhibit a Compound Annual Growth Rate (CAGR) of 7% from 2025 to 2033, reaching approximately $25 billion by 2033. This expansion is fueled by several key trends: the growing popularity of vegan and cruelty-free products, the increasing demand for personalized skincare solutions, and a heightened focus on transparency and ingredient traceability within the beauty industry. Key players like Aubrey Organic, Avon Products, Estée Lauder, and Shiseido are strategically investing in research and development, expanding their product lines, and focusing on digital marketing to cater to the evolving consumer preferences.
Natural & Organic Beauty Market Size (In Billion)
However, the market also faces certain restraints. Fluctuations in raw material prices, particularly for organic ingredients, can impact profitability. Furthermore, ensuring consistent quality and supply chain management for organic ingredients poses challenges for many brands. Competition is fierce, with both established players and new entrants vying for market share. Despite these challenges, the long-term outlook for the natural and organic beauty market remains positive, driven by the enduring consumer demand for clean, effective, and sustainable beauty products. Market segmentation, encompassing skincare, makeup, haircare, and other beauty categories, further contributes to the market's diverse and expanding nature. Regional variations in consumer preferences and regulatory landscapes also need to be considered for optimal market penetration and growth strategies.
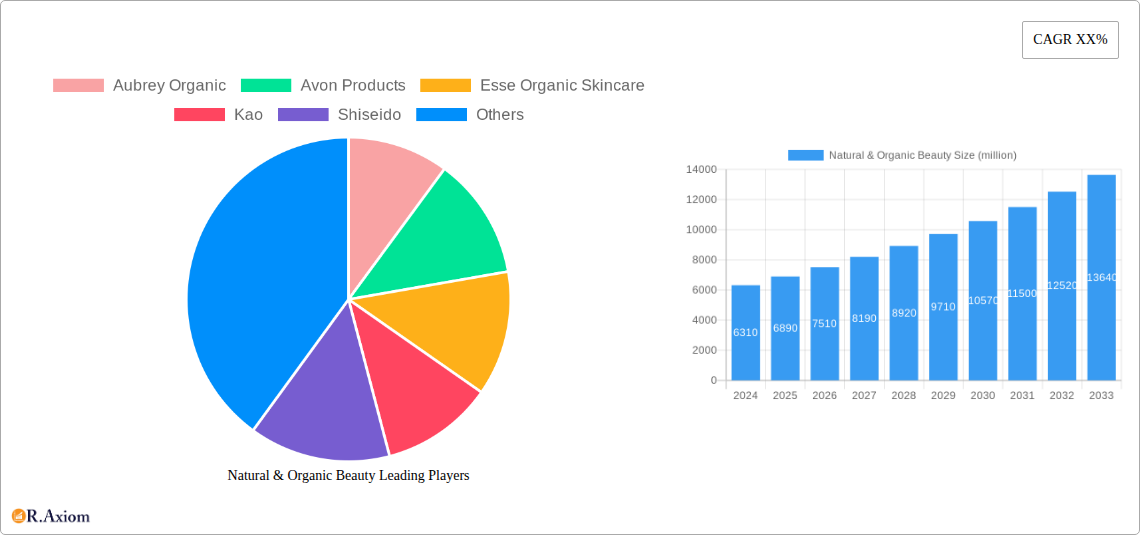
Natural & Organic Beauty Company Market Share
Natural & Organic Beauty Market Report: 2019-2033
This comprehensive report provides a detailed analysis of the global natural and organic beauty market, encompassing market size, growth drivers, competitive landscape, and future trends. The study period covers 2019-2033, with a base year of 2025 and a forecast period of 2025-2033. This in-depth analysis is crucial for industry stakeholders, investors, and businesses seeking to understand and capitalize on the significant opportunities within this dynamic sector. The report incorporates data and analysis on market concentration, innovation, consumer behavior, competitive strategies, and key regulatory factors, providing actionable insights for informed decision-making. The projected market value exceeds $XX million by 2033.
Natural & Organic Beauty Market Concentration & Innovation
The natural and organic beauty market exhibits a moderately concentrated structure, with several large multinational companies and a multitude of smaller niche players. Major players like Estée Lauder, Shiseido, and Kao hold significant market share, leveraging their established distribution networks and brand recognition. However, the market also witnesses substantial innovation from smaller, agile companies focusing on specific consumer segments and unique product formulations. Market share data from 2024 shows Estée Lauder commanding approximately 15% of the market, Shiseido at 12%, and Kao at 10%, while smaller players like Herbivore and Aubrey Organic occupy niche segments. The historical period (2019-2024) saw a flurry of M&A activity, with deal values exceeding $XX million annually, primarily driven by larger companies seeking to expand their portfolios and acquire specialized expertise.
- Market Concentration: High for major players, fragmented for smaller brands.
- Innovation Drivers: Growing consumer demand for natural ingredients, sustainable practices, and personalized products.
- Regulatory Frameworks: Varying regulations across different geographies influencing product formulations and labeling.
- Product Substitutes: Conventional cosmetics and skincare products, posing a competitive threat.
- End-User Trends: Increasing awareness of ingredient transparency and environmental impact drives consumer choices.
- M&A Activities: Significant activity, primarily driven by larger companies expanding their market reach and product portfolios.
Natural & Organic Beauty Industry Trends & Insights
The natural and organic beauty market exhibits robust growth, driven by a confluence of factors. The rising consumer awareness of harmful chemicals in conventional cosmetics fuels the demand for natural alternatives. This trend is further amplified by increasing disposable incomes, particularly in developing economies, enabling consumers to invest in premium, natural products. The CAGR for the period 2025-2033 is projected to be XX%, with market penetration exceeding XX% in major markets by 2033. Technological advancements in ingredient extraction, formulation, and packaging further contribute to the market's expansion. However, competitive pressures from both established players and emerging brands necessitate continuous innovation and brand differentiation. Consumer preferences are shifting towards personalized and customized solutions, creating opportunities for brands offering tailored products and experiences.
Dominant Markets & Segments in Natural & Organic Beauty
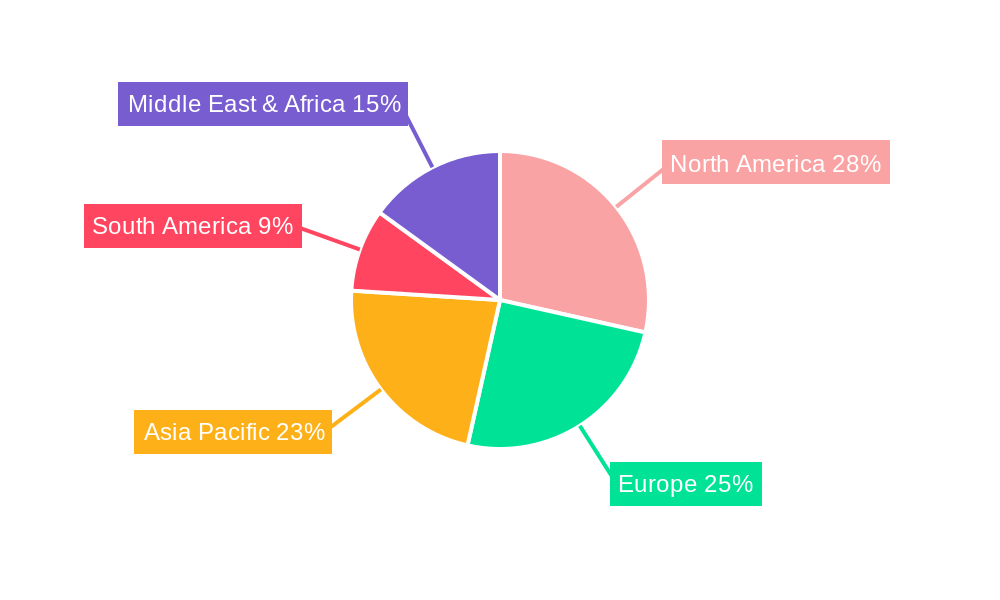
North America dominates the natural and organic beauty market, driven by strong consumer demand, established distribution channels, and a well-developed regulatory framework. Within North America, the United States holds the largest market share.
- Key Drivers (North America):
- High disposable incomes
- Strong consumer awareness of natural ingredients
- Well-developed retail infrastructure
- Favorable regulatory environment
- Dominance Analysis: High consumer spending power coupled with a high level of awareness regarding the benefits of natural and organic products makes North America the leading region. The mature market structure and established distribution channels also contribute to its dominance.
Natural & Organic Beauty Product Developments
Recent product innovations focus on sustainable packaging, unique ingredient combinations harnessing the power of botanicals and other natural sources, and personalized formulations catering to specific skin types and concerns. Technological advancements in ingredient extraction, such as supercritical CO2 extraction, enable the utilization of high-quality natural ingredients while minimizing environmental impact. This trend is reflected in the growing popularity of products emphasizing transparency and traceability in their ingredient sourcing. The market sees a strong focus on multitasking products offering multiple benefits and convenient application.
Report Scope & Segmentation Analysis
This report segments the natural and organic beauty market based on product type (skincare, haircare, makeup, etc.), distribution channel (online, offline), and geography. Each segment's growth trajectory is analyzed, considering market size, growth projections, and competitive dynamics. The skincare segment is projected to maintain its leading position due to the rising consumer awareness of skin health. Online channels are experiencing robust growth, driven by the ease of access and personalized shopping experiences.
Key Drivers of Natural & Organic Beauty Growth
The natural and organic beauty market is propelled by several key factors:
- Growing consumer awareness: Increased awareness regarding the harmful effects of synthetic ingredients and a preference for natural alternatives.
- Rising disposable incomes: Increased purchasing power drives demand for premium natural products.
- Technological advancements: Innovations in extraction techniques, formulation, and packaging enhance product quality and sustainability.
- Favorable regulatory policies: Increased government support and regulations promoting transparency and ethical sourcing.
Challenges in the Natural & Organic Beauty Sector
The sector faces several challenges:
- Stringent regulations: Compliance with varying regulations across different geographies adds complexity and cost.
- Supply chain volatility: Fluctuations in raw material prices and availability pose a challenge to maintaining profitability.
- Intense competition: The market’s rapid growth attracts numerous entrants, leading to intense competition. This results in approximately XX million dollars lost annually in price wars.
Emerging Opportunities in Natural & Organic Beauty
The natural and organic beauty sector presents significant opportunities:
- Expansion into emerging markets: Untapped markets in Asia and Africa offer considerable growth potential.
- Personalization and customization: Growing consumer demand for tailored beauty solutions fuels the growth of personalized product offerings.
- Sustainable packaging and practices: Consumers are increasingly demanding eco-friendly packaging and sustainable manufacturing processes.
Leading Players in the Natural & Organic Beauty Market
Key Developments in Natural & Organic Beauty Industry
- 2022 Q4: Estée Lauder launches a new line of sustainable skincare products.
- 2023 Q1: Shiseido acquires a smaller, innovative natural beauty brand.
- 2023 Q3: Kao introduces a new range of eco-friendly packaging for its natural beauty products.
Strategic Outlook for Natural & Organic Beauty Market
The natural and organic beauty market is poised for continued robust growth, driven by evolving consumer preferences, technological advancements, and increasing regulatory support for sustainable practices. This presents significant opportunities for companies that can adapt to changing consumer demands, embrace innovation, and adopt environmentally friendly strategies. The market's expansion into emerging markets and the rising popularity of personalized and sustainable beauty solutions further strengthen its long-term growth outlook.
Natural & Organic Beauty Segmentation
-
1. Application
- 1.1. Direct Selling
- 1.2. Hypermarkets & Retail Chains
- 1.3. E-Commerce
-
2. Types
- 2.1. Skincare Products
- 2.2. Haircare Products
Natural & Organic Beauty Segmentation By Geography
-
1. North America
- 1.1. United States
- 1.2. Canada
- 1.3. Mexico
-
2. South America
- 2.1. Brazil
- 2.2. Argentina
- 2.3. Rest of South America
-
3. Europe
- 3.1. United Kingdom
- 3.2. Germany
- 3.3. France
- 3.4. Italy
- 3.5. Spain
- 3.6. Russia
- 3.7. Benelux
- 3.8. Nordics
- 3.9. Rest of Europe
-
4. Middle East & Africa
- 4.1. Turkey
- 4.2. Israel
- 4.3. GCC
- 4.4. North Africa
- 4.5. South Africa
- 4.6. Rest of Middle East & Africa
-
5. Asia Pacific
- 5.1. China
- 5.2. India
- 5.3. Japan
- 5.4. South Korea
- 5.5. ASEAN
- 5.6. Oceania
- 5.7. Rest of Asia Pacific
Natural & Organic Beauty Regional Market Share
Geographic Coverage of Natural & Organic Beauty
Natural & Organic Beauty REPORT HIGHLIGHTS
| Aspects | Details |
|---|---|
| Study Period | 2020-2034 |
| Base Year | 2025 |
| Estimated Year | 2026 |
| Forecast Period | 2026-2034 |
| Historical Period | 2020-2025 |
| Growth Rate | CAGR of 4.66% from 2020-2034 |
| Segmentation |
|
Table of Contents
- 1. Introduction
- 1.1. Research Scope
- 1.2. Market Segmentation
- 1.3. Research Methodology
- 1.4. Definitions and Assumptions
- 2. Executive Summary
- 2.1. Introduction
- 3. Market Dynamics
- 3.1. Introduction
- 3.2. Market Drivers
- 3.3. Market Restrains
- 3.4. Market Trends
- 4. Market Factor Analysis
- 4.1. Porters Five Forces
- 4.2. Supply/Value Chain
- 4.3. PESTEL analysis
- 4.4. Market Entropy
- 4.5. Patent/Trademark Analysis
- 5. Global Natural & Organic Beauty Analysis, Insights and Forecast, 2020-2032
- 5.1. Market Analysis, Insights and Forecast - by Application
- 5.1.1. Direct Selling
- 5.1.2. Hypermarkets & Retail Chains
- 5.1.3. E-Commerce
- 5.2. Market Analysis, Insights and Forecast - by Types
- 5.2.1. Skincare Products
- 5.2.2. Haircare Products
- 5.3. Market Analysis, Insights and Forecast - by Region
- 5.3.1. North America
- 5.3.2. South America
- 5.3.3. Europe
- 5.3.4. Middle East & Africa
- 5.3.5. Asia Pacific
- 5.1. Market Analysis, Insights and Forecast - by Application
- 6. North America Natural & Organic Beauty Analysis, Insights and Forecast, 2020-2032
- 6.1. Market Analysis, Insights and Forecast - by Application
- 6.1.1. Direct Selling
- 6.1.2. Hypermarkets & Retail Chains
- 6.1.3. E-Commerce
- 6.2. Market Analysis, Insights and Forecast - by Types
- 6.2.1. Skincare Products
- 6.2.2. Haircare Products
- 6.1. Market Analysis, Insights and Forecast - by Application
- 7. South America Natural & Organic Beauty Analysis, Insights and Forecast, 2020-2032
- 7.1. Market Analysis, Insights and Forecast - by Application
- 7.1.1. Direct Selling
- 7.1.2. Hypermarkets & Retail Chains
- 7.1.3. E-Commerce
- 7.2. Market Analysis, Insights and Forecast - by Types
- 7.2.1. Skincare Products
- 7.2.2. Haircare Products
- 7.1. Market Analysis, Insights and Forecast - by Application
- 8. Europe Natural & Organic Beauty Analysis, Insights and Forecast, 2020-2032
- 8.1. Market Analysis, Insights and Forecast - by Application
- 8.1.1. Direct Selling
- 8.1.2. Hypermarkets & Retail Chains
- 8.1.3. E-Commerce
- 8.2. Market Analysis, Insights and Forecast - by Types
- 8.2.1. Skincare Products
- 8.2.2. Haircare Products
- 8.1. Market Analysis, Insights and Forecast - by Application
- 9. Middle East & Africa Natural & Organic Beauty Analysis, Insights and Forecast, 2020-2032
- 9.1. Market Analysis, Insights and Forecast - by Application
- 9.1.1. Direct Selling
- 9.1.2. Hypermarkets & Retail Chains
- 9.1.3. E-Commerce
- 9.2. Market Analysis, Insights and Forecast - by Types
- 9.2.1. Skincare Products
- 9.2.2. Haircare Products
- 9.1. Market Analysis, Insights and Forecast - by Application
- 10. Asia Pacific Natural & Organic Beauty Analysis, Insights and Forecast, 2020-2032
- 10.1. Market Analysis, Insights and Forecast - by Application
- 10.1.1. Direct Selling
- 10.1.2. Hypermarkets & Retail Chains
- 10.1.3. E-Commerce
- 10.2. Market Analysis, Insights and Forecast - by Types
- 10.2.1. Skincare Products
- 10.2.2. Haircare Products
- 10.1. Market Analysis, Insights and Forecast - by Application
- 11. Competitive Analysis
- 11.1. Global Market Share Analysis 2025
- 11.2. Company Profiles
- 11.2.1 Aubrey Organic
- 11.2.1.1. Overview
- 11.2.1.2. Products
- 11.2.1.3. SWOT Analysis
- 11.2.1.4. Recent Developments
- 11.2.1.5. Financials (Based on Availability)
- 11.2.2 Avon Products
- 11.2.2.1. Overview
- 11.2.2.2. Products
- 11.2.2.3. SWOT Analysis
- 11.2.2.4. Recent Developments
- 11.2.2.5. Financials (Based on Availability)
- 11.2.3 Esse Organic Skincare
- 11.2.3.1. Overview
- 11.2.3.2. Products
- 11.2.3.3. SWOT Analysis
- 11.2.3.4. Recent Developments
- 11.2.3.5. Financials (Based on Availability)
- 11.2.4 Kao
- 11.2.4.1. Overview
- 11.2.4.2. Products
- 11.2.4.3. SWOT Analysis
- 11.2.4.4. Recent Developments
- 11.2.4.5. Financials (Based on Availability)
- 11.2.5 Shiseido
- 11.2.5.1. Overview
- 11.2.5.2. Products
- 11.2.5.3. SWOT Analysis
- 11.2.5.4. Recent Developments
- 11.2.5.5. Financials (Based on Availability)
- 11.2.6 Herbivore
- 11.2.6.1. Overview
- 11.2.6.2. Products
- 11.2.6.3. SWOT Analysis
- 11.2.6.4. Recent Developments
- 11.2.6.5. Financials (Based on Availability)
- 11.2.7 Estée Lauder
- 11.2.7.1. Overview
- 11.2.7.2. Products
- 11.2.7.3. SWOT Analysis
- 11.2.7.4. Recent Developments
- 11.2.7.5. Financials (Based on Availability)
- 11.2.8 Bare Escentuals
- 11.2.8.1. Overview
- 11.2.8.2. Products
- 11.2.8.3. SWOT Analysis
- 11.2.8.4. Recent Developments
- 11.2.8.5. Financials (Based on Availability)
- 11.2.9 Aveda
- 11.2.9.1. Overview
- 11.2.9.2. Products
- 11.2.9.3. SWOT Analysis
- 11.2.9.4. Recent Developments
- 11.2.9.5. Financials (Based on Availability)
- 11.2.10 Kiehl's
- 11.2.10.1. Overview
- 11.2.10.2. Products
- 11.2.10.3. SWOT Analysis
- 11.2.10.4. Recent Developments
- 11.2.10.5. Financials (Based on Availability)
- 11.2.1 Aubrey Organic
List of Figures
- Figure 1: Global Natural & Organic Beauty Revenue Breakdown (undefined, %) by Region 2025 & 2033
- Figure 2: Global Natural & Organic Beauty Volume Breakdown (K, %) by Region 2025 & 2033
- Figure 3: North America Natural & Organic Beauty Revenue (undefined), by Application 2025 & 2033
- Figure 4: North America Natural & Organic Beauty Volume (K), by Application 2025 & 2033
- Figure 5: North America Natural & Organic Beauty Revenue Share (%), by Application 2025 & 2033
- Figure 6: North America Natural & Organic Beauty Volume Share (%), by Application 2025 & 2033
- Figure 7: North America Natural & Organic Beauty Revenue (undefined), by Types 2025 & 2033
- Figure 8: North America Natural & Organic Beauty Volume (K), by Types 2025 & 2033
- Figure 9: North America Natural & Organic Beauty Revenue Share (%), by Types 2025 & 2033
- Figure 10: North America Natural & Organic Beauty Volume Share (%), by Types 2025 & 2033
- Figure 11: North America Natural & Organic Beauty Revenue (undefined), by Country 2025 & 2033
- Figure 12: North America Natural & Organic Beauty Volume (K), by Country 2025 & 2033
- Figure 13: North America Natural & Organic Beauty Revenue Share (%), by Country 2025 & 2033
- Figure 14: North America Natural & Organic Beauty Volume Share (%), by Country 2025 & 2033
- Figure 15: South America Natural & Organic Beauty Revenue (undefined), by Application 2025 & 2033
- Figure 16: South America Natural & Organic Beauty Volume (K), by Application 2025 & 2033
- Figure 17: South America Natural & Organic Beauty Revenue Share (%), by Application 2025 & 2033
- Figure 18: South America Natural & Organic Beauty Volume Share (%), by Application 2025 & 2033
- Figure 19: South America Natural & Organic Beauty Revenue (undefined), by Types 2025 & 2033
- Figure 20: South America Natural & Organic Beauty Volume (K), by Types 2025 & 2033
- Figure 21: South America Natural & Organic Beauty Revenue Share (%), by Types 2025 & 2033
- Figure 22: South America Natural & Organic Beauty Volume Share (%), by Types 2025 & 2033
- Figure 23: South America Natural & Organic Beauty Revenue (undefined), by Country 2025 & 2033
- Figure 24: South America Natural & Organic Beauty Volume (K), by Country 2025 & 2033
- Figure 25: South America Natural & Organic Beauty Revenue Share (%), by Country 2025 & 2033
- Figure 26: South America Natural & Organic Beauty Volume Share (%), by Country 2025 & 2033
- Figure 27: Europe Natural & Organic Beauty Revenue (undefined), by Application 2025 & 2033
- Figure 28: Europe Natural & Organic Beauty Volume (K), by Application 2025 & 2033
- Figure 29: Europe Natural & Organic Beauty Revenue Share (%), by Application 2025 & 2033
- Figure 30: Europe Natural & Organic Beauty Volume Share (%), by Application 2025 & 2033
- Figure 31: Europe Natural & Organic Beauty Revenue (undefined), by Types 2025 & 2033
- Figure 32: Europe Natural & Organic Beauty Volume (K), by Types 2025 & 2033
- Figure 33: Europe Natural & Organic Beauty Revenue Share (%), by Types 2025 & 2033
- Figure 34: Europe Natural & Organic Beauty Volume Share (%), by Types 2025 & 2033
- Figure 35: Europe Natural & Organic Beauty Revenue (undefined), by Country 2025 & 2033
- Figure 36: Europe Natural & Organic Beauty Volume (K), by Country 2025 & 2033
- Figure 37: Europe Natural & Organic Beauty Revenue Share (%), by Country 2025 & 2033
- Figure 38: Europe Natural & Organic Beauty Volume Share (%), by Country 2025 & 2033
- Figure 39: Middle East & Africa Natural & Organic Beauty Revenue (undefined), by Application 2025 & 2033
- Figure 40: Middle East & Africa Natural & Organic Beauty Volume (K), by Application 2025 & 2033
- Figure 41: Middle East & Africa Natural & Organic Beauty Revenue Share (%), by Application 2025 & 2033
- Figure 42: Middle East & Africa Natural & Organic Beauty Volume Share (%), by Application 2025 & 2033
- Figure 43: Middle East & Africa Natural & Organic Beauty Revenue (undefined), by Types 2025 & 2033
- Figure 44: Middle East & Africa Natural & Organic Beauty Volume (K), by Types 2025 & 2033
- Figure 45: Middle East & Africa Natural & Organic Beauty Revenue Share (%), by Types 2025 & 2033
- Figure 46: Middle East & Africa Natural & Organic Beauty Volume Share (%), by Types 2025 & 2033
- Figure 47: Middle East & Africa Natural & Organic Beauty Revenue (undefined), by Country 2025 & 2033
- Figure 48: Middle East & Africa Natural & Organic Beauty Volume (K), by Country 2025 & 2033
- Figure 49: Middle East & Africa Natural & Organic Beauty Revenue Share (%), by Country 2025 & 2033
- Figure 50: Middle East & Africa Natural & Organic Beauty Volume Share (%), by Country 2025 & 2033
- Figure 51: Asia Pacific Natural & Organic Beauty Revenue (undefined), by Application 2025 & 2033
- Figure 52: Asia Pacific Natural & Organic Beauty Volume (K), by Application 2025 & 2033
- Figure 53: Asia Pacific Natural & Organic Beauty Revenue Share (%), by Application 2025 & 2033
- Figure 54: Asia Pacific Natural & Organic Beauty Volume Share (%), by Application 2025 & 2033
- Figure 55: Asia Pacific Natural & Organic Beauty Revenue (undefined), by Types 2025 & 2033
- Figure 56: Asia Pacific Natural & Organic Beauty Volume (K), by Types 2025 & 2033
- Figure 57: Asia Pacific Natural & Organic Beauty Revenue Share (%), by Types 2025 & 2033
- Figure 58: Asia Pacific Natural & Organic Beauty Volume Share (%), by Types 2025 & 2033
- Figure 59: Asia Pacific Natural & Organic Beauty Revenue (undefined), by Country 2025 & 2033
- Figure 60: Asia Pacific Natural & Organic Beauty Volume (K), by Country 2025 & 2033
- Figure 61: Asia Pacific Natural & Organic Beauty Revenue Share (%), by Country 2025 & 2033
- Figure 62: Asia Pacific Natural & Organic Beauty Volume Share (%), by Country 2025 & 2033
List of Tables
- Table 1: Global Natural & Organic Beauty Revenue undefined Forecast, by Application 2020 & 2033
- Table 2: Global Natural & Organic Beauty Volume K Forecast, by Application 2020 & 2033
- Table 3: Global Natural & Organic Beauty Revenue undefined Forecast, by Types 2020 & 2033
- Table 4: Global Natural & Organic Beauty Volume K Forecast, by Types 2020 & 2033
- Table 5: Global Natural & Organic Beauty Revenue undefined Forecast, by Region 2020 & 2033
- Table 6: Global Natural & Organic Beauty Volume K Forecast, by Region 2020 & 2033
- Table 7: Global Natural & Organic Beauty Revenue undefined Forecast, by Application 2020 & 2033
- Table 8: Global Natural & Organic Beauty Volume K Forecast, by Application 2020 & 2033
- Table 9: Global Natural & Organic Beauty Revenue undefined Forecast, by Types 2020 & 2033
- Table 10: Global Natural & Organic Beauty Volume K Forecast, by Types 2020 & 2033
- Table 11: Global Natural & Organic Beauty Revenue undefined Forecast, by Country 2020 & 2033
- Table 12: Global Natural & Organic Beauty Volume K Forecast, by Country 2020 & 2033
- Table 13: United States Natural & Organic Beauty Revenue (undefined) Forecast, by Application 2020 & 2033
- Table 14: United States Natural & Organic Beauty Volume (K) Forecast, by Application 2020 & 2033
- Table 15: Canada Natural & Organic Beauty Revenue (undefined) Forecast, by Application 2020 & 2033
- Table 16: Canada Natural & Organic Beauty Volume (K) Forecast, by Application 2020 & 2033
- Table 17: Mexico Natural & Organic Beauty Revenue (undefined) Forecast, by Application 2020 & 2033
- Table 18: Mexico Natural & Organic Beauty Volume (K) Forecast, by Application 2020 & 2033
- Table 19: Global Natural & Organic Beauty Revenue undefined Forecast, by Application 2020 & 2033
- Table 20: Global Natural & Organic Beauty Volume K Forecast, by Application 2020 & 2033
- Table 21: Global Natural & Organic Beauty Revenue undefined Forecast, by Types 2020 & 2033
- Table 22: Global Natural & Organic Beauty Volume K Forecast, by Types 2020 & 2033
- Table 23: Global Natural & Organic Beauty Revenue undefined Forecast, by Country 2020 & 2033
- Table 24: Global Natural & Organic Beauty Volume K Forecast, by Country 2020 & 2033
- Table 25: Brazil Natural & Organic Beauty Revenue (undefined) Forecast, by Application 2020 & 2033
- Table 26: Brazil Natural & Organic Beauty Volume (K) Forecast, by Application 2020 & 2033
- Table 27: Argentina Natural & Organic Beauty Revenue (undefined) Forecast, by Application 2020 & 2033
- Table 28: Argentina Natural & Organic Beauty Volume (K) Forecast, by Application 2020 & 2033
- Table 29: Rest of South America Natural & Organic Beauty Revenue (undefined) Forecast, by Application 2020 & 2033
- Table 30: Rest of South America Natural & Organic Beauty Volume (K) Forecast, by Application 2020 & 2033
- Table 31: Global Natural & Organic Beauty Revenue undefined Forecast, by Application 2020 & 2033
- Table 32: Global Natural & Organic Beauty Volume K Forecast, by Application 2020 & 2033
- Table 33: Global Natural & Organic Beauty Revenue undefined Forecast, by Types 2020 & 2033
- Table 34: Global Natural & Organic Beauty Volume K Forecast, by Types 2020 & 2033
- Table 35: Global Natural & Organic Beauty Revenue undefined Forecast, by Country 2020 & 2033
- Table 36: Global Natural & Organic Beauty Volume K Forecast, by Country 2020 & 2033
- Table 37: United Kingdom Natural & Organic Beauty Revenue (undefined) Forecast, by Application 2020 & 2033
- Table 38: United Kingdom Natural & Organic Beauty Volume (K) Forecast, by Application 2020 & 2033
- Table 39: Germany Natural & Organic Beauty Revenue (undefined) Forecast, by Application 2020 & 2033
- Table 40: Germany Natural & Organic Beauty Volume (K) Forecast, by Application 2020 & 2033
- Table 41: France Natural & Organic Beauty Revenue (undefined) Forecast, by Application 2020 & 2033
- Table 42: France Natural & Organic Beauty Volume (K) Forecast, by Application 2020 & 2033
- Table 43: Italy Natural & Organic Beauty Revenue (undefined) Forecast, by Application 2020 & 2033
- Table 44: Italy Natural & Organic Beauty Volume (K) Forecast, by Application 2020 & 2033
- Table 45: Spain Natural & Organic Beauty Revenue (undefined) Forecast, by Application 2020 & 2033
- Table 46: Spain Natural & Organic Beauty Volume (K) Forecast, by Application 2020 & 2033
- Table 47: Russia Natural & Organic Beauty Revenue (undefined) Forecast, by Application 2020 & 2033
- Table 48: Russia Natural & Organic Beauty Volume (K) Forecast, by Application 2020 & 2033
- Table 49: Benelux Natural & Organic Beauty Revenue (undefined) Forecast, by Application 2020 & 2033
- Table 50: Benelux Natural & Organic Beauty Volume (K) Forecast, by Application 2020 & 2033
- Table 51: Nordics Natural & Organic Beauty Revenue (undefined) Forecast, by Application 2020 & 2033
- Table 52: Nordics Natural & Organic Beauty Volume (K) Forecast, by Application 2020 & 2033
- Table 53: Rest of Europe Natural & Organic Beauty Revenue (undefined) Forecast, by Application 2020 & 2033
- Table 54: Rest of Europe Natural & Organic Beauty Volume (K) Forecast, by Application 2020 & 2033
- Table 55: Global Natural & Organic Beauty Revenue undefined Forecast, by Application 2020 & 2033
- Table 56: Global Natural & Organic Beauty Volume K Forecast, by Application 2020 & 2033
- Table 57: Global Natural & Organic Beauty Revenue undefined Forecast, by Types 2020 & 2033
- Table 58: Global Natural & Organic Beauty Volume K Forecast, by Types 2020 & 2033
- Table 59: Global Natural & Organic Beauty Revenue undefined Forecast, by Country 2020 & 2033
- Table 60: Global Natural & Organic Beauty Volume K Forecast, by Country 2020 & 2033
- Table 61: Turkey Natural & Organic Beauty Revenue (undefined) Forecast, by Application 2020 & 2033
- Table 62: Turkey Natural & Organic Beauty Volume (K) Forecast, by Application 2020 & 2033
- Table 63: Israel Natural & Organic Beauty Revenue (undefined) Forecast, by Application 2020 & 2033
- Table 64: Israel Natural & Organic Beauty Volume (K) Forecast, by Application 2020 & 2033
- Table 65: GCC Natural & Organic Beauty Revenue (undefined) Forecast, by Application 2020 & 2033
- Table 66: GCC Natural & Organic Beauty Volume (K) Forecast, by Application 2020 & 2033
- Table 67: North Africa Natural & Organic Beauty Revenue (undefined) Forecast, by Application 2020 & 2033
- Table 68: North Africa Natural & Organic Beauty Volume (K) Forecast, by Application 2020 & 2033
- Table 69: South Africa Natural & Organic Beauty Revenue (undefined) Forecast, by Application 2020 & 2033
- Table 70: South Africa Natural & Organic Beauty Volume (K) Forecast, by Application 2020 & 2033
- Table 71: Rest of Middle East & Africa Natural & Organic Beauty Revenue (undefined) Forecast, by Application 2020 & 2033
- Table 72: Rest of Middle East & Africa Natural & Organic Beauty Volume (K) Forecast, by Application 2020 & 2033
- Table 73: Global Natural & Organic Beauty Revenue undefined Forecast, by Application 2020 & 2033
- Table 74: Global Natural & Organic Beauty Volume K Forecast, by Application 2020 & 2033
- Table 75: Global Natural & Organic Beauty Revenue undefined Forecast, by Types 2020 & 2033
- Table 76: Global Natural & Organic Beauty Volume K Forecast, by Types 2020 & 2033
- Table 77: Global Natural & Organic Beauty Revenue undefined Forecast, by Country 2020 & 2033
- Table 78: Global Natural & Organic Beauty Volume K Forecast, by Country 2020 & 2033
- Table 79: China Natural & Organic Beauty Revenue (undefined) Forecast, by Application 2020 & 2033
- Table 80: China Natural & Organic Beauty Volume (K) Forecast, by Application 2020 & 2033
- Table 81: India Natural & Organic Beauty Revenue (undefined) Forecast, by Application 2020 & 2033
- Table 82: India Natural & Organic Beauty Volume (K) Forecast, by Application 2020 & 2033
- Table 83: Japan Natural & Organic Beauty Revenue (undefined) Forecast, by Application 2020 & 2033
- Table 84: Japan Natural & Organic Beauty Volume (K) Forecast, by Application 2020 & 2033
- Table 85: South Korea Natural & Organic Beauty Revenue (undefined) Forecast, by Application 2020 & 2033
- Table 86: South Korea Natural & Organic Beauty Volume (K) Forecast, by Application 2020 & 2033
- Table 87: ASEAN Natural & Organic Beauty Revenue (undefined) Forecast, by Application 2020 & 2033
- Table 88: ASEAN Natural & Organic Beauty Volume (K) Forecast, by Application 2020 & 2033
- Table 89: Oceania Natural & Organic Beauty Revenue (undefined) Forecast, by Application 2020 & 2033
- Table 90: Oceania Natural & Organic Beauty Volume (K) Forecast, by Application 2020 & 2033
- Table 91: Rest of Asia Pacific Natural & Organic Beauty Revenue (undefined) Forecast, by Application 2020 & 2033
- Table 92: Rest of Asia Pacific Natural & Organic Beauty Volume (K) Forecast, by Application 2020 & 2033
Frequently Asked Questions
1. What is the projected Compound Annual Growth Rate (CAGR) of the Natural & Organic Beauty?
The projected CAGR is approximately 4.66%.
2. Which companies are prominent players in the Natural & Organic Beauty?
Key companies in the market include Aubrey Organic, Avon Products, Esse Organic Skincare, Kao, Shiseido, Herbivore, Estée Lauder, Bare Escentuals, Aveda, Kiehl's.
3. What are the main segments of the Natural & Organic Beauty?
The market segments include Application, Types.
4. Can you provide details about the market size?
The market size is estimated to be USD XXX N/A as of 2022.
5. What are some drivers contributing to market growth?
N/A
6. What are the notable trends driving market growth?
N/A
7. Are there any restraints impacting market growth?
N/A
8. Can you provide examples of recent developments in the market?
N/A
9. What pricing options are available for accessing the report?
Pricing options include single-user, multi-user, and enterprise licenses priced at USD 3350.00, USD 5025.00, and USD 6700.00 respectively.
10. Is the market size provided in terms of value or volume?
The market size is provided in terms of value, measured in N/A and volume, measured in K.
11. Are there any specific market keywords associated with the report?
Yes, the market keyword associated with the report is "Natural & Organic Beauty," which aids in identifying and referencing the specific market segment covered.
12. How do I determine which pricing option suits my needs best?
The pricing options vary based on user requirements and access needs. Individual users may opt for single-user licenses, while businesses requiring broader access may choose multi-user or enterprise licenses for cost-effective access to the report.
13. Are there any additional resources or data provided in the Natural & Organic Beauty report?
While the report offers comprehensive insights, it's advisable to review the specific contents or supplementary materials provided to ascertain if additional resources or data are available.
14. How can I stay updated on further developments or reports in the Natural & Organic Beauty?
To stay informed about further developments, trends, and reports in the Natural & Organic Beauty, consider subscribing to industry newsletters, following relevant companies and organizations, or regularly checking reputable industry news sources and publications.
Methodology
Step 1 - Identification of Relevant Samples Size from Population Database


Step 2 - Approaches for Defining Global Market Size (Value, Volume* & Price*)

Note*: In applicable scenarios
Step 3 - Data Sources
Primary Research
- Web Analytics
- Survey Reports
- Research Institute
- Latest Research Reports
- Opinion Leaders
Secondary Research
- Annual Reports
- White Paper
- Latest Press Release
- Industry Association
- Paid Database
- Investor Presentations

Step 4 - Data Triangulation
Involves using different sources of information in order to increase the validity of a study
These sources are likely to be stakeholders in a program - participants, other researchers, program staff, other community members, and so on.
Then we put all data in single framework & apply various statistical tools to find out the dynamic on the market.
During the analysis stage, feedback from the stakeholder groups would be compared to determine areas of agreement as well as areas of divergence