

Key Insights
The global natural soaps market is poised for significant expansion, projected to reach approximately $5.5 billion by 2025. The market is anticipated to grow at a robust Compound Annual Growth Rate (CAGR) of 8.5% from 2025 to 2033. This growth is primarily driven by increasing consumer awareness of the adverse effects of synthetic chemicals in conventional soaps and a rising demand for skin-friendly and environmentally conscious products. Consumers are actively seeking natural ingredients, organic certifications, and sustainable packaging, which are becoming key brand differentiators. The "clean beauty" movement, prioritizing transparency and ethical sourcing, is a major catalyst, compelling manufacturers to reformulate products and adopt eco-friendly practices. The proliferation of e-commerce platforms has broadened access to diverse natural soap brands, empowering niche players to reach a global audience and contributing to market growth. The demand for personalized and artisanal soaps, tailored to specific skin types and concerns, is also a significant trend, creating opportunities for innovation and market segmentation.
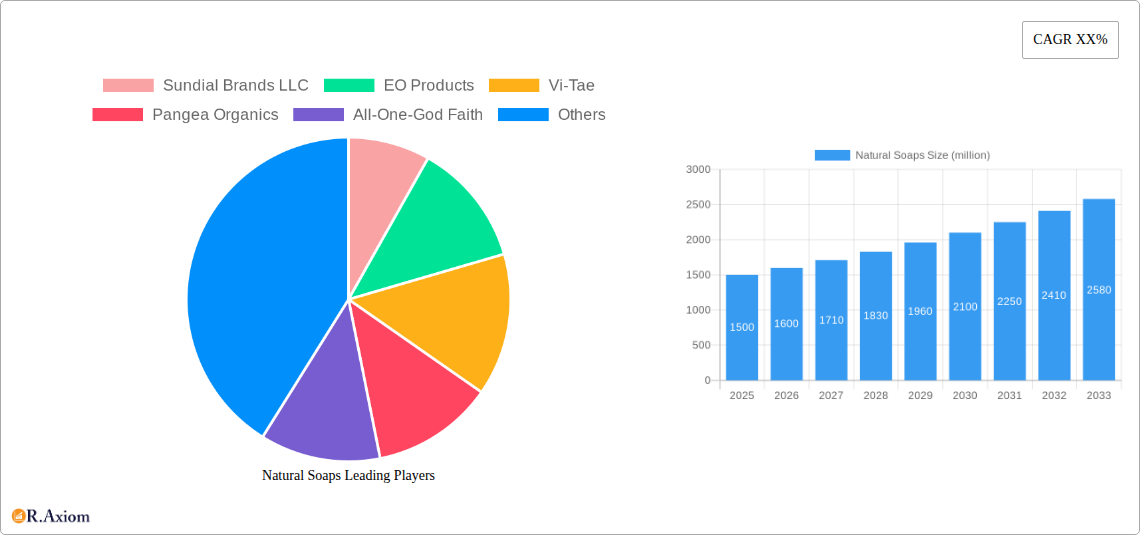
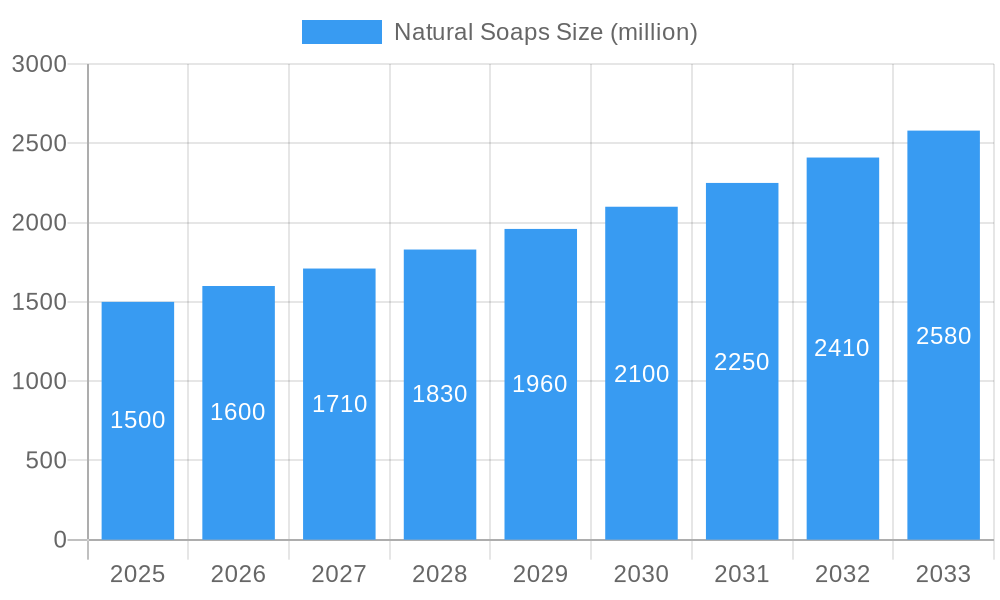
Natural Soaps Market Size (In Billion)
The market exhibits a dynamic segmentation. In terms of sales channels, both online and offline sales contribute to market expansion, with online channels experiencing accelerated growth due to convenience and wider product availability. The natural bar soap segment currently dominates, owing to its extended shelf life, cost-effectiveness, and traditional appeal. However, the natural liquid soap segment is projected for higher CAGR growth, driven by consumer preference for ease of use and hygienic dispensing. Geographically, North America and Europe lead the market, supported by established consumer bases with high disposable incomes and a strong preference for natural and organic products. The Asia Pacific region is emerging as a high-potential market, characterized by a growing middle class, increasing environmental consciousness, and rising demand for premium personal care items. Key market participants are concentrating on product innovation, distribution network expansion, and marketing initiatives that highlight the benefits of natural ingredients to secure market share.
Natural Soaps Company Market Share
This report provides an in-depth analysis of the Natural Soaps Market, including market size, growth trends, and future forecasts.
Natural Soaps Market Concentration & Innovation
The global natural soaps market is characterized by a moderate level of concentration, with several key players holding significant market shares. Innovations are primarily driven by consumer demand for sustainable, organic, and ethically sourced ingredients, leading to the development of specialized soaps catering to various skin concerns and preferences. Regulatory frameworks, particularly concerning ingredient transparency and environmental impact, are influencing product development and marketing strategies. Product substitutes, such as body washes and cleansing bars made with synthetic ingredients, pose a competitive threat, but the growing preference for natural alternatives continues to fuel market growth. End-user trends highlight a strong inclination towards plant-based formulations, artisanal production, and cruelty-free certifications. Mergers and acquisitions (M&A) activities are observed as companies seek to expand their product portfolios and market reach. Anticipated M&A deal values are projected to reach approximately $250 million within the forecast period. Market share for leading natural soap brands currently averages around 8-12%.
- Innovation Drivers: Increasing consumer awareness of chemical sensitivities, demand for eco-friendly packaging, and the rise of personalized skincare routines.
- Regulatory Frameworks: Focus on ingredient sourcing standards, biodegradable packaging mandates, and labeling regulations for organic and natural claims.
- Product Substitutes: Conventional soap bars, synthetic liquid soaps, and specialized cleansing agents.
- End-User Trends: Preference for vegan, gluten-free, and allergen-free formulations; demand for artisanal and small-batch production.
- M&A Activities: Strategic acquisitions aimed at consolidating market presence, integrating new technologies, and expanding distribution networks.
Natural Soaps Industry Trends & Insights
The natural soaps industry is experiencing robust growth, driven by an escalating global consciousness regarding health, wellness, and environmental sustainability. This shift in consumer priorities has propelled the demand for personal care products formulated with natural and organic ingredients, directly benefiting the natural soaps market. The market is projected to grow at a Compound Annual Growth Rate (CAGR) of approximately 7.5% during the forecast period of 2025–2033. Technological advancements in ingredient extraction and formulation techniques are enabling manufacturers to create more effective and diverse natural soap products, ranging from traditional bar soaps to specialized liquid formulations. The penetration of natural soaps in developed economies is already significant, estimated at over 45%, with developing economies showing substantial growth potential.
Key market growth drivers include:
- Increasing Consumer Health Consciousness: A growing awareness of the potential harmful effects of synthetic chemicals found in conventional soaps is leading consumers to seek out natural alternatives. This is particularly evident in skincare, where ingredients are directly applied to the body.
- Environmental Sustainability Concerns: The demand for eco-friendly products has surged. Natural soaps often utilize biodegradable ingredients and more sustainable packaging options, aligning with consumer desires to reduce their environmental footprint.
- Rise of E-commerce and Direct-to-Consumer (DTC) Models: Online sales channels have democratized access to a wide variety of natural soap brands, including smaller artisanal producers. This has expanded market reach and provided consumers with greater choice.
- Ethical Sourcing and Cruelty-Free Movement: A strong ethical consumer base actively seeks out products that are not tested on animals and are produced through fair labor practices. Many natural soap brands prominently feature these certifications.
- Product Differentiation and Customization: Manufacturers are innovating by offering natural soaps with specific benefits, such as for sensitive skin, acne-prone skin, or infused with therapeutic essential oils. This caters to niche market demands.
Technological disruptions are manifesting in improved saponification processes, advanced emulsification techniques for liquid soaps, and the integration of novel natural ingredients with enhanced properties. The competitive dynamics are intensifying, with both established personal care giants entering the natural segment and agile startups carving out unique market positions. Market penetration is expected to continue its upward trajectory as awareness grows and product availability expands across all regions. The overall market size is projected to reach approximately $15,000 million by 2033.
Dominant Markets & Segments in Natural Soaps
The natural soaps market exhibits distinct regional dominance and segment leadership. North America and Europe currently lead in terms of market share and consumer adoption, driven by a well-established consumer base with a high propensity for purchasing natural and organic products. Within these regions, economic policies that support sustainable businesses, coupled with advanced retail infrastructure, facilitate market penetration.
Application:
- Online Sales: This segment has witnessed exponential growth, driven by the convenience of e-commerce platforms and the ability of consumers to access a wider variety of natural soap brands. Online sales are projected to account for over 55% of the total market revenue by 2033. Key drivers include the proliferation of online marketplaces, direct-to-consumer (DTC) brand websites, and targeted digital marketing strategies. The ease of comparison shopping and access to customer reviews further bolsters online sales. The projected market size for online sales is approximately $8,250 million by 2033.
- Offline Sales: This segment, encompassing retail stores, specialty shops, and supermarkets, remains a significant channel, particularly for established brands and for consumers who prefer in-person purchasing. While its share is gradually decreasing compared to online sales, offline channels offer product visibility and impulse purchase opportunities. The projected market size for offline sales is approximately $6,750 million by 2033. Drivers include the extensive reach of traditional retail networks and the impulse purchase behavior of consumers.
Types:
- Natural Bar Soap: This segment has historically been the dominant form of natural soap due to its simplicity, often lower cost, and longer shelf life. Bar soaps are perceived as being more sustainable due to reduced packaging requirements. The market size for natural bar soaps is expected to reach approximately $9,000 million by 2033. Key drivers include consumer preference for traditional formats, lower production costs, and enhanced portability.
- Natural Liquid Soap: This segment is experiencing rapid growth, driven by consumer demand for convenience, moisturizing properties, and the ability to incorporate a wider array of ingredients and fragrances. Liquid soaps often offer a more luxurious user experience. The projected market size for natural liquid soaps is approximately $6,000 million by 2033. Drivers include enhanced user experience, ease of dispensing, and the ability to formulate with beneficial additives like emollients and humectants.
The dominance analysis reveals that while offline sales and natural bar soaps have historically led, the future trajectory indicates a significant shift towards online sales and a growing preference for natural liquid soaps, especially in developed markets. Emerging economies are also showing substantial growth in both online sales and the adoption of natural liquid soap formats.
Natural Soaps Product Developments
Product innovations in the natural soaps sector are increasingly focused on ingredient purity, efficacy, and sustainability. Companies are developing specialized formulations addressing specific skin concerns such as eczema, acne, and aging, utilizing premium botanical extracts and essential oils. Innovations in packaging are also prominent, with a move towards plastic-free, biodegradable, and compostable materials. Competitive advantages are being gained through certifications like organic, vegan, cruelty-free, and fair-trade, appealing to ethically-minded consumers. Technological trends emphasize cold-process saponification for preserving beneficial properties and the use of novel, sustainably sourced ingredients.
Report Scope & Segmentation Analysis
This report delves into the global natural soaps market, providing comprehensive analysis across key segments. The segmentation encompasses application channels and product types.
- Application: The market is segmented into Online Sales and Offline Sales. Online sales are expected to witness a significant CAGR of approximately 9.0% from 2025 to 2033, driven by e-commerce expansion and direct-to-consumer models. Offline sales will continue to be a substantial segment, with a projected CAGR of around 5.5%, supported by established retail networks.
- Types: The product types analyzed include Natural Bar Soap and Natural Liquid Soap. Natural Bar Soap is projected to grow at a CAGR of 6.5%, while Natural Liquid Soap is anticipated to expand at a robust CAGR of 8.5% during the forecast period. Competitive dynamics in both segments are shaped by product innovation, branding, and distribution strategies.
Key Drivers of Natural Soaps Growth
The natural soaps market is propelled by several key drivers. Increasing consumer awareness regarding the health benefits of natural ingredients and the potential risks associated with synthetic chemicals in conventional soaps is a primary catalyst. The growing global emphasis on sustainability and environmental consciousness fuels demand for eco-friendly products, including natural soaps with biodegradable ingredients and minimal packaging. The rise of e-commerce and direct-to-consumer models has expanded market accessibility and consumer choice, further driving growth. Additionally, the trend towards personalized wellness and the demand for natural, cruelty-free, and ethically sourced products are significant growth catalysts.
Challenges in the Natural Soaps Sector
Despite its growth, the natural soaps sector faces several challenges. Intense competition from established conventional soap brands and the emergence of numerous small, artisanal players can fragment the market and impact pricing. Regulatory hurdles and varying standards for "natural" and "organic" claims can create confusion for consumers and compliance challenges for manufacturers. Supply chain disruptions and the availability of raw materials, particularly for niche or exotic ingredients, can affect production costs and lead times. Consumer price sensitivity also remains a factor, as natural soaps can sometimes be priced higher than their conventional counterparts due to ingredient and production costs.
Emerging Opportunities in Natural Soaps
Emerging opportunities within the natural soaps market lie in the development of highly specialized, niche products catering to specific consumer needs, such as hypoallergenic formulations for extremely sensitive skin or soaps incorporating adaptogens for stress relief. The expansion into developing economies, where awareness of natural products is growing, presents significant untapped potential. Innovations in sustainable packaging, including refillable options and zero-waste solutions, will likely gain traction. Furthermore, the integration of smart technologies for personalized product recommendations and the exploration of novel, ethically sourced ingredients with unique functional benefits offer exciting avenues for market expansion.
Leading Players in the Natural Soaps Market
- Sundial Brands LLC
- EO Products
- Vi-Tae
- Pangea Organics
- All-One-God Faith
- Neal's Yard (Natural Remedies) Limited
- Laverana GmbH & Co. KG
- Truly's Natural Products
- Beach Organics
- Nature's Gate
- Erbaviva
- The Honest Company Inc
- Lavanila
- Sensible Organics
- Khadi Natural
- Forest Essentials
- Little Soap Company
- Chagrin Valley Soap & Salve Co
- Botanie Natural Soap Inc
- A Wild Bar Soap LLC
Key Developments in Natural Soaps Industry
- 2023/01: Launch of new vegan and cruelty-free soap lines by a major player, focusing on sustainable sourcing and biodegradable packaging.
- 2022/07: Acquisition of a niche natural soap brand by a larger cosmetics company to expand its organic portfolio.
- 2021/11: Introduction of innovative probiotic-infused natural soaps aimed at improving skin microbiome health.
- 2020/04: Increased focus on direct-to-consumer (DTC) sales channels and online marketing strategies by artisanal soap makers.
- 2019/09: Development of advanced cold-process saponification techniques for preserving the integrity of essential oils and botanicals.
Strategic Outlook for Natural Soaps Market
The strategic outlook for the natural soaps market remains highly positive, driven by persistent consumer demand for healthier and more sustainable personal care options. Future growth will likely be fueled by continued product innovation, particularly in specialized formulations and eco-friendly packaging. Expansion into emerging markets, coupled with strategic partnerships and potential M&A activities, will be crucial for market players to consolidate their positions and capture new opportunities. The focus on transparency in ingredient sourcing and production processes will also be a key differentiator, building consumer trust and brand loyalty in an increasingly conscious marketplace.
Natural Soaps Segmentation
-
1. Application
- 1.1. Online Sales
- 1.2. Offline Sales
-
2. Types
- 2.1. Natural Bar Soap
- 2.2. Natural Liquid Soap
Natural Soaps Segmentation By Geography
-
1. North America
- 1.1. United States
- 1.2. Canada
- 1.3. Mexico
-
2. South America
- 2.1. Brazil
- 2.2. Argentina
- 2.3. Rest of South America
-
3. Europe
- 3.1. United Kingdom
- 3.2. Germany
- 3.3. France
- 3.4. Italy
- 3.5. Spain
- 3.6. Russia
- 3.7. Benelux
- 3.8. Nordics
- 3.9. Rest of Europe
-
4. Middle East & Africa
- 4.1. Turkey
- 4.2. Israel
- 4.3. GCC
- 4.4. North Africa
- 4.5. South Africa
- 4.6. Rest of Middle East & Africa
-
5. Asia Pacific
- 5.1. China
- 5.2. India
- 5.3. Japan
- 5.4. South Korea
- 5.5. ASEAN
- 5.6. Oceania
- 5.7. Rest of Asia Pacific
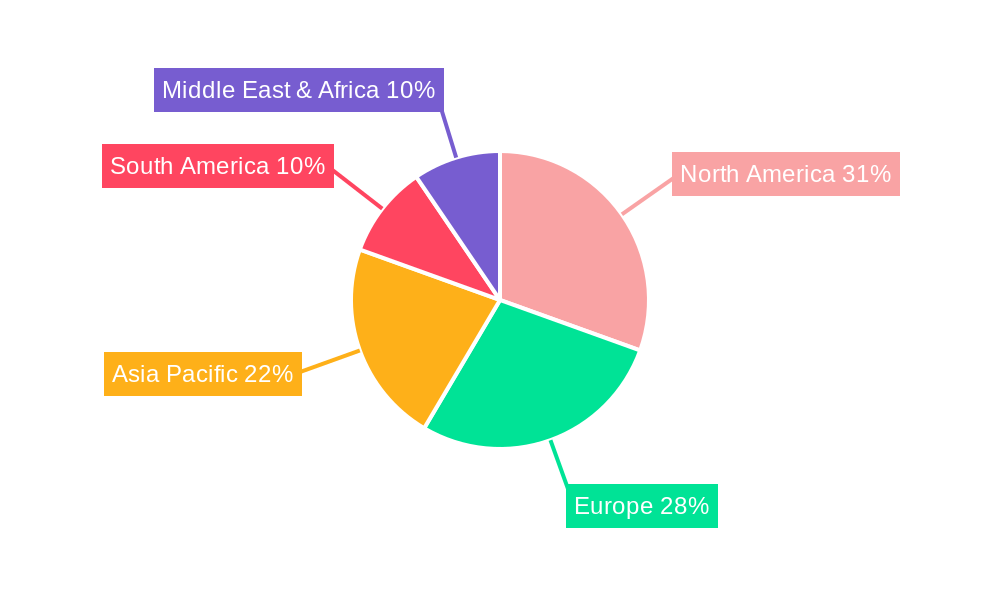
Natural Soaps Regional Market Share
Geographic Coverage of Natural Soaps
Natural Soaps REPORT HIGHLIGHTS
| Aspects | Details |
|---|---|
| Study Period | 2020-2034 |
| Base Year | 2025 |
| Estimated Year | 2026 |
| Forecast Period | 2026-2034 |
| Historical Period | 2020-2025 |
| Growth Rate | CAGR of 8.5% from 2020-2034 |
| Segmentation |
|
Table of Contents
- 1. Introduction
- 1.1. Research Scope
- 1.2. Market Segmentation
- 1.3. Research Objective
- 1.4. Definitions and Assumptions
- 2. Executive Summary
- 2.1. Market Snapshot
- 3. Market Dynamics
- 3.1. Market Drivers
- 3.2. Market Restrains
- 3.3. Market Trends
- 3.4. Market Opportunities
- 4. Market Factor Analysis
- 4.1. Porters Five Forces
- 4.1.1. Bargaining Power of Suppliers
- 4.1.2. Bargaining Power of Buyers
- 4.1.3. Threat of New Entrants
- 4.1.4. Threat of Substitutes
- 4.1.5. Competitive Rivalry
- 4.2. PESTEL analysis
- 4.3. BCG Analysis
- 4.3.1. Stars (High Growth, High Market Share)
- 4.3.2. Cash Cows (Low Growth, High Market Share)
- 4.3.3. Question Mark (High Growth, Low Market Share)
- 4.3.4. Dogs (Low Growth, Low Market Share)
- 4.4. Ansoff Matrix Analysis
- 4.5. Supply Chain Analysis
- 4.6. Regulatory Landscape
- 4.7. Current Market Potential and Opportunity Assessment (TAM–SAM–SOM Framework)
- 4.8. RAX Analyst Note
- 4.1. Porters Five Forces
- 5. Market Analysis, Insights and Forecast 2021-2033
- 5.1. Market Analysis, Insights and Forecast - by Application
- 5.1.1. Online Sales
- 5.1.2. Offline Sales
- 5.2. Market Analysis, Insights and Forecast - by Types
- 5.2.1. Natural Bar Soap
- 5.2.2. Natural Liquid Soap
- 5.3. Market Analysis, Insights and Forecast - by Region
- 5.3.1. North America
- 5.3.2. South America
- 5.3.3. Europe
- 5.3.4. Middle East & Africa
- 5.3.5. Asia Pacific
- 5.1. Market Analysis, Insights and Forecast - by Application
- 6. Global Natural Soaps Analysis, Insights and Forecast, 2021-2033
- 6.1. Market Analysis, Insights and Forecast - by Application
- 6.1.1. Online Sales
- 6.1.2. Offline Sales
- 6.2. Market Analysis, Insights and Forecast - by Types
- 6.2.1. Natural Bar Soap
- 6.2.2. Natural Liquid Soap
- 6.1. Market Analysis, Insights and Forecast - by Application
- 7. North America Natural Soaps Analysis, Insights and Forecast, 2020-2032
- 7.1. Market Analysis, Insights and Forecast - by Application
- 7.1.1. Online Sales
- 7.1.2. Offline Sales
- 7.2. Market Analysis, Insights and Forecast - by Types
- 7.2.1. Natural Bar Soap
- 7.2.2. Natural Liquid Soap
- 7.1. Market Analysis, Insights and Forecast - by Application
- 8. South America Natural Soaps Analysis, Insights and Forecast, 2020-2032
- 8.1. Market Analysis, Insights and Forecast - by Application
- 8.1.1. Online Sales
- 8.1.2. Offline Sales
- 8.2. Market Analysis, Insights and Forecast - by Types
- 8.2.1. Natural Bar Soap
- 8.2.2. Natural Liquid Soap
- 8.1. Market Analysis, Insights and Forecast - by Application
- 9. Europe Natural Soaps Analysis, Insights and Forecast, 2020-2032
- 9.1. Market Analysis, Insights and Forecast - by Application
- 9.1.1. Online Sales
- 9.1.2. Offline Sales
- 9.2. Market Analysis, Insights and Forecast - by Types
- 9.2.1. Natural Bar Soap
- 9.2.2. Natural Liquid Soap
- 9.1. Market Analysis, Insights and Forecast - by Application
- 10. Middle East & Africa Natural Soaps Analysis, Insights and Forecast, 2020-2032
- 10.1. Market Analysis, Insights and Forecast - by Application
- 10.1.1. Online Sales
- 10.1.2. Offline Sales
- 10.2. Market Analysis, Insights and Forecast - by Types
- 10.2.1. Natural Bar Soap
- 10.2.2. Natural Liquid Soap
- 10.1. Market Analysis, Insights and Forecast - by Application
- 11. Asia Pacific Natural Soaps Analysis, Insights and Forecast, 2020-2032
- 11.1. Market Analysis, Insights and Forecast - by Application
- 11.1.1. Online Sales
- 11.1.2. Offline Sales
- 11.2. Market Analysis, Insights and Forecast - by Types
- 11.2.1. Natural Bar Soap
- 11.2.2. Natural Liquid Soap
- 11.1. Market Analysis, Insights and Forecast - by Application
- 12. Competitive Analysis
- 12.1. Company Profiles
- 12.1.1 Sundial Brands LLC
- 12.1.1.1. Company Overview
- 12.1.1.2. Products
- 12.1.1.3. Company Financials
- 12.1.1.4. SWOT Analysis
- 12.1.2 EO Products
- 12.1.2.1. Company Overview
- 12.1.2.2. Products
- 12.1.2.3. Company Financials
- 12.1.2.4. SWOT Analysis
- 12.1.3 Vi-Tae
- 12.1.3.1. Company Overview
- 12.1.3.2. Products
- 12.1.3.3. Company Financials
- 12.1.3.4. SWOT Analysis
- 12.1.4 Pangea Organics
- 12.1.4.1. Company Overview
- 12.1.4.2. Products
- 12.1.4.3. Company Financials
- 12.1.4.4. SWOT Analysis
- 12.1.5 All-One-God Faith
- 12.1.5.1. Company Overview
- 12.1.5.2. Products
- 12.1.5.3. Company Financials
- 12.1.5.4. SWOT Analysis
- 12.1.6 Neal's Yard (Natural Remedies) Limited
- 12.1.6.1. Company Overview
- 12.1.6.2. Products
- 12.1.6.3. Company Financials
- 12.1.6.4. SWOT Analysis
- 12.1.7 Laverana GmbH & Co. KG
- 12.1.7.1. Company Overview
- 12.1.7.2. Products
- 12.1.7.3. Company Financials
- 12.1.7.4. SWOT Analysis
- 12.1.8 Truly's Natural Products
- 12.1.8.1. Company Overview
- 12.1.8.2. Products
- 12.1.8.3. Company Financials
- 12.1.8.4. SWOT Analysis
- 12.1.9 Beach Organics
- 12.1.9.1. Company Overview
- 12.1.9.2. Products
- 12.1.9.3. Company Financials
- 12.1.9.4. SWOT Analysis
- 12.1.10 Nature's Gate
- 12.1.10.1. Company Overview
- 12.1.10.2. Products
- 12.1.10.3. Company Financials
- 12.1.10.4. SWOT Analysis
- 12.1.11 Erbaviva
- 12.1.11.1. Company Overview
- 12.1.11.2. Products
- 12.1.11.3. Company Financials
- 12.1.11.4. SWOT Analysis
- 12.1.12 The Honest Company Inc
- 12.1.12.1. Company Overview
- 12.1.12.2. Products
- 12.1.12.3. Company Financials
- 12.1.12.4. SWOT Analysis
- 12.1.13 Lavanila
- 12.1.13.1. Company Overview
- 12.1.13.2. Products
- 12.1.13.3. Company Financials
- 12.1.13.4. SWOT Analysis
- 12.1.14 Sensible Organics
- 12.1.14.1. Company Overview
- 12.1.14.2. Products
- 12.1.14.3. Company Financials
- 12.1.14.4. SWOT Analysis
- 12.1.15 Khadi Natural
- 12.1.15.1. Company Overview
- 12.1.15.2. Products
- 12.1.15.3. Company Financials
- 12.1.15.4. SWOT Analysis
- 12.1.16 Forest Essentials
- 12.1.16.1. Company Overview
- 12.1.16.2. Products
- 12.1.16.3. Company Financials
- 12.1.16.4. SWOT Analysis
- 12.1.17 Little Soap Company
- 12.1.17.1. Company Overview
- 12.1.17.2. Products
- 12.1.17.3. Company Financials
- 12.1.17.4. SWOT Analysis
- 12.1.18 Chagrin Valley Soap & Salve Co
- 12.1.18.1. Company Overview
- 12.1.18.2. Products
- 12.1.18.3. Company Financials
- 12.1.18.4. SWOT Analysis
- 12.1.19 Botanie Natural Soap Inc
- 12.1.19.1. Company Overview
- 12.1.19.2. Products
- 12.1.19.3. Company Financials
- 12.1.19.4. SWOT Analysis
- 12.1.20 A Wild Bar Soap LLC
- 12.1.20.1. Company Overview
- 12.1.20.2. Products
- 12.1.20.3. Company Financials
- 12.1.20.4. SWOT Analysis
- 12.1.1 Sundial Brands LLC
- 12.2. Market Entropy
- 12.2.1 Company's Key Areas Served
- 12.2.2 Recent Developments
- 12.3. Company Market Share Analysis 2025
- 12.3.1 Top 5 Companies Market Share Analysis
- 12.3.2 Top 3 Companies Market Share Analysis
- 12.4. List of Potential Customers
- 13. Research Methodology
List of Figures
- Figure 1: Global Natural Soaps Revenue Breakdown (billion, %) by Region 2025 & 2033
- Figure 2: Global Natural Soaps Volume Breakdown (K, %) by Region 2025 & 2033
- Figure 3: North America Natural Soaps Revenue (billion), by Application 2025 & 2033
- Figure 4: North America Natural Soaps Volume (K), by Application 2025 & 2033
- Figure 5: North America Natural Soaps Revenue Share (%), by Application 2025 & 2033
- Figure 6: North America Natural Soaps Volume Share (%), by Application 2025 & 2033
- Figure 7: North America Natural Soaps Revenue (billion), by Types 2025 & 2033
- Figure 8: North America Natural Soaps Volume (K), by Types 2025 & 2033
- Figure 9: North America Natural Soaps Revenue Share (%), by Types 2025 & 2033
- Figure 10: North America Natural Soaps Volume Share (%), by Types 2025 & 2033
- Figure 11: North America Natural Soaps Revenue (billion), by Country 2025 & 2033
- Figure 12: North America Natural Soaps Volume (K), by Country 2025 & 2033
- Figure 13: North America Natural Soaps Revenue Share (%), by Country 2025 & 2033
- Figure 14: North America Natural Soaps Volume Share (%), by Country 2025 & 2033
- Figure 15: South America Natural Soaps Revenue (billion), by Application 2025 & 2033
- Figure 16: South America Natural Soaps Volume (K), by Application 2025 & 2033
- Figure 17: South America Natural Soaps Revenue Share (%), by Application 2025 & 2033
- Figure 18: South America Natural Soaps Volume Share (%), by Application 2025 & 2033
- Figure 19: South America Natural Soaps Revenue (billion), by Types 2025 & 2033
- Figure 20: South America Natural Soaps Volume (K), by Types 2025 & 2033
- Figure 21: South America Natural Soaps Revenue Share (%), by Types 2025 & 2033
- Figure 22: South America Natural Soaps Volume Share (%), by Types 2025 & 2033
- Figure 23: South America Natural Soaps Revenue (billion), by Country 2025 & 2033
- Figure 24: South America Natural Soaps Volume (K), by Country 2025 & 2033
- Figure 25: South America Natural Soaps Revenue Share (%), by Country 2025 & 2033
- Figure 26: South America Natural Soaps Volume Share (%), by Country 2025 & 2033
- Figure 27: Europe Natural Soaps Revenue (billion), by Application 2025 & 2033
- Figure 28: Europe Natural Soaps Volume (K), by Application 2025 & 2033
- Figure 29: Europe Natural Soaps Revenue Share (%), by Application 2025 & 2033
- Figure 30: Europe Natural Soaps Volume Share (%), by Application 2025 & 2033
- Figure 31: Europe Natural Soaps Revenue (billion), by Types 2025 & 2033
- Figure 32: Europe Natural Soaps Volume (K), by Types 2025 & 2033
- Figure 33: Europe Natural Soaps Revenue Share (%), by Types 2025 & 2033
- Figure 34: Europe Natural Soaps Volume Share (%), by Types 2025 & 2033
- Figure 35: Europe Natural Soaps Revenue (billion), by Country 2025 & 2033
- Figure 36: Europe Natural Soaps Volume (K), by Country 2025 & 2033
- Figure 37: Europe Natural Soaps Revenue Share (%), by Country 2025 & 2033
- Figure 38: Europe Natural Soaps Volume Share (%), by Country 2025 & 2033
- Figure 39: Middle East & Africa Natural Soaps Revenue (billion), by Application 2025 & 2033
- Figure 40: Middle East & Africa Natural Soaps Volume (K), by Application 2025 & 2033
- Figure 41: Middle East & Africa Natural Soaps Revenue Share (%), by Application 2025 & 2033
- Figure 42: Middle East & Africa Natural Soaps Volume Share (%), by Application 2025 & 2033
- Figure 43: Middle East & Africa Natural Soaps Revenue (billion), by Types 2025 & 2033
- Figure 44: Middle East & Africa Natural Soaps Volume (K), by Types 2025 & 2033
- Figure 45: Middle East & Africa Natural Soaps Revenue Share (%), by Types 2025 & 2033
- Figure 46: Middle East & Africa Natural Soaps Volume Share (%), by Types 2025 & 2033
- Figure 47: Middle East & Africa Natural Soaps Revenue (billion), by Country 2025 & 2033
- Figure 48: Middle East & Africa Natural Soaps Volume (K), by Country 2025 & 2033
- Figure 49: Middle East & Africa Natural Soaps Revenue Share (%), by Country 2025 & 2033
- Figure 50: Middle East & Africa Natural Soaps Volume Share (%), by Country 2025 & 2033
- Figure 51: Asia Pacific Natural Soaps Revenue (billion), by Application 2025 & 2033
- Figure 52: Asia Pacific Natural Soaps Volume (K), by Application 2025 & 2033
- Figure 53: Asia Pacific Natural Soaps Revenue Share (%), by Application 2025 & 2033
- Figure 54: Asia Pacific Natural Soaps Volume Share (%), by Application 2025 & 2033
- Figure 55: Asia Pacific Natural Soaps Revenue (billion), by Types 2025 & 2033
- Figure 56: Asia Pacific Natural Soaps Volume (K), by Types 2025 & 2033
- Figure 57: Asia Pacific Natural Soaps Revenue Share (%), by Types 2025 & 2033
- Figure 58: Asia Pacific Natural Soaps Volume Share (%), by Types 2025 & 2033
- Figure 59: Asia Pacific Natural Soaps Revenue (billion), by Country 2025 & 2033
- Figure 60: Asia Pacific Natural Soaps Volume (K), by Country 2025 & 2033
- Figure 61: Asia Pacific Natural Soaps Revenue Share (%), by Country 2025 & 2033
- Figure 62: Asia Pacific Natural Soaps Volume Share (%), by Country 2025 & 2033
List of Tables
- Table 1: Global Natural Soaps Revenue billion Forecast, by Application 2020 & 2033
- Table 2: Global Natural Soaps Volume K Forecast, by Application 2020 & 2033
- Table 3: Global Natural Soaps Revenue billion Forecast, by Types 2020 & 2033
- Table 4: Global Natural Soaps Volume K Forecast, by Types 2020 & 2033
- Table 5: Global Natural Soaps Revenue billion Forecast, by Region 2020 & 2033
- Table 6: Global Natural Soaps Volume K Forecast, by Region 2020 & 2033
- Table 7: Global Natural Soaps Revenue billion Forecast, by Application 2020 & 2033
- Table 8: Global Natural Soaps Volume K Forecast, by Application 2020 & 2033
- Table 9: Global Natural Soaps Revenue billion Forecast, by Types 2020 & 2033
- Table 10: Global Natural Soaps Volume K Forecast, by Types 2020 & 2033
- Table 11: Global Natural Soaps Revenue billion Forecast, by Country 2020 & 2033
- Table 12: Global Natural Soaps Volume K Forecast, by Country 2020 & 2033
- Table 13: United States Natural Soaps Revenue (billion) Forecast, by Application 2020 & 2033
- Table 14: United States Natural Soaps Volume (K) Forecast, by Application 2020 & 2033
- Table 15: Canada Natural Soaps Revenue (billion) Forecast, by Application 2020 & 2033
- Table 16: Canada Natural Soaps Volume (K) Forecast, by Application 2020 & 2033
- Table 17: Mexico Natural Soaps Revenue (billion) Forecast, by Application 2020 & 2033
- Table 18: Mexico Natural Soaps Volume (K) Forecast, by Application 2020 & 2033
- Table 19: Global Natural Soaps Revenue billion Forecast, by Application 2020 & 2033
- Table 20: Global Natural Soaps Volume K Forecast, by Application 2020 & 2033
- Table 21: Global Natural Soaps Revenue billion Forecast, by Types 2020 & 2033
- Table 22: Global Natural Soaps Volume K Forecast, by Types 2020 & 2033
- Table 23: Global Natural Soaps Revenue billion Forecast, by Country 2020 & 2033
- Table 24: Global Natural Soaps Volume K Forecast, by Country 2020 & 2033
- Table 25: Brazil Natural Soaps Revenue (billion) Forecast, by Application 2020 & 2033
- Table 26: Brazil Natural Soaps Volume (K) Forecast, by Application 2020 & 2033
- Table 27: Argentina Natural Soaps Revenue (billion) Forecast, by Application 2020 & 2033
- Table 28: Argentina Natural Soaps Volume (K) Forecast, by Application 2020 & 2033
- Table 29: Rest of South America Natural Soaps Revenue (billion) Forecast, by Application 2020 & 2033
- Table 30: Rest of South America Natural Soaps Volume (K) Forecast, by Application 2020 & 2033
- Table 31: Global Natural Soaps Revenue billion Forecast, by Application 2020 & 2033
- Table 32: Global Natural Soaps Volume K Forecast, by Application 2020 & 2033
- Table 33: Global Natural Soaps Revenue billion Forecast, by Types 2020 & 2033
- Table 34: Global Natural Soaps Volume K Forecast, by Types 2020 & 2033
- Table 35: Global Natural Soaps Revenue billion Forecast, by Country 2020 & 2033
- Table 36: Global Natural Soaps Volume K Forecast, by Country 2020 & 2033
- Table 37: United Kingdom Natural Soaps Revenue (billion) Forecast, by Application 2020 & 2033
- Table 38: United Kingdom Natural Soaps Volume (K) Forecast, by Application 2020 & 2033
- Table 39: Germany Natural Soaps Revenue (billion) Forecast, by Application 2020 & 2033
- Table 40: Germany Natural Soaps Volume (K) Forecast, by Application 2020 & 2033
- Table 41: France Natural Soaps Revenue (billion) Forecast, by Application 2020 & 2033
- Table 42: France Natural Soaps Volume (K) Forecast, by Application 2020 & 2033
- Table 43: Italy Natural Soaps Revenue (billion) Forecast, by Application 2020 & 2033
- Table 44: Italy Natural Soaps Volume (K) Forecast, by Application 2020 & 2033
- Table 45: Spain Natural Soaps Revenue (billion) Forecast, by Application 2020 & 2033
- Table 46: Spain Natural Soaps Volume (K) Forecast, by Application 2020 & 2033
- Table 47: Russia Natural Soaps Revenue (billion) Forecast, by Application 2020 & 2033
- Table 48: Russia Natural Soaps Volume (K) Forecast, by Application 2020 & 2033
- Table 49: Benelux Natural Soaps Revenue (billion) Forecast, by Application 2020 & 2033
- Table 50: Benelux Natural Soaps Volume (K) Forecast, by Application 2020 & 2033
- Table 51: Nordics Natural Soaps Revenue (billion) Forecast, by Application 2020 & 2033
- Table 52: Nordics Natural Soaps Volume (K) Forecast, by Application 2020 & 2033
- Table 53: Rest of Europe Natural Soaps Revenue (billion) Forecast, by Application 2020 & 2033
- Table 54: Rest of Europe Natural Soaps Volume (K) Forecast, by Application 2020 & 2033
- Table 55: Global Natural Soaps Revenue billion Forecast, by Application 2020 & 2033
- Table 56: Global Natural Soaps Volume K Forecast, by Application 2020 & 2033
- Table 57: Global Natural Soaps Revenue billion Forecast, by Types 2020 & 2033
- Table 58: Global Natural Soaps Volume K Forecast, by Types 2020 & 2033
- Table 59: Global Natural Soaps Revenue billion Forecast, by Country 2020 & 2033
- Table 60: Global Natural Soaps Volume K Forecast, by Country 2020 & 2033
- Table 61: Turkey Natural Soaps Revenue (billion) Forecast, by Application 2020 & 2033
- Table 62: Turkey Natural Soaps Volume (K) Forecast, by Application 2020 & 2033
- Table 63: Israel Natural Soaps Revenue (billion) Forecast, by Application 2020 & 2033
- Table 64: Israel Natural Soaps Volume (K) Forecast, by Application 2020 & 2033
- Table 65: GCC Natural Soaps Revenue (billion) Forecast, by Application 2020 & 2033
- Table 66: GCC Natural Soaps Volume (K) Forecast, by Application 2020 & 2033
- Table 67: North Africa Natural Soaps Revenue (billion) Forecast, by Application 2020 & 2033
- Table 68: North Africa Natural Soaps Volume (K) Forecast, by Application 2020 & 2033
- Table 69: South Africa Natural Soaps Revenue (billion) Forecast, by Application 2020 & 2033
- Table 70: South Africa Natural Soaps Volume (K) Forecast, by Application 2020 & 2033
- Table 71: Rest of Middle East & Africa Natural Soaps Revenue (billion) Forecast, by Application 2020 & 2033
- Table 72: Rest of Middle East & Africa Natural Soaps Volume (K) Forecast, by Application 2020 & 2033
- Table 73: Global Natural Soaps Revenue billion Forecast, by Application 2020 & 2033
- Table 74: Global Natural Soaps Volume K Forecast, by Application 2020 & 2033
- Table 75: Global Natural Soaps Revenue billion Forecast, by Types 2020 & 2033
- Table 76: Global Natural Soaps Volume K Forecast, by Types 2020 & 2033
- Table 77: Global Natural Soaps Revenue billion Forecast, by Country 2020 & 2033
- Table 78: Global Natural Soaps Volume K Forecast, by Country 2020 & 2033
- Table 79: China Natural Soaps Revenue (billion) Forecast, by Application 2020 & 2033
- Table 80: China Natural Soaps Volume (K) Forecast, by Application 2020 & 2033
- Table 81: India Natural Soaps Revenue (billion) Forecast, by Application 2020 & 2033
- Table 82: India Natural Soaps Volume (K) Forecast, by Application 2020 & 2033
- Table 83: Japan Natural Soaps Revenue (billion) Forecast, by Application 2020 & 2033
- Table 84: Japan Natural Soaps Volume (K) Forecast, by Application 2020 & 2033
- Table 85: South Korea Natural Soaps Revenue (billion) Forecast, by Application 2020 & 2033
- Table 86: South Korea Natural Soaps Volume (K) Forecast, by Application 2020 & 2033
- Table 87: ASEAN Natural Soaps Revenue (billion) Forecast, by Application 2020 & 2033
- Table 88: ASEAN Natural Soaps Volume (K) Forecast, by Application 2020 & 2033
- Table 89: Oceania Natural Soaps Revenue (billion) Forecast, by Application 2020 & 2033
- Table 90: Oceania Natural Soaps Volume (K) Forecast, by Application 2020 & 2033
- Table 91: Rest of Asia Pacific Natural Soaps Revenue (billion) Forecast, by Application 2020 & 2033
- Table 92: Rest of Asia Pacific Natural Soaps Volume (K) Forecast, by Application 2020 & 2033
Frequently Asked Questions
1. What is the projected Compound Annual Growth Rate (CAGR) of the Natural Soaps?
The projected CAGR is approximately 8.5%.
2. Which companies are prominent players in the Natural Soaps?
Key companies in the market include Sundial Brands LLC, EO Products, Vi-Tae, Pangea Organics, All-One-God Faith, Neal's Yard (Natural Remedies) Limited, Laverana GmbH & Co. KG, Truly's Natural Products, Beach Organics, Nature's Gate, Erbaviva, The Honest Company Inc, Lavanila, Sensible Organics, Khadi Natural, Forest Essentials, Little Soap Company, Chagrin Valley Soap & Salve Co, Botanie Natural Soap Inc, A Wild Bar Soap LLC.
3. What are the main segments of the Natural Soaps?
The market segments include Application, Types.
4. Can you provide details about the market size?
The market size is estimated to be USD 5.5 billion as of 2022.
5. What are some drivers contributing to market growth?
N/A
6. What are the notable trends driving market growth?
N/A
7. Are there any restraints impacting market growth?
N/A
8. Can you provide examples of recent developments in the market?
N/A
9. What pricing options are available for accessing the report?
Pricing options include single-user, multi-user, and enterprise licenses priced at USD 3350.00, USD 5025.00, and USD 6700.00 respectively.
10. Is the market size provided in terms of value or volume?
The market size is provided in terms of value, measured in billion and volume, measured in K.
11. Are there any specific market keywords associated with the report?
Yes, the market keyword associated with the report is "Natural Soaps," which aids in identifying and referencing the specific market segment covered.
12. How do I determine which pricing option suits my needs best?
The pricing options vary based on user requirements and access needs. Individual users may opt for single-user licenses, while businesses requiring broader access may choose multi-user or enterprise licenses for cost-effective access to the report.
13. Are there any additional resources or data provided in the Natural Soaps report?
While the report offers comprehensive insights, it's advisable to review the specific contents or supplementary materials provided to ascertain if additional resources or data are available.
14. How can I stay updated on further developments or reports in the Natural Soaps?
To stay informed about further developments, trends, and reports in the Natural Soaps, consider subscribing to industry newsletters, following relevant companies and organizations, or regularly checking reputable industry news sources and publications.
Methodology
Step 1 - Identification of Relevant Samples Size from Population Database


Step 2 - Approaches for Defining Global Market Size (Value, Volume* & Price*)

Note*: In applicable scenarios
Step 3 - Data Sources
Primary Research
- Web Analytics
- Survey Reports
- Research Institute
- Latest Research Reports
- Opinion Leaders
Secondary Research
- Annual Reports
- White Paper
- Latest Press Release
- Industry Association
- Paid Database
- Investor Presentations

Step 4 - Data Triangulation
Involves using different sources of information in order to increase the validity of a study
These sources are likely to be stakeholders in a program - participants, other researchers, program staff, other community members, and so on.
Then we put all data in single framework & apply various statistical tools to find out the dynamic on the market.
During the analysis stage, feedback from the stakeholder groups would be compared to determine areas of agreement as well as areas of divergence