

Key Insights
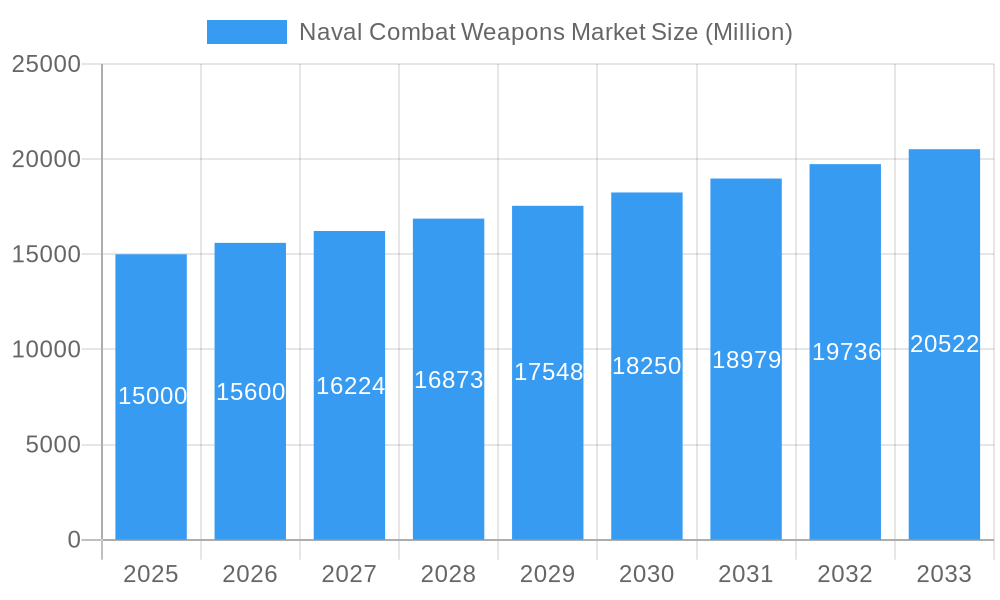
The Global Naval Combat Weapons Market, valued at $10.38 billion in the base year 2025, is projected to expand significantly, driven by a Compound Annual Growth Rate (CAGR) of 7.52% through 2033. Escalating geopolitical tensions and continuous naval fleet modernization worldwide are primary growth catalysts. Technological advancements, including precision-guided munitions, hypersonic systems, and sophisticated sensor integration, are enhancing naval combat capabilities and stimulating demand. The rise of asymmetric warfare and the necessity for advanced countermeasures against emerging threats further bolster market expansion. Segmentation highlights robust demand for both underwater and surface-based naval combat weapons across diverse platforms, from submarines to aircraft carriers.
Naval Combat Weapons Market Market Size (In Billion)
North America and Europe currently lead the market, supported by substantial defense expenditures and established defense manufacturing sectors. However, the Asia-Pacific region is poised for considerable growth, attributed to increasing defense investments and naval modernization programs in key nations. Despite this positive trajectory, potential restraints include budgetary constraints amid economic uncertainties, high research and development costs for advanced systems, and the complex integration of new technologies into existing naval infrastructure. Nevertheless, the persistent need for superior naval power and ongoing defense innovation ensures a favorable outlook for the Naval Combat Weapons Market.
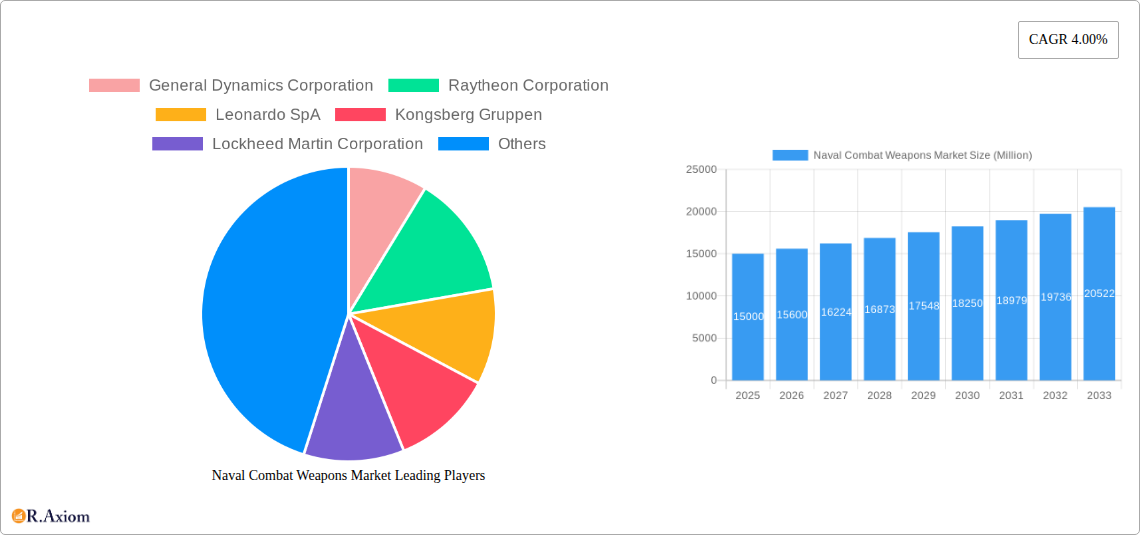
Naval Combat Weapons Market Company Market Share
This report offers an exhaustive analysis of the Global Naval Combat Weapons Market, providing critical insights for stakeholders, investors, and decision-makers. The study encompasses the period 2019-2033, with a detailed focus on the forecast period 2025-2033 and a base year of 2025. Market segmentation by platform type (Underwater-Based, Surface-Based) and application (Small Patrol Boats, Large Aircraft Carriers, Submarines) reveals granular market dynamics and opportunities. The market size was $10.38 billion in 2025 and is projected to reach substantial figures by 2033, with an estimated CAGR of 7.52%.
Naval Combat Weapons Market Market Concentration & Innovation
The Naval Combat Weapons market exhibits a moderately concentrated landscape, with a few key players holding significant market share. General Dynamics Corporation, Raytheon Corporation, and Lockheed Martin Corporation are among the leading players, collectively accounting for an estimated xx% of the market in 2025. Market share is primarily determined by technological advancements, production capabilities, and established customer relationships. Innovation is a key driver, with ongoing investments in advanced technologies such as autonomous systems, precision-guided munitions, and enhanced sensor capabilities.
- Market Concentration: The Herfindahl-Hirschman Index (HHI) is estimated to be xx in 2025, indicating a moderately concentrated market.
- Innovation Drivers: Investments in R&D, government funding for defense programs, and the need for improved weapon systems performance are key drivers of innovation.
- Regulatory Frameworks: Stringent export controls and international arms trade treaties significantly impact market dynamics.
- Product Substitutes: The limited availability of direct substitutes makes the market relatively insulated from competition.
- End-User Trends: Growing demand for enhanced maritime security and defense capabilities is a major growth driver.
- M&A Activities: The past five years have witnessed several mergers and acquisitions, with total deal values exceeding xx Million. These deals aim to enhance technological capabilities, expand market reach, and consolidate market share.
Naval Combat Weapons Market Industry Trends & Insights
The global Naval Combat Weapons Market is experiencing robust growth fueled by escalating geopolitical tensions, increasing defense budgets globally, and the modernization of naval fleets. Technological disruptions, particularly in areas like hypersonic weapons and directed energy weapons, are reshaping the competitive landscape. Consumer preferences (i.e., navies) are shifting towards more precise, long-range, and networked weapon systems. The market is characterized by intense competition among established players, with a focus on product differentiation and technological superiority. The market penetration of advanced technologies such as AI-powered targeting systems is increasing, with adoption rates projected to reach xx% by 2033. The overall market exhibits a robust growth trajectory, driven by rising defense expenditure and technological innovations.
Dominant Markets & Segments in Naval Combat Weapons Market
The North American region dominates the global Naval Combat Weapons Market, driven by high defense spending and a large naval fleet. Within this region, the United States holds the largest market share, driven by its significant investment in naval modernization and technological advancements.
Platform Type: Surface-based combat weapons currently hold the largest market share, due to their wider application across various naval vessels. However, underwater-based weapons are expected to witness significant growth in the forecast period, fueled by advancements in autonomous underwater vehicles (AUVs) and improved underwater warfare capabilities.
Application: Large aircraft carriers represent a significant segment of the market, due to their substantial weapon load and need for sophisticated combat systems. However, smaller patrol boats are also witnessing growth driven by the rising demand for coastal defense and anti-piracy operations. The Submarine segment displays steady growth due to the continuing relevance of submarine warfare capabilities.
Key Drivers:
- North America: High defense budgets, technological advancements, and a strong domestic industry.
- Europe: Increasing defense spending by several European nations, modernization of existing naval fleets.
- Asia-Pacific: Rising geopolitical tensions, rapid naval expansion by several countries, and increased focus on maritime security.
Naval Combat Weapons Market Product Developments
Recent product innovations focus on enhancing precision, range, and lethality of naval combat weapons. This includes advancements in guided munitions, hypersonic technologies, and integration with advanced sensor systems. Companies are emphasizing the development of networked weapon systems that enable greater coordination and effectiveness across multiple platforms. These developments enhance the competitive advantage of leading players through technological superiority and improved operational capabilities.
Report Scope & Segmentation Analysis
This report segments the Naval Combat Weapons Market based on platform type and application:
Platform Type:
Underwater-Based Naval Combat Weapons: This segment is projected to grow at a CAGR of xx% during the forecast period, driven by advancements in autonomous underwater vehicles and improved underwater warfare capabilities. Competitive dynamics are intense due to the technological complexity of this segment.
Surface-Based Combat Weapons: This segment constitutes the largest share of the market currently, benefiting from widespread adoption across various naval vessels. Growth is expected to be steady during the forecast period, driven by continuous modernization and upgrades of existing weapon systems.
Application:
Small Patrol Boats: This segment is experiencing growth due to the increasing need for coastal defense and anti-piracy operations. Competitive dynamics are driven by cost-effectiveness and ease of integration with smaller vessels.
Large Aircraft Carriers: This segment represents a significant portion of the market, with demand driven by the need for powerful and versatile weapon systems. Competition in this segment focuses on technological superiority and the ability to handle large inventories of weapons.
Submarines: This segment displays steady growth due to the sustained relevance of submarine warfare and ongoing technological development. Competition is fierce, driven by the need for quiet, advanced weapon systems.
Key Drivers of Naval Combat Weapons Market Growth
The growth of the Naval Combat Weapons market is driven by several key factors:
- Rising Global Defense Spending: Increased geopolitical instability and regional conflicts are leading to higher defense budgets globally.
- Technological Advancements: Continuous innovations in weapon technologies such as hypersonic weapons and directed energy weapons are driving demand.
- Naval Modernization Programs: Many countries are engaged in extensive naval modernization programs, creating a strong demand for advanced combat weapons.
Challenges in the Naval Combat Weapons Market Sector
The Naval Combat Weapons market faces several challenges:
- Stringent Export Controls: International arms trade treaties and export regulations pose significant hurdles for market expansion.
- High Development Costs: The development and production of advanced weapon systems involve substantial investments, leading to higher acquisition costs.
- Intense Competition: The market is characterized by intense competition among major players, requiring continuous innovation and product differentiation.
Emerging Opportunities in Naval Combat Weapons Market
Emerging opportunities exist in:
- Autonomous Weapons Systems: The development and integration of autonomous and unmanned weapons systems present significant growth potential.
- Cybersecurity for Naval Weapon Systems: Growing focus on cyber resilience and protection of naval weapon systems from cyberattacks offers opportunities.
- Emerging Markets: Expanding markets in the Asia-Pacific region and other developing economies offer growth avenues.
Leading Players in the Naval Combat Weapons Market Market
Key Developments in Naval Combat Weapons Market Industry
- January 2023: Raytheon announced a new contract for the supply of advanced missile systems.
- March 2023: Lockheed Martin unveiled a prototype for a next-generation hypersonic weapon.
- June 2022: General Dynamics completed the acquisition of a smaller naval defense company, expanding its market reach.
- October 2021: BAE Systems secured a major contract for the upgrade of naval combat systems.
Strategic Outlook for Naval Combat Weapons Market Market
The Naval Combat Weapons Market is poised for continued growth, driven by technological advancements and increasing defense budgets. The focus on autonomous systems, hypersonic weapons, and enhanced network capabilities will further shape the market. Emerging markets and the modernization of naval fleets worldwide will provide ample opportunities for market expansion and continued growth throughout the forecast period.
Naval Combat Weapons Market Segmentation
- 1. Production Analysis
- 2. Consumption Analysis
- 3. Import Market Analysis (Value & Volume)
- 4. Export Market Analysis (Value & Volume)
- 5. Price Trend Analysis
Naval Combat Weapons Market Segmentation By Geography
-
1. North America
- 1.1. United States
- 1.2. Canada
- 1.3. Mexico
-
2. South America
- 2.1. Brazil
- 2.2. Argentina
- 2.3. Rest of South America
-
3. Europe
- 3.1. United Kingdom
- 3.2. Germany
- 3.3. France
- 3.4. Italy
- 3.5. Spain
- 3.6. Russia
- 3.7. Benelux
- 3.8. Nordics
- 3.9. Rest of Europe
-
4. Middle East & Africa
- 4.1. Turkey
- 4.2. Israel
- 4.3. GCC
- 4.4. North Africa
- 4.5. South Africa
- 4.6. Rest of Middle East & Africa
-
5. Asia Pacific
- 5.1. China
- 5.2. India
- 5.3. Japan
- 5.4. South Korea
- 5.5. ASEAN
- 5.6. Oceania
- 5.7. Rest of Asia Pacific
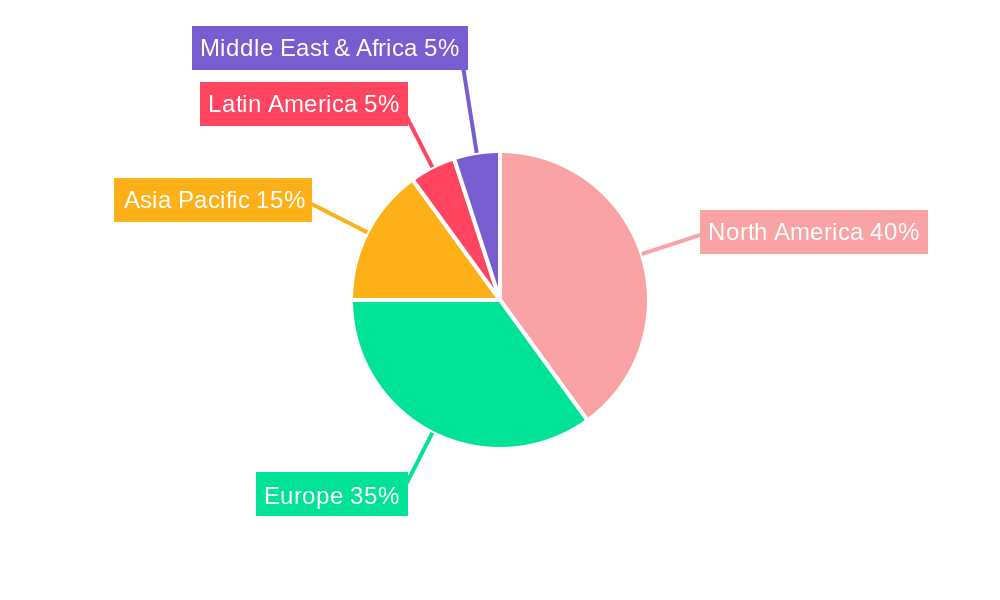
Naval Combat Weapons Market Regional Market Share
Geographic Coverage of Naval Combat Weapons Market
Naval Combat Weapons Market REPORT HIGHLIGHTS
| Aspects | Details |
|---|---|
| Study Period | 2020-2034 |
| Base Year | 2025 |
| Estimated Year | 2026 |
| Forecast Period | 2026-2034 |
| Historical Period | 2020-2025 |
| Growth Rate | CAGR of 7.52% from 2020-2034 |
| Segmentation |
|
Table of Contents
- 1. Introduction
- 1.1. Research Scope
- 1.2. Market Segmentation
- 1.3. Research Objective
- 1.4. Definitions and Assumptions
- 2. Executive Summary
- 2.1. Market Snapshot
- 3. Market Dynamics
- 3.1. Market Drivers
- 3.2. Market Restrains
- 3.3. Market Trends
- 3.4. Market Opportunities
- 4. Market Factor Analysis
- 4.1. Porters Five Forces
- 4.1.1. Bargaining Power of Suppliers
- 4.1.2. Bargaining Power of Buyers
- 4.1.3. Threat of New Entrants
- 4.1.4. Threat of Substitutes
- 4.1.5. Competitive Rivalry
- 4.2. PESTEL analysis
- 4.3. BCG Analysis
- 4.3.1. Stars (High Growth, High Market Share)
- 4.3.2. Cash Cows (Low Growth, High Market Share)
- 4.3.3. Question Mark (High Growth, Low Market Share)
- 4.3.4. Dogs (Low Growth, Low Market Share)
- 4.4. Ansoff Matrix Analysis
- 4.5. Supply Chain Analysis
- 4.6. Regulatory Landscape
- 4.7. Current Market Potential and Opportunity Assessment (TAM–SAM–SOM Framework)
- 4.8. RAX Analyst Note
- 4.1. Porters Five Forces
- 5. Market Analysis, Insights and Forecast 2021-2033
- 5.1. Market Analysis, Insights and Forecast - by Production Analysis
- 5.2. Market Analysis, Insights and Forecast - by Consumption Analysis
- 5.3. Market Analysis, Insights and Forecast - by Import Market Analysis (Value & Volume)
- 5.4. Market Analysis, Insights and Forecast - by Export Market Analysis (Value & Volume)
- 5.5. Market Analysis, Insights and Forecast - by Price Trend Analysis
- 5.6. Market Analysis, Insights and Forecast - by Region
- 5.6.1. North America
- 5.6.2. South America
- 5.6.3. Europe
- 5.6.4. Middle East & Africa
- 5.6.5. Asia Pacific
- 6. Global Naval Combat Weapons Market Analysis, Insights and Forecast, 2021-2033
- 6.1. Market Analysis, Insights and Forecast - by Production Analysis
- 6.2. Market Analysis, Insights and Forecast - by Consumption Analysis
- 6.3. Market Analysis, Insights and Forecast - by Import Market Analysis (Value & Volume)
- 6.4. Market Analysis, Insights and Forecast - by Export Market Analysis (Value & Volume)
- 6.5. Market Analysis, Insights and Forecast - by Price Trend Analysis
- 7. North America Naval Combat Weapons Market Analysis, Insights and Forecast, 2020-2032
- 7.1. Market Analysis, Insights and Forecast - by Production Analysis
- 7.2. Market Analysis, Insights and Forecast - by Consumption Analysis
- 7.3. Market Analysis, Insights and Forecast - by Import Market Analysis (Value & Volume)
- 7.4. Market Analysis, Insights and Forecast - by Export Market Analysis (Value & Volume)
- 7.5. Market Analysis, Insights and Forecast - by Price Trend Analysis
- 8. South America Naval Combat Weapons Market Analysis, Insights and Forecast, 2020-2032
- 8.1. Market Analysis, Insights and Forecast - by Production Analysis
- 8.2. Market Analysis, Insights and Forecast - by Consumption Analysis
- 8.3. Market Analysis, Insights and Forecast - by Import Market Analysis (Value & Volume)
- 8.4. Market Analysis, Insights and Forecast - by Export Market Analysis (Value & Volume)
- 8.5. Market Analysis, Insights and Forecast - by Price Trend Analysis
- 9. Europe Naval Combat Weapons Market Analysis, Insights and Forecast, 2020-2032
- 9.1. Market Analysis, Insights and Forecast - by Production Analysis
- 9.2. Market Analysis, Insights and Forecast - by Consumption Analysis
- 9.3. Market Analysis, Insights and Forecast - by Import Market Analysis (Value & Volume)
- 9.4. Market Analysis, Insights and Forecast - by Export Market Analysis (Value & Volume)
- 9.5. Market Analysis, Insights and Forecast - by Price Trend Analysis
- 10. Middle East & Africa Naval Combat Weapons Market Analysis, Insights and Forecast, 2020-2032
- 10.1. Market Analysis, Insights and Forecast - by Production Analysis
- 10.2. Market Analysis, Insights and Forecast - by Consumption Analysis
- 10.3. Market Analysis, Insights and Forecast - by Import Market Analysis (Value & Volume)
- 10.4. Market Analysis, Insights and Forecast - by Export Market Analysis (Value & Volume)
- 10.5. Market Analysis, Insights and Forecast - by Price Trend Analysis
- 11. Asia Pacific Naval Combat Weapons Market Analysis, Insights and Forecast, 2020-2032
- 11.1. Market Analysis, Insights and Forecast - by Production Analysis
- 11.2. Market Analysis, Insights and Forecast - by Consumption Analysis
- 11.3. Market Analysis, Insights and Forecast - by Import Market Analysis (Value & Volume)
- 11.4. Market Analysis, Insights and Forecast - by Export Market Analysis (Value & Volume)
- 11.5. Market Analysis, Insights and Forecast - by Price Trend Analysis
- 12. Competitive Analysis
- 12.1. Company Profiles
- 12.1.1 General Dynamics Corporation
- 12.1.1.1. Company Overview
- 12.1.1.2. Products
- 12.1.1.3. Company Financials
- 12.1.1.4. SWOT Analysis
- 12.1.2 Raytheon Corporation
- 12.1.2.1. Company Overview
- 12.1.2.2. Products
- 12.1.2.3. Company Financials
- 12.1.2.4. SWOT Analysis
- 12.1.3 Leonardo SpA
- 12.1.3.1. Company Overview
- 12.1.3.2. Products
- 12.1.3.3. Company Financials
- 12.1.3.4. SWOT Analysis
- 12.1.4 Kongsberg Gruppen
- 12.1.4.1. Company Overview
- 12.1.4.2. Products
- 12.1.4.3. Company Financials
- 12.1.4.4. SWOT Analysis
- 12.1.5 Lockheed Martin Corporation
- 12.1.5.1. Company Overview
- 12.1.5.2. Products
- 12.1.5.3. Company Financials
- 12.1.5.4. SWOT Analysis
- 12.1.6 Terma
- 12.1.6.1. Company Overview
- 12.1.6.2. Products
- 12.1.6.3. Company Financials
- 12.1.6.4. SWOT Analysis
- 12.1.7 QinetiQ Grou
- 12.1.7.1. Company Overview
- 12.1.7.2. Products
- 12.1.7.3. Company Financials
- 12.1.7.4. SWOT Analysis
- 12.1.8 Elbit Systems
- 12.1.8.1. Company Overview
- 12.1.8.2. Products
- 12.1.8.3. Company Financials
- 12.1.8.4. SWOT Analysis
- 12.1.9 Thales Corporation
- 12.1.9.1. Company Overview
- 12.1.9.2. Products
- 12.1.9.3. Company Financials
- 12.1.9.4. SWOT Analysis
- 12.1.10 L3 Harris Corporation
- 12.1.10.1. Company Overview
- 12.1.10.2. Products
- 12.1.10.3. Company Financials
- 12.1.10.4. SWOT Analysis
- 12.1.11 BAE Systems Plc
- 12.1.11.1. Company Overview
- 12.1.11.2. Products
- 12.1.11.3. Company Financials
- 12.1.11.4. SWOT Analysis
- 12.1.12 SAAB AB
- 12.1.12.1. Company Overview
- 12.1.12.2. Products
- 12.1.12.3. Company Financials
- 12.1.12.4. SWOT Analysis
- 12.1.1 General Dynamics Corporation
- 12.2. Market Entropy
- 12.2.1 Company's Key Areas Served
- 12.2.2 Recent Developments
- 12.3. Company Market Share Analysis 2025
- 12.3.1 Top 5 Companies Market Share Analysis
- 12.3.2 Top 3 Companies Market Share Analysis
- 12.4. List of Potential Customers
- 13. Research Methodology
List of Figures
- Figure 1: Global Naval Combat Weapons Market Revenue Breakdown (billion, %) by Region 2025 & 2033
- Figure 2: North America Naval Combat Weapons Market Revenue (billion), by Production Analysis 2025 & 2033
- Figure 3: North America Naval Combat Weapons Market Revenue Share (%), by Production Analysis 2025 & 2033
- Figure 4: North America Naval Combat Weapons Market Revenue (billion), by Consumption Analysis 2025 & 2033
- Figure 5: North America Naval Combat Weapons Market Revenue Share (%), by Consumption Analysis 2025 & 2033
- Figure 6: North America Naval Combat Weapons Market Revenue (billion), by Import Market Analysis (Value & Volume) 2025 & 2033
- Figure 7: North America Naval Combat Weapons Market Revenue Share (%), by Import Market Analysis (Value & Volume) 2025 & 2033
- Figure 8: North America Naval Combat Weapons Market Revenue (billion), by Export Market Analysis (Value & Volume) 2025 & 2033
- Figure 9: North America Naval Combat Weapons Market Revenue Share (%), by Export Market Analysis (Value & Volume) 2025 & 2033
- Figure 10: North America Naval Combat Weapons Market Revenue (billion), by Price Trend Analysis 2025 & 2033
- Figure 11: North America Naval Combat Weapons Market Revenue Share (%), by Price Trend Analysis 2025 & 2033
- Figure 12: North America Naval Combat Weapons Market Revenue (billion), by Country 2025 & 2033
- Figure 13: North America Naval Combat Weapons Market Revenue Share (%), by Country 2025 & 2033
- Figure 14: South America Naval Combat Weapons Market Revenue (billion), by Production Analysis 2025 & 2033
- Figure 15: South America Naval Combat Weapons Market Revenue Share (%), by Production Analysis 2025 & 2033
- Figure 16: South America Naval Combat Weapons Market Revenue (billion), by Consumption Analysis 2025 & 2033
- Figure 17: South America Naval Combat Weapons Market Revenue Share (%), by Consumption Analysis 2025 & 2033
- Figure 18: South America Naval Combat Weapons Market Revenue (billion), by Import Market Analysis (Value & Volume) 2025 & 2033
- Figure 19: South America Naval Combat Weapons Market Revenue Share (%), by Import Market Analysis (Value & Volume) 2025 & 2033
- Figure 20: South America Naval Combat Weapons Market Revenue (billion), by Export Market Analysis (Value & Volume) 2025 & 2033
- Figure 21: South America Naval Combat Weapons Market Revenue Share (%), by Export Market Analysis (Value & Volume) 2025 & 2033
- Figure 22: South America Naval Combat Weapons Market Revenue (billion), by Price Trend Analysis 2025 & 2033
- Figure 23: South America Naval Combat Weapons Market Revenue Share (%), by Price Trend Analysis 2025 & 2033
- Figure 24: South America Naval Combat Weapons Market Revenue (billion), by Country 2025 & 2033
- Figure 25: South America Naval Combat Weapons Market Revenue Share (%), by Country 2025 & 2033
- Figure 26: Europe Naval Combat Weapons Market Revenue (billion), by Production Analysis 2025 & 2033
- Figure 27: Europe Naval Combat Weapons Market Revenue Share (%), by Production Analysis 2025 & 2033
- Figure 28: Europe Naval Combat Weapons Market Revenue (billion), by Consumption Analysis 2025 & 2033
- Figure 29: Europe Naval Combat Weapons Market Revenue Share (%), by Consumption Analysis 2025 & 2033
- Figure 30: Europe Naval Combat Weapons Market Revenue (billion), by Import Market Analysis (Value & Volume) 2025 & 2033
- Figure 31: Europe Naval Combat Weapons Market Revenue Share (%), by Import Market Analysis (Value & Volume) 2025 & 2033
- Figure 32: Europe Naval Combat Weapons Market Revenue (billion), by Export Market Analysis (Value & Volume) 2025 & 2033
- Figure 33: Europe Naval Combat Weapons Market Revenue Share (%), by Export Market Analysis (Value & Volume) 2025 & 2033
- Figure 34: Europe Naval Combat Weapons Market Revenue (billion), by Price Trend Analysis 2025 & 2033
- Figure 35: Europe Naval Combat Weapons Market Revenue Share (%), by Price Trend Analysis 2025 & 2033
- Figure 36: Europe Naval Combat Weapons Market Revenue (billion), by Country 2025 & 2033
- Figure 37: Europe Naval Combat Weapons Market Revenue Share (%), by Country 2025 & 2033
- Figure 38: Middle East & Africa Naval Combat Weapons Market Revenue (billion), by Production Analysis 2025 & 2033
- Figure 39: Middle East & Africa Naval Combat Weapons Market Revenue Share (%), by Production Analysis 2025 & 2033
- Figure 40: Middle East & Africa Naval Combat Weapons Market Revenue (billion), by Consumption Analysis 2025 & 2033
- Figure 41: Middle East & Africa Naval Combat Weapons Market Revenue Share (%), by Consumption Analysis 2025 & 2033
- Figure 42: Middle East & Africa Naval Combat Weapons Market Revenue (billion), by Import Market Analysis (Value & Volume) 2025 & 2033
- Figure 43: Middle East & Africa Naval Combat Weapons Market Revenue Share (%), by Import Market Analysis (Value & Volume) 2025 & 2033
- Figure 44: Middle East & Africa Naval Combat Weapons Market Revenue (billion), by Export Market Analysis (Value & Volume) 2025 & 2033
- Figure 45: Middle East & Africa Naval Combat Weapons Market Revenue Share (%), by Export Market Analysis (Value & Volume) 2025 & 2033
- Figure 46: Middle East & Africa Naval Combat Weapons Market Revenue (billion), by Price Trend Analysis 2025 & 2033
- Figure 47: Middle East & Africa Naval Combat Weapons Market Revenue Share (%), by Price Trend Analysis 2025 & 2033
- Figure 48: Middle East & Africa Naval Combat Weapons Market Revenue (billion), by Country 2025 & 2033
- Figure 49: Middle East & Africa Naval Combat Weapons Market Revenue Share (%), by Country 2025 & 2033
- Figure 50: Asia Pacific Naval Combat Weapons Market Revenue (billion), by Production Analysis 2025 & 2033
- Figure 51: Asia Pacific Naval Combat Weapons Market Revenue Share (%), by Production Analysis 2025 & 2033
- Figure 52: Asia Pacific Naval Combat Weapons Market Revenue (billion), by Consumption Analysis 2025 & 2033
- Figure 53: Asia Pacific Naval Combat Weapons Market Revenue Share (%), by Consumption Analysis 2025 & 2033
- Figure 54: Asia Pacific Naval Combat Weapons Market Revenue (billion), by Import Market Analysis (Value & Volume) 2025 & 2033
- Figure 55: Asia Pacific Naval Combat Weapons Market Revenue Share (%), by Import Market Analysis (Value & Volume) 2025 & 2033
- Figure 56: Asia Pacific Naval Combat Weapons Market Revenue (billion), by Export Market Analysis (Value & Volume) 2025 & 2033
- Figure 57: Asia Pacific Naval Combat Weapons Market Revenue Share (%), by Export Market Analysis (Value & Volume) 2025 & 2033
- Figure 58: Asia Pacific Naval Combat Weapons Market Revenue (billion), by Price Trend Analysis 2025 & 2033
- Figure 59: Asia Pacific Naval Combat Weapons Market Revenue Share (%), by Price Trend Analysis 2025 & 2033
- Figure 60: Asia Pacific Naval Combat Weapons Market Revenue (billion), by Country 2025 & 2033
- Figure 61: Asia Pacific Naval Combat Weapons Market Revenue Share (%), by Country 2025 & 2033
List of Tables
- Table 1: Global Naval Combat Weapons Market Revenue billion Forecast, by Production Analysis 2020 & 2033
- Table 2: Global Naval Combat Weapons Market Revenue billion Forecast, by Consumption Analysis 2020 & 2033
- Table 3: Global Naval Combat Weapons Market Revenue billion Forecast, by Import Market Analysis (Value & Volume) 2020 & 2033
- Table 4: Global Naval Combat Weapons Market Revenue billion Forecast, by Export Market Analysis (Value & Volume) 2020 & 2033
- Table 5: Global Naval Combat Weapons Market Revenue billion Forecast, by Price Trend Analysis 2020 & 2033
- Table 6: Global Naval Combat Weapons Market Revenue billion Forecast, by Region 2020 & 2033
- Table 7: Global Naval Combat Weapons Market Revenue billion Forecast, by Production Analysis 2020 & 2033
- Table 8: Global Naval Combat Weapons Market Revenue billion Forecast, by Consumption Analysis 2020 & 2033
- Table 9: Global Naval Combat Weapons Market Revenue billion Forecast, by Import Market Analysis (Value & Volume) 2020 & 2033
- Table 10: Global Naval Combat Weapons Market Revenue billion Forecast, by Export Market Analysis (Value & Volume) 2020 & 2033
- Table 11: Global Naval Combat Weapons Market Revenue billion Forecast, by Price Trend Analysis 2020 & 2033
- Table 12: Global Naval Combat Weapons Market Revenue billion Forecast, by Country 2020 & 2033
- Table 13: United States Naval Combat Weapons Market Revenue (billion) Forecast, by Application 2020 & 2033
- Table 14: Canada Naval Combat Weapons Market Revenue (billion) Forecast, by Application 2020 & 2033
- Table 15: Mexico Naval Combat Weapons Market Revenue (billion) Forecast, by Application 2020 & 2033
- Table 16: Global Naval Combat Weapons Market Revenue billion Forecast, by Production Analysis 2020 & 2033
- Table 17: Global Naval Combat Weapons Market Revenue billion Forecast, by Consumption Analysis 2020 & 2033
- Table 18: Global Naval Combat Weapons Market Revenue billion Forecast, by Import Market Analysis (Value & Volume) 2020 & 2033
- Table 19: Global Naval Combat Weapons Market Revenue billion Forecast, by Export Market Analysis (Value & Volume) 2020 & 2033
- Table 20: Global Naval Combat Weapons Market Revenue billion Forecast, by Price Trend Analysis 2020 & 2033
- Table 21: Global Naval Combat Weapons Market Revenue billion Forecast, by Country 2020 & 2033
- Table 22: Brazil Naval Combat Weapons Market Revenue (billion) Forecast, by Application 2020 & 2033
- Table 23: Argentina Naval Combat Weapons Market Revenue (billion) Forecast, by Application 2020 & 2033
- Table 24: Rest of South America Naval Combat Weapons Market Revenue (billion) Forecast, by Application 2020 & 2033
- Table 25: Global Naval Combat Weapons Market Revenue billion Forecast, by Production Analysis 2020 & 2033
- Table 26: Global Naval Combat Weapons Market Revenue billion Forecast, by Consumption Analysis 2020 & 2033
- Table 27: Global Naval Combat Weapons Market Revenue billion Forecast, by Import Market Analysis (Value & Volume) 2020 & 2033
- Table 28: Global Naval Combat Weapons Market Revenue billion Forecast, by Export Market Analysis (Value & Volume) 2020 & 2033
- Table 29: Global Naval Combat Weapons Market Revenue billion Forecast, by Price Trend Analysis 2020 & 2033
- Table 30: Global Naval Combat Weapons Market Revenue billion Forecast, by Country 2020 & 2033
- Table 31: United Kingdom Naval Combat Weapons Market Revenue (billion) Forecast, by Application 2020 & 2033
- Table 32: Germany Naval Combat Weapons Market Revenue (billion) Forecast, by Application 2020 & 2033
- Table 33: France Naval Combat Weapons Market Revenue (billion) Forecast, by Application 2020 & 2033
- Table 34: Italy Naval Combat Weapons Market Revenue (billion) Forecast, by Application 2020 & 2033
- Table 35: Spain Naval Combat Weapons Market Revenue (billion) Forecast, by Application 2020 & 2033
- Table 36: Russia Naval Combat Weapons Market Revenue (billion) Forecast, by Application 2020 & 2033
- Table 37: Benelux Naval Combat Weapons Market Revenue (billion) Forecast, by Application 2020 & 2033
- Table 38: Nordics Naval Combat Weapons Market Revenue (billion) Forecast, by Application 2020 & 2033
- Table 39: Rest of Europe Naval Combat Weapons Market Revenue (billion) Forecast, by Application 2020 & 2033
- Table 40: Global Naval Combat Weapons Market Revenue billion Forecast, by Production Analysis 2020 & 2033
- Table 41: Global Naval Combat Weapons Market Revenue billion Forecast, by Consumption Analysis 2020 & 2033
- Table 42: Global Naval Combat Weapons Market Revenue billion Forecast, by Import Market Analysis (Value & Volume) 2020 & 2033
- Table 43: Global Naval Combat Weapons Market Revenue billion Forecast, by Export Market Analysis (Value & Volume) 2020 & 2033
- Table 44: Global Naval Combat Weapons Market Revenue billion Forecast, by Price Trend Analysis 2020 & 2033
- Table 45: Global Naval Combat Weapons Market Revenue billion Forecast, by Country 2020 & 2033
- Table 46: Turkey Naval Combat Weapons Market Revenue (billion) Forecast, by Application 2020 & 2033
- Table 47: Israel Naval Combat Weapons Market Revenue (billion) Forecast, by Application 2020 & 2033
- Table 48: GCC Naval Combat Weapons Market Revenue (billion) Forecast, by Application 2020 & 2033
- Table 49: North Africa Naval Combat Weapons Market Revenue (billion) Forecast, by Application 2020 & 2033
- Table 50: South Africa Naval Combat Weapons Market Revenue (billion) Forecast, by Application 2020 & 2033
- Table 51: Rest of Middle East & Africa Naval Combat Weapons Market Revenue (billion) Forecast, by Application 2020 & 2033
- Table 52: Global Naval Combat Weapons Market Revenue billion Forecast, by Production Analysis 2020 & 2033
- Table 53: Global Naval Combat Weapons Market Revenue billion Forecast, by Consumption Analysis 2020 & 2033
- Table 54: Global Naval Combat Weapons Market Revenue billion Forecast, by Import Market Analysis (Value & Volume) 2020 & 2033
- Table 55: Global Naval Combat Weapons Market Revenue billion Forecast, by Export Market Analysis (Value & Volume) 2020 & 2033
- Table 56: Global Naval Combat Weapons Market Revenue billion Forecast, by Price Trend Analysis 2020 & 2033
- Table 57: Global Naval Combat Weapons Market Revenue billion Forecast, by Country 2020 & 2033
- Table 58: China Naval Combat Weapons Market Revenue (billion) Forecast, by Application 2020 & 2033
- Table 59: India Naval Combat Weapons Market Revenue (billion) Forecast, by Application 2020 & 2033
- Table 60: Japan Naval Combat Weapons Market Revenue (billion) Forecast, by Application 2020 & 2033
- Table 61: South Korea Naval Combat Weapons Market Revenue (billion) Forecast, by Application 2020 & 2033
- Table 62: ASEAN Naval Combat Weapons Market Revenue (billion) Forecast, by Application 2020 & 2033
- Table 63: Oceania Naval Combat Weapons Market Revenue (billion) Forecast, by Application 2020 & 2033
- Table 64: Rest of Asia Pacific Naval Combat Weapons Market Revenue (billion) Forecast, by Application 2020 & 2033
Frequently Asked Questions
1. What is the projected Compound Annual Growth Rate (CAGR) of the Naval Combat Weapons Market?
The projected CAGR is approximately 7.52%.
2. Which companies are prominent players in the Naval Combat Weapons Market?
Key companies in the market include General Dynamics Corporation, Raytheon Corporation, Leonardo SpA, Kongsberg Gruppen, Lockheed Martin Corporation, Terma, QinetiQ Grou, Elbit Systems, Thales Corporation, L3 Harris Corporation, BAE Systems Plc, SAAB AB.
3. What are the main segments of the Naval Combat Weapons Market?
The market segments include Production Analysis, Consumption Analysis, Import Market Analysis (Value & Volume), Export Market Analysis (Value & Volume), Price Trend Analysis.
4. Can you provide details about the market size?
The market size is estimated to be USD 10.38 billion as of 2022.
5. What are some drivers contributing to market growth?
Increase in Internet of Things (IoT) and Autonomous Systems; Rise in Demand for Military and Defense Satellite Communication Solutions.
6. What are the notable trends driving market growth?
Submarines Segment Will Showcase Significant Growth During the Forecast Period.
7. Are there any restraints impacting market growth?
Cybersecurity Threats to Satellite Communication; Interference in Transmission of Data.
8. Can you provide examples of recent developments in the market?
N/A
9. What pricing options are available for accessing the report?
Pricing options include single-user, multi-user, and enterprise licenses priced at USD 4750, USD 5250, and USD 8750 respectively.
10. Is the market size provided in terms of value or volume?
The market size is provided in terms of value, measured in billion.
11. Are there any specific market keywords associated with the report?
Yes, the market keyword associated with the report is "Naval Combat Weapons Market," which aids in identifying and referencing the specific market segment covered.
12. How do I determine which pricing option suits my needs best?
The pricing options vary based on user requirements and access needs. Individual users may opt for single-user licenses, while businesses requiring broader access may choose multi-user or enterprise licenses for cost-effective access to the report.
13. Are there any additional resources or data provided in the Naval Combat Weapons Market report?
While the report offers comprehensive insights, it's advisable to review the specific contents or supplementary materials provided to ascertain if additional resources or data are available.
14. How can I stay updated on further developments or reports in the Naval Combat Weapons Market?
To stay informed about further developments, trends, and reports in the Naval Combat Weapons Market, consider subscribing to industry newsletters, following relevant companies and organizations, or regularly checking reputable industry news sources and publications.
Methodology
Step 1 - Identification of Relevant Samples Size from Population Database


Step 2 - Approaches for Defining Global Market Size (Value, Volume* & Price*)

Note*: In applicable scenarios
Step 3 - Data Sources
Primary Research
- Web Analytics
- Survey Reports
- Research Institute
- Latest Research Reports
- Opinion Leaders
Secondary Research
- Annual Reports
- White Paper
- Latest Press Release
- Industry Association
- Paid Database
- Investor Presentations

Step 4 - Data Triangulation
Involves using different sources of information in order to increase the validity of a study
These sources are likely to be stakeholders in a program - participants, other researchers, program staff, other community members, and so on.
Then we put all data in single framework & apply various statistical tools to find out the dynamic on the market.
During the analysis stage, feedback from the stakeholder groups would be compared to determine areas of agreement as well as areas of divergence