

Key Insights
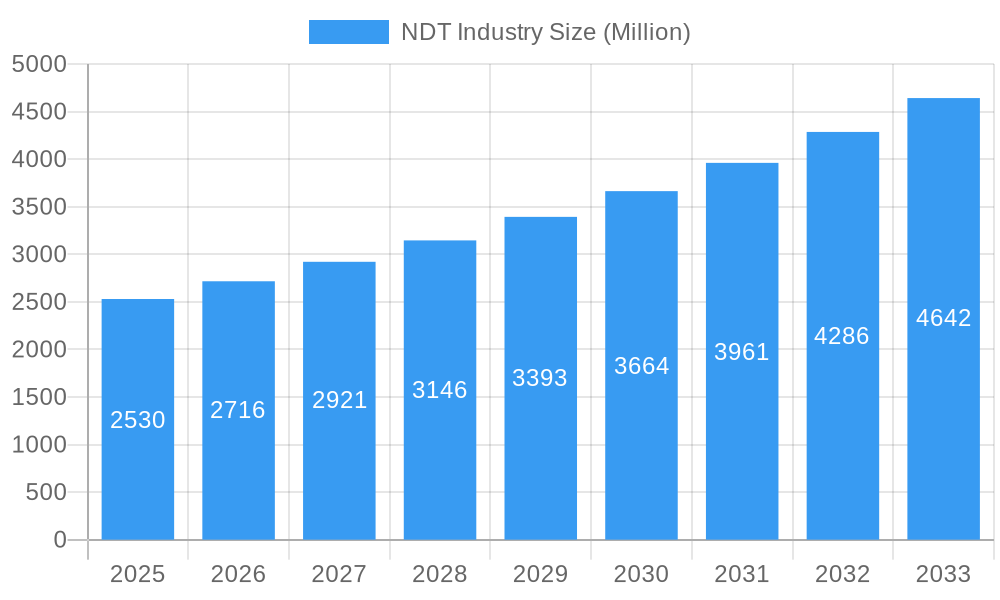
The Non-Destructive Testing (NDT) market, valued at $2.53 billion in 2025, is projected to experience robust growth, driven by a compound annual growth rate (CAGR) of 7.35% from 2025 to 2033. This expansion is fueled by several key factors. The increasing demand for infrastructure development, particularly in emerging economies, necessitates rigorous quality control and safety checks, bolstering the adoption of NDT methods. Furthermore, the rising complexity of manufacturing processes across various industries, including automotive, aerospace, and energy, necessitates advanced NDT techniques to ensure product reliability and prevent catastrophic failures. Stringent regulatory frameworks mandating NDT procedures in critical infrastructure projects and manufacturing also contribute significantly to market growth. Technological advancements, such as the integration of artificial intelligence and machine learning in NDT equipment, are enhancing inspection accuracy and efficiency, further propelling market expansion.
NDT Industry Market Size (In Billion)
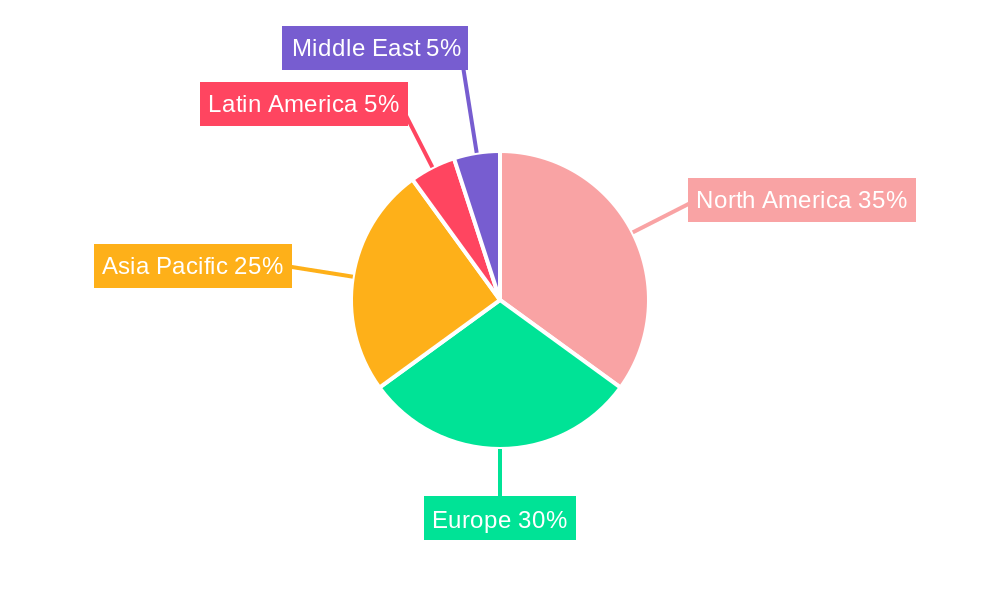
The NDT market is segmented by testing technology (radiography, ultrasonic, magnetic particle, liquid penetrant, visual, eddy current, and others), end-user industry (oil & gas, power & energy, construction, automotive & transportation, aerospace & defense, and others), and type (services and equipment). While radiography and ultrasonic testing currently dominate the market, the adoption of newer technologies like eddy current and advanced visual inspection methods is accelerating. The oil & gas and power & energy sectors are major consumers of NDT services and equipment due to the critical safety and regulatory requirements in these industries. The geographic distribution of the market sees North America and Europe holding significant shares, but the Asia-Pacific region is expected to witness the fastest growth, driven by rapid industrialization and infrastructure development in countries like China and India. The competitive landscape is characterized by a mix of large multinational corporations and specialized NDT service providers, fostering innovation and competition.
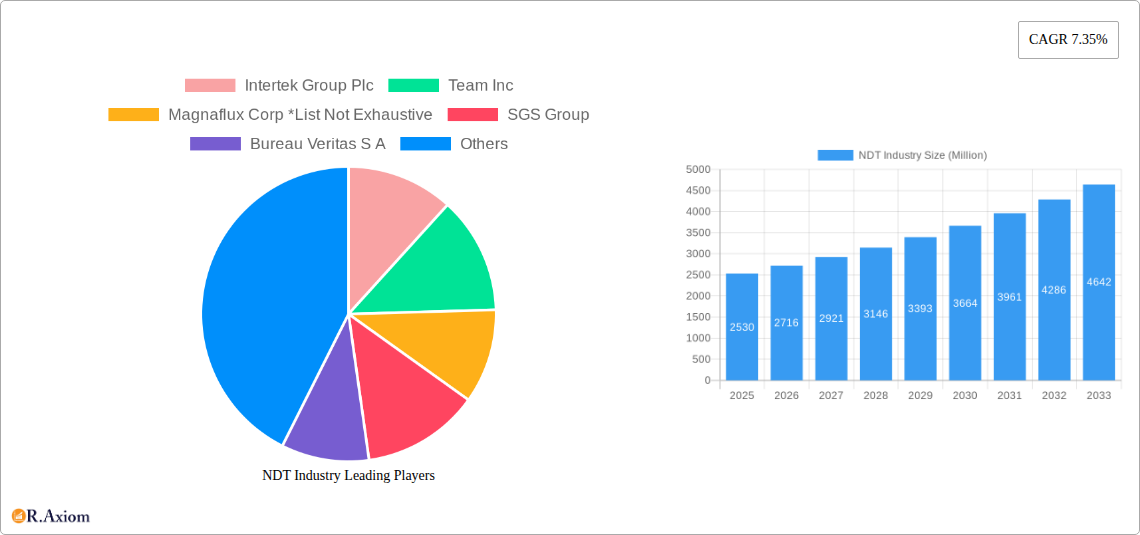
NDT Industry Company Market Share
NDT Industry Market Analysis: A Comprehensive Report (2019-2033)
This comprehensive report provides an in-depth analysis of the Non-Destructive Testing (NDT) industry, encompassing market size, segmentation, growth drivers, challenges, and future opportunities. With a study period spanning 2019-2033, a base year of 2025, and a forecast period of 2025-2033, this report offers actionable insights for industry stakeholders, investors, and businesses operating within this dynamic sector. The global NDT market is estimated to be worth $XX Million in 2025, exhibiting a Compound Annual Growth Rate (CAGR) of XX% during the forecast period.
NDT Industry Market Concentration & Innovation
The NDT industry is characterized by a moderately concentrated market structure. Leading global players such as Intertek Group Plc, SGS Group, Bureau Veritas S.A., and Team Inc hold substantial market shares, indicating their significant influence. However, the industry is also vibrant with numerous smaller, specialized companies that are crucial for fostering innovation and maintaining a competitive landscape. Projections for 2025 indicate that Intertek is expected to hold approximately XX% of the market share, followed by SGS Group with XX%, Bureau Veritas S.A. with XX%, and Team Inc with XX%. The remaining portion of the market share is distributed among a diverse range of other key players, including Magnaflux Corp, Nikon Metrology NV, Fujifilm Corporation, TÜV Rheinland AG, Mistras Group Inc, Yxlon International GmbH (a subsidiary of Comet Holding AG), Applus Services, Olympus Corporation, and GE Measurement & Control Solutions.
Innovation within the NDT sector is primarily propelled by the escalating demand for sophisticated testing methodologies, the enforcement of rigorous regulatory standards across a multitude of industries, and the continuous pursuit of enhanced safety and operational efficiency. In recent years, there has been a notable surge in investments directed towards the development of automated NDT systems and those leveraging artificial intelligence (AI). Furthermore, mergers and acquisitions (M&A) activity has played a pivotal role in reshaping the industry's dynamics, with deal values surpassing $XX Million over the past five years. These strategic moves are predominantly aimed at expanding service portfolios and increasing geographic reach.
- Key Innovation Drivers: Significant advancements in sensor technology, sophisticated AI-powered data analysis platforms, the increasing integration of automation, and the miniaturization of NDT equipment are all contributing to a more efficient and capable industry.
- Regulatory Frameworks: The implementation of stringent safety and quality standards, particularly in high-stakes sectors like aerospace, oil & gas, and construction, acts as a powerful catalyst for the adoption of advanced NDT technologies.
- Product Substitutes: While direct substitutes for NDT methods are limited, advancements in alternative inspection technologies present indirect competition, pushing NDT providers to continuously enhance their offerings.
- End-User Trends: The widespread adoption of predictive maintenance strategies across a broad spectrum of industries is a major driver, significantly boosting the demand for comprehensive NDT services.
- M&A Activity: Ongoing consolidation through strategic mergers and acquisitions is a defining trend, contributing to increased market concentration while simultaneously leading to the expansion of service capabilities and a broader spectrum of offerings from leading entities.
NDT Industry Industry Trends & Insights
The NDT market is experiencing robust growth, propelled by several key factors. The increasing demand for improved infrastructure, rising safety and quality standards across various industries, and the growing adoption of predictive maintenance strategies are primary drivers. Technological disruptions, such as the integration of AI and automation in NDT equipment, are enhancing efficiency and accuracy, leading to improved market penetration. Consumer preference for reliable and efficient NDT solutions fuels demand for advanced technologies and services. The competitive landscape is characterized by intense competition among established players and emerging companies. The market is witnessing a shift towards integrated NDT solutions that offer comprehensive testing capabilities and data analytics. The market penetration rate of advanced NDT technologies is growing steadily, particularly in sectors such as aerospace and automotive.
Dominant Markets & Segments in NDT Industry
The global NDT market is predominantly led by the North American region, with Europe and Asia Pacific following closely in terms of market influence and activity. Within specific market segments:
- By Testing Technology: Ultrasonic testing currently commands the largest market share. Its widespread adoption is attributed to its exceptional versatility and its applicability across a diverse array of industrial sectors. Radiography testing continues to maintain a substantial market share, owing to its proven reliability and established track record in critical inspection applications.
- By End-user Industry: The oil & gas sector stands as the dominant end-user industry for NDT services and equipment, driven by the imperative for robust safety protocols and asset integrity management. The power & energy and automotive & transportation sectors follow as significant consumers of NDT solutions, both requiring stringent quality control and adherence to safety standards.
- By Type: The services segment of the NDT market is considerably larger than the equipment segment. This indicates a stronger demand for expert NDT testing services, including inspection, analysis, and reporting, in comparison to the outright purchase of NDT equipment.
Key Drivers for Dominant Segments:
- Oil & Gas: The critical need for ensuring pipeline integrity, coupled with stringent safety regulations governing exploration, production, and transportation, fuels the demand for comprehensive NDT solutions.
- Power & Energy: The continuous inspection and maintenance of power generation assets, including turbines, reactors, and transmission infrastructure, are essential for ensuring safe, reliable, and efficient operation, thereby driving NDT adoption.
- Automotive & Transportation: Rigorous quality control measures throughout the manufacturing process and for ongoing maintenance of vehicles, aircraft, and other transportation modes necessitate the application of NDT techniques to guarantee safety and performance.
- Ultrasonic Testing: Its inherent versatility, portability, and adeptness at detecting subsurface and internal flaws make it a preferred technology across numerous applications.
- Services: The increasing trend of end-user industries to outsource their NDT testing and inspection needs to specialized service providers contributes significantly to the growth of this segment.
NDT Industry Product Developments
Recent years have witnessed significant product innovations in the NDT industry. Advancements in sensor technology, AI-powered data analysis, and automation are leading to the development of more accurate, efficient, and user-friendly NDT equipment and services. The integration of these technologies enables faster inspection times, improved defect detection, and reduced operational costs. This trend is transforming the industry by enabling predictive maintenance strategies and improving overall asset management. Furthermore, the development of portable and wireless NDT devices is expanding accessibility and application across various industries and locations.
Report Scope & Segmentation Analysis
This comprehensive report provides an in-depth analysis of the NDT market, segmented by key parameters. These include testing technology (encompassing radiography, ultrasonic, magnetic particle, liquid penetrant, visual inspection, eddy current, and other emerging techniques), end-user industry (covering oil & gas, power & energy, construction, automotive & transportation, aerospace, defense, and other relevant sectors), and type (categorizing the market into services and equipment). Each segment is meticulously analyzed, offering detailed insights into growth trajectories, current market sizes, and the intricate competitive dynamics at play. The global NDT market is forecasted to reach an impressive $XX Million by the year 2033, highlighting its robust expansion potential.
Key Drivers of NDT Industry Growth
A confluence of powerful factors is propelling the growth trajectory of the NDT industry forward. These key drivers include:
- Stringent Safety Regulations: Critical industries such as aerospace, oil & gas, and nuclear power adhere to exceptionally strict quality control and safety mandates. This regulatory environment inherently increases the demand for reliable and advanced NDT inspection methods to ensure compliance and prevent failures.
- Growing Infrastructure Development: Ongoing and planned investments in infrastructure projects worldwide, including bridges, buildings, pipelines, and transportation networks, necessitate thorough NDT inspection at various stages of construction and maintenance to ensure structural integrity and longevity.
- Technological Advancements: The integration of cutting-edge technologies such as Artificial Intelligence (AI) and automation is revolutionizing NDT. These advancements significantly enhance inspection efficiency, accuracy, and the ability to analyze vast amounts of data, thereby improving the overall value proposition and market adoption of NDT solutions.
Challenges in the NDT Industry Sector
The NDT industry faces several challenges, including:
- High initial investment costs: Advanced NDT equipment can be expensive, potentially hindering adoption by smaller companies.
- Skilled labor shortages: A shortage of qualified NDT technicians can limit service capacity.
- Data interpretation complexity: Analysis of complex NDT data requires specialized expertise.
Emerging Opportunities in NDT Industry
The NDT industry presents numerous emerging opportunities, including:
- Growing adoption of predictive maintenance: NDT plays a crucial role in implementing predictive maintenance, creating strong growth potential.
- Expansion into new markets: Developing economies offer significant growth potential for NDT services.
- Development of advanced NDT technologies: Continuous innovation in NDT technologies presents significant growth and market expansion opportunities.
Leading Players in the NDT Industry Market
- Intertek Group Plc
- Team Inc
- Magnaflux Corp
- SGS Group
- Bureau Veritas S A
- Nikon Metrology NV
- Fujifilm Corporation
- TÜV Rheinland AG
- Mistras Group Inc
- Yxlon International GmbH (Comet Holding AG)
- Applus Services
- Olympus Corporation
- GE Measurement & Control Solutions
Key Developments in NDT Industry Industry
- January 2023: Company X launched a new AI-powered ultrasonic testing system.
- March 2022: Companies Y and Z merged, expanding their NDT service offerings.
- October 2021: New regulatory standards for NDT in the aerospace sector were implemented. (Further developments to be added based on available data)
Strategic Outlook for NDT Industry Market
The NDT industry is strategically positioned for sustained and robust growth in the coming years. This upward trajectory is expected to be fueled by continuous technological innovation, the increasing stringency of regulatory requirements across global industries, and the accelerating adoption of predictive maintenance strategies. Emerging opportunities in untapped geographic markets and the ongoing development of novel and more sophisticated NDT technologies are poised to further accelerate market expansion. The industry is also likely to experience continued consolidation through strategic mergers and acquisitions. These M&A activities will not only lead to increased market concentration among larger players but will also result in the development of more comprehensive and integrated service offerings. Consequently, sustained investment in research and development will remain an indispensable element for companies seeking to maintain a competitive edge and capitalize on the evolving opportunities within this dynamic sector.
NDT Industry Segmentation
-
1. Type
- 1.1. Equipment
- 1.2. Services
-
2. Testing Technology
- 2.1. Radiography Testing
- 2.2. Ultrasonic Testing
- 2.3. Magnetic Particle Testing
- 2.4. Liquid Penetrant Testing
- 2.5. Visual Inspection Testing
- 2.6. Eddy Current Testing
- 2.7. Other Testing Technologies
-
3. End-user Industry
- 3.1. Oil and Gas
- 3.2. Power and Energy
- 3.3. Construction
- 3.4. Automotive and Transportation
- 3.5. Aerospace
- 3.6. Defense
- 3.7. Other End User Industries
NDT Industry Segmentation By Geography
-
1. North America
- 1.1. United States
- 1.2. Canada
-
2. Europe
- 2.1. Germany
- 2.2. United Kingdom
- 2.3. France
-
3. Asia
- 3.1. China
- 3.2. Japan
- 3.3. India
- 4. Australia and New Zealand
-
5. Latin America
- 5.1. Brazil
- 5.2. Argentina
- 5.3. Mexico
-
6. Middle East and Africa
- 6.1. United Arab Emirates
- 6.2. Saudi Arabia
- 6.3. South Africa
NDT Industry Regional Market Share
Geographic Coverage of NDT Industry
NDT Industry REPORT HIGHLIGHTS
| Aspects | Details |
|---|---|
| Study Period | 2020-2034 |
| Base Year | 2025 |
| Estimated Year | 2026 |
| Forecast Period | 2026-2034 |
| Historical Period | 2020-2025 |
| Growth Rate | CAGR of 7.35% from 2020-2034 |
| Segmentation |
|
Table of Contents
- 1. Introduction
- 1.1. Research Scope
- 1.2. Market Segmentation
- 1.3. Research Objective
- 1.4. Definitions and Assumptions
- 2. Executive Summary
- 2.1. Market Snapshot
- 3. Market Dynamics
- 3.1. Market Drivers
- 3.2. Market Restrains
- 3.3. Market Trends
- 3.4. Market Opportunities
- 4. Market Factor Analysis
- 4.1. Porters Five Forces
- 4.1.1. Bargaining Power of Suppliers
- 4.1.2. Bargaining Power of Buyers
- 4.1.3. Threat of New Entrants
- 4.1.4. Threat of Substitutes
- 4.1.5. Competitive Rivalry
- 4.2. PESTEL analysis
- 4.3. BCG Analysis
- 4.3.1. Stars (High Growth, High Market Share)
- 4.3.2. Cash Cows (Low Growth, High Market Share)
- 4.3.3. Question Mark (High Growth, Low Market Share)
- 4.3.4. Dogs (Low Growth, Low Market Share)
- 4.4. Ansoff Matrix Analysis
- 4.5. Supply Chain Analysis
- 4.6. Regulatory Landscape
- 4.7. Current Market Potential and Opportunity Assessment (TAM–SAM–SOM Framework)
- 4.8. RAX Analyst Note
- 4.1. Porters Five Forces
- 5. Market Analysis, Insights and Forecast 2021-2033
- 5.1. Market Analysis, Insights and Forecast - by Type
- 5.1.1. Equipment
- 5.1.2. Services
- 5.2. Market Analysis, Insights and Forecast - by Testing Technology
- 5.2.1. Radiography Testing
- 5.2.2. Ultrasonic Testing
- 5.2.3. Magnetic Particle Testing
- 5.2.4. Liquid Penetrant Testing
- 5.2.5. Visual Inspection Testing
- 5.2.6. Eddy Current Testing
- 5.2.7. Other Testing Technologies
- 5.3. Market Analysis, Insights and Forecast - by End-user Industry
- 5.3.1. Oil and Gas
- 5.3.2. Power and Energy
- 5.3.3. Construction
- 5.3.4. Automotive and Transportation
- 5.3.5. Aerospace
- 5.3.6. Defense
- 5.3.7. Other End User Industries
- 5.4. Market Analysis, Insights and Forecast - by Region
- 5.4.1. North America
- 5.4.2. Europe
- 5.4.3. Asia
- 5.4.4. Australia and New Zealand
- 5.4.5. Latin America
- 5.4.6. Middle East and Africa
- 5.1. Market Analysis, Insights and Forecast - by Type
- 6. Global NDT Industry Analysis, Insights and Forecast, 2021-2033
- 6.1. Market Analysis, Insights and Forecast - by Type
- 6.1.1. Equipment
- 6.1.2. Services
- 6.2. Market Analysis, Insights and Forecast - by Testing Technology
- 6.2.1. Radiography Testing
- 6.2.2. Ultrasonic Testing
- 6.2.3. Magnetic Particle Testing
- 6.2.4. Liquid Penetrant Testing
- 6.2.5. Visual Inspection Testing
- 6.2.6. Eddy Current Testing
- 6.2.7. Other Testing Technologies
- 6.3. Market Analysis, Insights and Forecast - by End-user Industry
- 6.3.1. Oil and Gas
- 6.3.2. Power and Energy
- 6.3.3. Construction
- 6.3.4. Automotive and Transportation
- 6.3.5. Aerospace
- 6.3.6. Defense
- 6.3.7. Other End User Industries
- 6.1. Market Analysis, Insights and Forecast - by Type
- 7. North America NDT Industry Analysis, Insights and Forecast, 2020-2032
- 7.1. Market Analysis, Insights and Forecast - by Type
- 7.1.1. Equipment
- 7.1.2. Services
- 7.2. Market Analysis, Insights and Forecast - by Testing Technology
- 7.2.1. Radiography Testing
- 7.2.2. Ultrasonic Testing
- 7.2.3. Magnetic Particle Testing
- 7.2.4. Liquid Penetrant Testing
- 7.2.5. Visual Inspection Testing
- 7.2.6. Eddy Current Testing
- 7.2.7. Other Testing Technologies
- 7.3. Market Analysis, Insights and Forecast - by End-user Industry
- 7.3.1. Oil and Gas
- 7.3.2. Power and Energy
- 7.3.3. Construction
- 7.3.4. Automotive and Transportation
- 7.3.5. Aerospace
- 7.3.6. Defense
- 7.3.7. Other End User Industries
- 7.1. Market Analysis, Insights and Forecast - by Type
- 8. Europe NDT Industry Analysis, Insights and Forecast, 2020-2032
- 8.1. Market Analysis, Insights and Forecast - by Type
- 8.1.1. Equipment
- 8.1.2. Services
- 8.2. Market Analysis, Insights and Forecast - by Testing Technology
- 8.2.1. Radiography Testing
- 8.2.2. Ultrasonic Testing
- 8.2.3. Magnetic Particle Testing
- 8.2.4. Liquid Penetrant Testing
- 8.2.5. Visual Inspection Testing
- 8.2.6. Eddy Current Testing
- 8.2.7. Other Testing Technologies
- 8.3. Market Analysis, Insights and Forecast - by End-user Industry
- 8.3.1. Oil and Gas
- 8.3.2. Power and Energy
- 8.3.3. Construction
- 8.3.4. Automotive and Transportation
- 8.3.5. Aerospace
- 8.3.6. Defense
- 8.3.7. Other End User Industries
- 8.1. Market Analysis, Insights and Forecast - by Type
- 9. Asia NDT Industry Analysis, Insights and Forecast, 2020-2032
- 9.1. Market Analysis, Insights and Forecast - by Type
- 9.1.1. Equipment
- 9.1.2. Services
- 9.2. Market Analysis, Insights and Forecast - by Testing Technology
- 9.2.1. Radiography Testing
- 9.2.2. Ultrasonic Testing
- 9.2.3. Magnetic Particle Testing
- 9.2.4. Liquid Penetrant Testing
- 9.2.5. Visual Inspection Testing
- 9.2.6. Eddy Current Testing
- 9.2.7. Other Testing Technologies
- 9.3. Market Analysis, Insights and Forecast - by End-user Industry
- 9.3.1. Oil and Gas
- 9.3.2. Power and Energy
- 9.3.3. Construction
- 9.3.4. Automotive and Transportation
- 9.3.5. Aerospace
- 9.3.6. Defense
- 9.3.7. Other End User Industries
- 9.1. Market Analysis, Insights and Forecast - by Type
- 10. Australia and New Zealand NDT Industry Analysis, Insights and Forecast, 2020-2032
- 10.1. Market Analysis, Insights and Forecast - by Type
- 10.1.1. Equipment
- 10.1.2. Services
- 10.2. Market Analysis, Insights and Forecast - by Testing Technology
- 10.2.1. Radiography Testing
- 10.2.2. Ultrasonic Testing
- 10.2.3. Magnetic Particle Testing
- 10.2.4. Liquid Penetrant Testing
- 10.2.5. Visual Inspection Testing
- 10.2.6. Eddy Current Testing
- 10.2.7. Other Testing Technologies
- 10.3. Market Analysis, Insights and Forecast - by End-user Industry
- 10.3.1. Oil and Gas
- 10.3.2. Power and Energy
- 10.3.3. Construction
- 10.3.4. Automotive and Transportation
- 10.3.5. Aerospace
- 10.3.6. Defense
- 10.3.7. Other End User Industries
- 10.1. Market Analysis, Insights and Forecast - by Type
- 11. Latin America NDT Industry Analysis, Insights and Forecast, 2020-2032
- 11.1. Market Analysis, Insights and Forecast - by Type
- 11.1.1. Equipment
- 11.1.2. Services
- 11.2. Market Analysis, Insights and Forecast - by Testing Technology
- 11.2.1. Radiography Testing
- 11.2.2. Ultrasonic Testing
- 11.2.3. Magnetic Particle Testing
- 11.2.4. Liquid Penetrant Testing
- 11.2.5. Visual Inspection Testing
- 11.2.6. Eddy Current Testing
- 11.2.7. Other Testing Technologies
- 11.3. Market Analysis, Insights and Forecast - by End-user Industry
- 11.3.1. Oil and Gas
- 11.3.2. Power and Energy
- 11.3.3. Construction
- 11.3.4. Automotive and Transportation
- 11.3.5. Aerospace
- 11.3.6. Defense
- 11.3.7. Other End User Industries
- 11.1. Market Analysis, Insights and Forecast - by Type
- 12. Middle East and Africa NDT Industry Analysis, Insights and Forecast, 2020-2032
- 12.1. Market Analysis, Insights and Forecast - by Type
- 12.1.1. Equipment
- 12.1.2. Services
- 12.2. Market Analysis, Insights and Forecast - by Testing Technology
- 12.2.1. Radiography Testing
- 12.2.2. Ultrasonic Testing
- 12.2.3. Magnetic Particle Testing
- 12.2.4. Liquid Penetrant Testing
- 12.2.5. Visual Inspection Testing
- 12.2.6. Eddy Current Testing
- 12.2.7. Other Testing Technologies
- 12.3. Market Analysis, Insights and Forecast - by End-user Industry
- 12.3.1. Oil and Gas
- 12.3.2. Power and Energy
- 12.3.3. Construction
- 12.3.4. Automotive and Transportation
- 12.3.5. Aerospace
- 12.3.6. Defense
- 12.3.7. Other End User Industries
- 12.1. Market Analysis, Insights and Forecast - by Type
- 13. Competitive Analysis
- 13.1. Company Profiles
- 13.1.1 Intertek Group Plc
- 13.1.1.1. Company Overview
- 13.1.1.2. Products
- 13.1.1.3. Company Financials
- 13.1.1.4. SWOT Analysis
- 13.1.2 Team Inc
- 13.1.2.1. Company Overview
- 13.1.2.2. Products
- 13.1.2.3. Company Financials
- 13.1.2.4. SWOT Analysis
- 13.1.3 Magnaflux Corp *List Not Exhaustive
- 13.1.3.1. Company Overview
- 13.1.3.2. Products
- 13.1.3.3. Company Financials
- 13.1.3.4. SWOT Analysis
- 13.1.4 SGS Group
- 13.1.4.1. Company Overview
- 13.1.4.2. Products
- 13.1.4.3. Company Financials
- 13.1.4.4. SWOT Analysis
- 13.1.5 Bureau Veritas S A
- 13.1.5.1. Company Overview
- 13.1.5.2. Products
- 13.1.5.3. Company Financials
- 13.1.5.4. SWOT Analysis
- 13.1.6 Nikon Metrology NV
- 13.1.6.1. Company Overview
- 13.1.6.2. Products
- 13.1.6.3. Company Financials
- 13.1.6.4. SWOT Analysis
- 13.1.7 Fujifilm Corporation
- 13.1.7.1. Company Overview
- 13.1.7.2. Products
- 13.1.7.3. Company Financials
- 13.1.7.4. SWOT Analysis
- 13.1.8 TÜV Rheinland AG
- 13.1.8.1. Company Overview
- 13.1.8.2. Products
- 13.1.8.3. Company Financials
- 13.1.8.4. SWOT Analysis
- 13.1.9 Mistras Group Inc
- 13.1.9.1. Company Overview
- 13.1.9.2. Products
- 13.1.9.3. Company Financials
- 13.1.9.4. SWOT Analysis
- 13.1.10 Yxlon International Gmbh (Comet Holding Ag)
- 13.1.10.1. Company Overview
- 13.1.10.2. Products
- 13.1.10.3. Company Financials
- 13.1.10.4. SWOT Analysis
- 13.1.11 Applus Services
- 13.1.11.1. Company Overview
- 13.1.11.2. Products
- 13.1.11.3. Company Financials
- 13.1.11.4. SWOT Analysis
- 13.1.12 Olympus Corporation
- 13.1.12.1. Company Overview
- 13.1.12.2. Products
- 13.1.12.3. Company Financials
- 13.1.12.4. SWOT Analysis
- 13.1.13 GE Measurement & Control Solutions
- 13.1.13.1. Company Overview
- 13.1.13.2. Products
- 13.1.13.3. Company Financials
- 13.1.13.4. SWOT Analysis
- 13.1.1 Intertek Group Plc
- 13.2. Market Entropy
- 13.2.1 Company's Key Areas Served
- 13.2.2 Recent Developments
- 13.3. Company Market Share Analysis 2025
- 13.3.1 Top 5 Companies Market Share Analysis
- 13.3.2 Top 3 Companies Market Share Analysis
- 13.4. List of Potential Customers
- 14. Research Methodology
List of Figures
- Figure 1: Global NDT Industry Revenue Breakdown (Million, %) by Region 2025 & 2033
- Figure 2: North America NDT Industry Revenue (Million), by Type 2025 & 2033
- Figure 3: North America NDT Industry Revenue Share (%), by Type 2025 & 2033
- Figure 4: North America NDT Industry Revenue (Million), by Testing Technology 2025 & 2033
- Figure 5: North America NDT Industry Revenue Share (%), by Testing Technology 2025 & 2033
- Figure 6: North America NDT Industry Revenue (Million), by End-user Industry 2025 & 2033
- Figure 7: North America NDT Industry Revenue Share (%), by End-user Industry 2025 & 2033
- Figure 8: North America NDT Industry Revenue (Million), by Country 2025 & 2033
- Figure 9: North America NDT Industry Revenue Share (%), by Country 2025 & 2033
- Figure 10: Europe NDT Industry Revenue (Million), by Type 2025 & 2033
- Figure 11: Europe NDT Industry Revenue Share (%), by Type 2025 & 2033
- Figure 12: Europe NDT Industry Revenue (Million), by Testing Technology 2025 & 2033
- Figure 13: Europe NDT Industry Revenue Share (%), by Testing Technology 2025 & 2033
- Figure 14: Europe NDT Industry Revenue (Million), by End-user Industry 2025 & 2033
- Figure 15: Europe NDT Industry Revenue Share (%), by End-user Industry 2025 & 2033
- Figure 16: Europe NDT Industry Revenue (Million), by Country 2025 & 2033
- Figure 17: Europe NDT Industry Revenue Share (%), by Country 2025 & 2033
- Figure 18: Asia NDT Industry Revenue (Million), by Type 2025 & 2033
- Figure 19: Asia NDT Industry Revenue Share (%), by Type 2025 & 2033
- Figure 20: Asia NDT Industry Revenue (Million), by Testing Technology 2025 & 2033
- Figure 21: Asia NDT Industry Revenue Share (%), by Testing Technology 2025 & 2033
- Figure 22: Asia NDT Industry Revenue (Million), by End-user Industry 2025 & 2033
- Figure 23: Asia NDT Industry Revenue Share (%), by End-user Industry 2025 & 2033
- Figure 24: Asia NDT Industry Revenue (Million), by Country 2025 & 2033
- Figure 25: Asia NDT Industry Revenue Share (%), by Country 2025 & 2033
- Figure 26: Australia and New Zealand NDT Industry Revenue (Million), by Type 2025 & 2033
- Figure 27: Australia and New Zealand NDT Industry Revenue Share (%), by Type 2025 & 2033
- Figure 28: Australia and New Zealand NDT Industry Revenue (Million), by Testing Technology 2025 & 2033
- Figure 29: Australia and New Zealand NDT Industry Revenue Share (%), by Testing Technology 2025 & 2033
- Figure 30: Australia and New Zealand NDT Industry Revenue (Million), by End-user Industry 2025 & 2033
- Figure 31: Australia and New Zealand NDT Industry Revenue Share (%), by End-user Industry 2025 & 2033
- Figure 32: Australia and New Zealand NDT Industry Revenue (Million), by Country 2025 & 2033
- Figure 33: Australia and New Zealand NDT Industry Revenue Share (%), by Country 2025 & 2033
- Figure 34: Latin America NDT Industry Revenue (Million), by Type 2025 & 2033
- Figure 35: Latin America NDT Industry Revenue Share (%), by Type 2025 & 2033
- Figure 36: Latin America NDT Industry Revenue (Million), by Testing Technology 2025 & 2033
- Figure 37: Latin America NDT Industry Revenue Share (%), by Testing Technology 2025 & 2033
- Figure 38: Latin America NDT Industry Revenue (Million), by End-user Industry 2025 & 2033
- Figure 39: Latin America NDT Industry Revenue Share (%), by End-user Industry 2025 & 2033
- Figure 40: Latin America NDT Industry Revenue (Million), by Country 2025 & 2033
- Figure 41: Latin America NDT Industry Revenue Share (%), by Country 2025 & 2033
- Figure 42: Middle East and Africa NDT Industry Revenue (Million), by Type 2025 & 2033
- Figure 43: Middle East and Africa NDT Industry Revenue Share (%), by Type 2025 & 2033
- Figure 44: Middle East and Africa NDT Industry Revenue (Million), by Testing Technology 2025 & 2033
- Figure 45: Middle East and Africa NDT Industry Revenue Share (%), by Testing Technology 2025 & 2033
- Figure 46: Middle East and Africa NDT Industry Revenue (Million), by End-user Industry 2025 & 2033
- Figure 47: Middle East and Africa NDT Industry Revenue Share (%), by End-user Industry 2025 & 2033
- Figure 48: Middle East and Africa NDT Industry Revenue (Million), by Country 2025 & 2033
- Figure 49: Middle East and Africa NDT Industry Revenue Share (%), by Country 2025 & 2033
List of Tables
- Table 1: Global NDT Industry Revenue Million Forecast, by Type 2020 & 2033
- Table 2: Global NDT Industry Revenue Million Forecast, by Testing Technology 2020 & 2033
- Table 3: Global NDT Industry Revenue Million Forecast, by End-user Industry 2020 & 2033
- Table 4: Global NDT Industry Revenue Million Forecast, by Region 2020 & 2033
- Table 5: Global NDT Industry Revenue Million Forecast, by Type 2020 & 2033
- Table 6: Global NDT Industry Revenue Million Forecast, by Testing Technology 2020 & 2033
- Table 7: Global NDT Industry Revenue Million Forecast, by End-user Industry 2020 & 2033
- Table 8: Global NDT Industry Revenue Million Forecast, by Country 2020 & 2033
- Table 9: United States NDT Industry Revenue (Million) Forecast, by Application 2020 & 2033
- Table 10: Canada NDT Industry Revenue (Million) Forecast, by Application 2020 & 2033
- Table 11: Global NDT Industry Revenue Million Forecast, by Type 2020 & 2033
- Table 12: Global NDT Industry Revenue Million Forecast, by Testing Technology 2020 & 2033
- Table 13: Global NDT Industry Revenue Million Forecast, by End-user Industry 2020 & 2033
- Table 14: Global NDT Industry Revenue Million Forecast, by Country 2020 & 2033
- Table 15: Germany NDT Industry Revenue (Million) Forecast, by Application 2020 & 2033
- Table 16: United Kingdom NDT Industry Revenue (Million) Forecast, by Application 2020 & 2033
- Table 17: France NDT Industry Revenue (Million) Forecast, by Application 2020 & 2033
- Table 18: Global NDT Industry Revenue Million Forecast, by Type 2020 & 2033
- Table 19: Global NDT Industry Revenue Million Forecast, by Testing Technology 2020 & 2033
- Table 20: Global NDT Industry Revenue Million Forecast, by End-user Industry 2020 & 2033
- Table 21: Global NDT Industry Revenue Million Forecast, by Country 2020 & 2033
- Table 22: China NDT Industry Revenue (Million) Forecast, by Application 2020 & 2033
- Table 23: Japan NDT Industry Revenue (Million) Forecast, by Application 2020 & 2033
- Table 24: India NDT Industry Revenue (Million) Forecast, by Application 2020 & 2033
- Table 25: Global NDT Industry Revenue Million Forecast, by Type 2020 & 2033
- Table 26: Global NDT Industry Revenue Million Forecast, by Testing Technology 2020 & 2033
- Table 27: Global NDT Industry Revenue Million Forecast, by End-user Industry 2020 & 2033
- Table 28: Global NDT Industry Revenue Million Forecast, by Country 2020 & 2033
- Table 29: Global NDT Industry Revenue Million Forecast, by Type 2020 & 2033
- Table 30: Global NDT Industry Revenue Million Forecast, by Testing Technology 2020 & 2033
- Table 31: Global NDT Industry Revenue Million Forecast, by End-user Industry 2020 & 2033
- Table 32: Global NDT Industry Revenue Million Forecast, by Country 2020 & 2033
- Table 33: Brazil NDT Industry Revenue (Million) Forecast, by Application 2020 & 2033
- Table 34: Argentina NDT Industry Revenue (Million) Forecast, by Application 2020 & 2033
- Table 35: Mexico NDT Industry Revenue (Million) Forecast, by Application 2020 & 2033
- Table 36: Global NDT Industry Revenue Million Forecast, by Type 2020 & 2033
- Table 37: Global NDT Industry Revenue Million Forecast, by Testing Technology 2020 & 2033
- Table 38: Global NDT Industry Revenue Million Forecast, by End-user Industry 2020 & 2033
- Table 39: Global NDT Industry Revenue Million Forecast, by Country 2020 & 2033
- Table 40: United Arab Emirates NDT Industry Revenue (Million) Forecast, by Application 2020 & 2033
- Table 41: Saudi Arabia NDT Industry Revenue (Million) Forecast, by Application 2020 & 2033
- Table 42: South Africa NDT Industry Revenue (Million) Forecast, by Application 2020 & 2033
Frequently Asked Questions
1. What is the projected Compound Annual Growth Rate (CAGR) of the NDT Industry?
The projected CAGR is approximately 7.35%.
2. Which companies are prominent players in the NDT Industry?
Key companies in the market include Intertek Group Plc, Team Inc, Magnaflux Corp *List Not Exhaustive, SGS Group, Bureau Veritas S A, Nikon Metrology NV, Fujifilm Corporation, TÜV Rheinland AG, Mistras Group Inc, Yxlon International Gmbh (Comet Holding Ag), Applus Services, Olympus Corporation, GE Measurement & Control Solutions.
3. What are the main segments of the NDT Industry?
The market segments include Type, Testing Technology, End-user Industry.
4. Can you provide details about the market size?
The market size is estimated to be USD 2.53 Million as of 2022.
5. What are some drivers contributing to market growth?
; Stringent Regulations Mandating Safety Standards; Increase in Demand for Flaw Detection to Reduce Repair Cost.
6. What are the notable trends driving market growth?
Power and Energy Sector Offers Potential Growth.
7. Are there any restraints impacting market growth?
; Lack of Skilled Workforce and Training Regulations.
8. Can you provide examples of recent developments in the market?
N/A
9. What pricing options are available for accessing the report?
Pricing options include single-user, multi-user, and enterprise licenses priced at USD 4750, USD 5250, and USD 8750 respectively.
10. Is the market size provided in terms of value or volume?
The market size is provided in terms of value, measured in Million.
11. Are there any specific market keywords associated with the report?
Yes, the market keyword associated with the report is "NDT Industry," which aids in identifying and referencing the specific market segment covered.
12. How do I determine which pricing option suits my needs best?
The pricing options vary based on user requirements and access needs. Individual users may opt for single-user licenses, while businesses requiring broader access may choose multi-user or enterprise licenses for cost-effective access to the report.
13. Are there any additional resources or data provided in the NDT Industry report?
While the report offers comprehensive insights, it's advisable to review the specific contents or supplementary materials provided to ascertain if additional resources or data are available.
14. How can I stay updated on further developments or reports in the NDT Industry?
To stay informed about further developments, trends, and reports in the NDT Industry, consider subscribing to industry newsletters, following relevant companies and organizations, or regularly checking reputable industry news sources and publications.
Methodology
Step 1 - Identification of Relevant Samples Size from Population Database


Step 2 - Approaches for Defining Global Market Size (Value, Volume* & Price*)

Note*: In applicable scenarios
Step 3 - Data Sources
Primary Research
- Web Analytics
- Survey Reports
- Research Institute
- Latest Research Reports
- Opinion Leaders
Secondary Research
- Annual Reports
- White Paper
- Latest Press Release
- Industry Association
- Paid Database
- Investor Presentations

Step 4 - Data Triangulation
Involves using different sources of information in order to increase the validity of a study
These sources are likely to be stakeholders in a program - participants, other researchers, program staff, other community members, and so on.
Then we put all data in single framework & apply various statistical tools to find out the dynamic on the market.
During the analysis stage, feedback from the stakeholder groups would be compared to determine areas of agreement as well as areas of divergence