

Key Insights
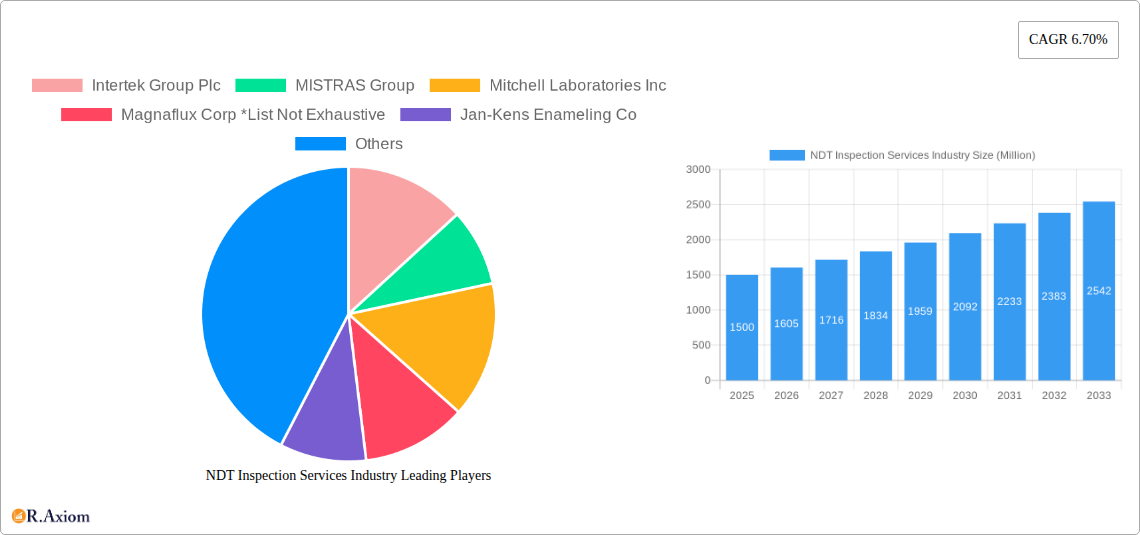
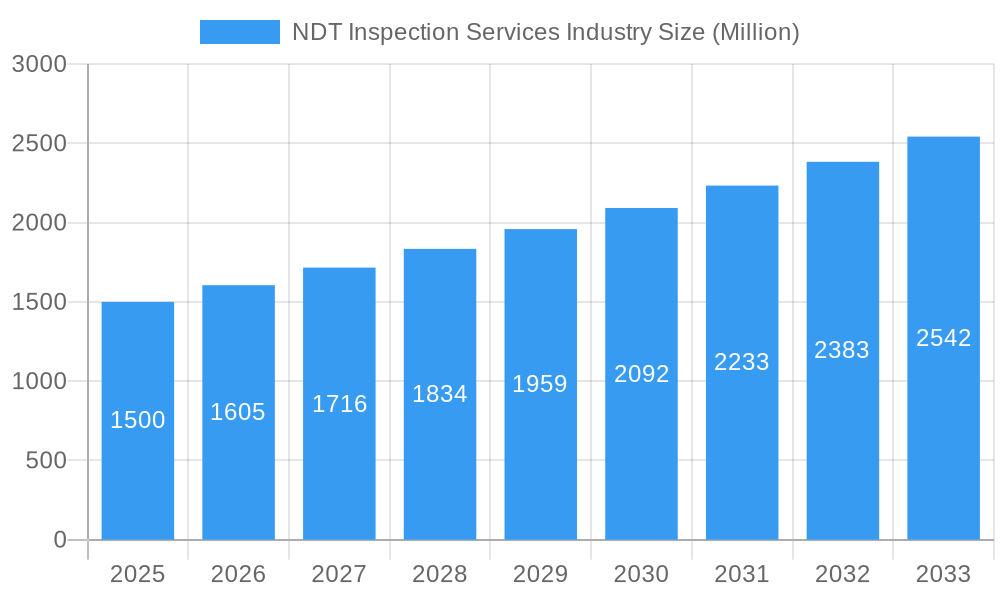
The NDT Inspection Services market, valued at approximately $XX million in 2025, is projected to experience robust growth, exhibiting a Compound Annual Growth Rate (CAGR) of 6.70% from 2025 to 2033. This expansion is fueled by several key drivers. The increasing demand for infrastructure development across various sectors like oil and gas, aerospace and defense, and construction necessitates rigorous quality control and safety measures, significantly boosting the need for non-destructive testing (NDT) services. Furthermore, stringent regulatory compliance standards in these industries mandate regular inspections, underpinning the market's growth trajectory. Advancements in NDT technologies, such as the adoption of advanced imaging techniques and automated inspection systems, are enhancing inspection efficiency and accuracy, further stimulating market expansion. The growing awareness of preventative maintenance and its cost-effectiveness compared to reactive repairs also contributes to market growth. While potential restraints like the cyclical nature of certain end-user industries and fluctuating commodity prices might pose challenges, the overall market outlook remains positive.
NDT Inspection Services Industry Market Size (In Billion)
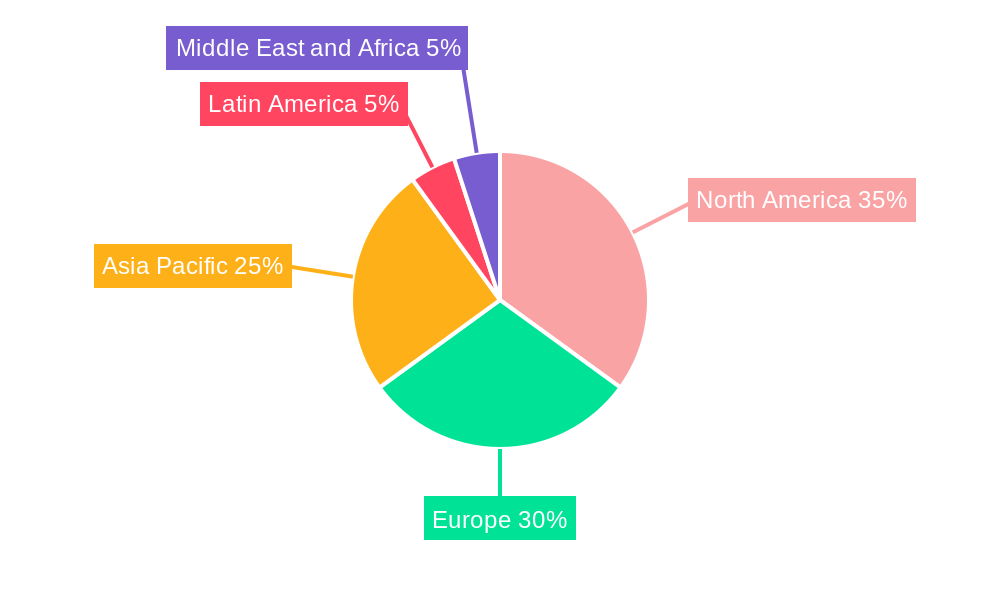
Segment-wise, radiography and ultrasonic testing currently dominate the testing technology segment due to their versatility and established market presence. However, the magnetic particle and liquid penetrant testing segments are anticipated to witness notable growth, driven by their suitability for specific applications and cost-effectiveness. Geographically, North America and Europe currently hold substantial market shares, owing to the presence of established industries and stringent regulatory frameworks. However, the Asia-Pacific region is poised for significant growth, propelled by rapid industrialization and infrastructure development in countries like China and India. Key players like Intertek Group Plc, MISTRAS Group, and Olympus Corporation are leveraging technological advancements and strategic acquisitions to maintain their market positions and capitalize on emerging opportunities. The competitive landscape is characterized by both established players and specialized NDT service providers, leading to innovation and service diversification.
NDT Inspection Services Industry Company Market Share
NDT Inspection Services Industry: A Comprehensive Market Report (2019-2033)
This detailed report provides a comprehensive analysis of the NDT Inspection Services industry, offering invaluable insights for stakeholders, investors, and industry professionals. The study covers the period from 2019 to 2033, with a focus on the forecast period of 2025-2033 and a base year of 2025. The report projects a market valued at $xx Million in 2025, with a Compound Annual Growth Rate (CAGR) of xx% during the forecast period.
NDT Inspection Services Industry Market Concentration & Innovation
The NDT inspection services market exhibits a moderately concentrated landscape, with several large players commanding significant market share. Intertek Group Plc, MISTRAS Group, and Applus Services S.A. are among the leading companies, each holding a substantial portion of the global market. However, the market also features a number of smaller, specialized firms catering to niche segments. The market share of the top 5 players is estimated at xx%. Mergers and acquisitions (M&A) activity has played a significant role in shaping the market structure, with deal values totaling $xx Million in the last five years. Innovation is driven by technological advancements, including improved sensor technology, AI-powered data analysis, and the development of more efficient and portable inspection equipment.
- Market Concentration: Top 5 players hold xx% market share.
- M&A Activity: $xx Million in deal value over the past 5 years.
- Innovation Drivers: Advanced sensor technology, AI-powered data analysis, portable inspection equipment.
- Regulatory Frameworks: Stringent safety and quality regulations drive adoption of NDT methods.
- Product Substitutes: Limited direct substitutes; however, alternative inspection methods exist depending on the application.
- End-User Trends: Increasing demand for non-destructive testing in high-stakes industries.
NDT Inspection Services Industry Industry Trends & Insights
The NDT inspection services market is experiencing robust growth, fueled by increasing demand from various end-user industries. The rising adoption of stringent safety regulations across sectors, especially in oil & gas, aerospace & defense, and power & energy, is a key driver. Technological advancements are also significantly impacting the market, with the adoption of automated inspection systems and advanced data analytics leading to increased efficiency and accuracy. The market is witnessing a shift towards remote inspection technologies and cloud-based data management platforms, improving accessibility and reducing operational costs. The competitive landscape is dynamic, with established players focusing on strategic acquisitions and technological innovation to maintain their market position. The market penetration of advanced NDT techniques is increasing steadily, particularly in emerging economies.
Dominant Markets & Segments in NDT Inspection Services Industry
The Oil and Gas sector remains the dominant end-user industry for NDT inspection services, driven by the need for rigorous safety standards and preventative maintenance in high-risk environments. The Aerospace and Defense sector represents another significant market, with stringent quality control requirements for aircraft and defense systems. Ultrasonic testing technology holds the largest market share among testing methods, thanks to its versatility and applicability across various materials and applications. North America and Europe represent the largest regional markets, although rapid industrialization in Asia-Pacific is driving substantial growth in this region.
- Dominant End-User: Oil and Gas.
- Dominant Testing Technology: Ultrasonic.
- Dominant Region: North America.
- Key Drivers (Oil & Gas): Stringent safety regulations, aging infrastructure requiring maintenance.
- Key Drivers (Aerospace & Defense): Stringent quality standards for aircraft and defense systems.
- Key Drivers (Asia-Pacific): Rapid industrialization and infrastructure development.
NDT Inspection Services Industry Product Developments
Recent product innovations have focused on improving the portability, efficiency, and data analysis capabilities of NDT equipment. The integration of AI and machine learning is enhancing the accuracy and speed of defect detection. New technologies, like phased array ultrasonic testing (PAUT) and advanced electromagnetic inspection techniques, are gaining traction due to their improved sensitivity and resolution. These advancements provide competitive advantages by improving efficiency, reducing inspection times, and enhancing the accuracy of defect identification.
Report Scope & Segmentation Analysis
This report segments the NDT inspection services market by testing technology (Radiography, Ultrasonic, Magnetic Particle, Liquid Penetrant, Visual Inspection) and end-user industry (Oil and Gas, Aerospace and Defense, Power and Energy, Construction, Automotive and Transportation, Other). Each segment is analyzed in detail, offering insights into growth projections, market size, and competitive dynamics. For instance, the ultrasonic testing segment is projected to experience significant growth due to its wide applicability, while the oil and gas end-user segment is anticipated to remain the largest market segment.
Key Drivers of NDT Inspection Services Industry Growth
The NDT inspection services market is driven by several factors, including: increasing demand from end-user industries due to stringent safety regulations; technological advancements leading to improved inspection efficiency and accuracy; and growing awareness of the importance of preventative maintenance. Government initiatives promoting infrastructure development also contribute significantly to market growth.
Challenges in the NDT Inspection Services Industry Sector
The NDT inspection services industry faces several challenges, including intense competition, high initial investment costs for advanced technologies, skilled labor shortages, and the need to comply with stringent safety regulations. Supply chain disruptions can also affect the availability and cost of essential components, impacting profitability.
Emerging Opportunities in NDT Inspection Services Industry
Emerging opportunities lie in the adoption of advanced technologies like AI and machine learning for data analysis, the development of more portable and user-friendly inspection equipment, and the expansion into new and emerging markets in developing economies. The growing demand for remote inspection services also presents a significant opportunity for market expansion.
Leading Players in the NDT Inspection Services Industry Market
- Intertek Group Plc
- MISTRAS Group
- Mitchell Laboratories Inc
- Magnaflux Corp
- Jan-Kens Enameling Co
- GE Measurement and Control Company (Baker & Hughes Company)
- LynX Inspection Inc
- Olympus Corporation
- Acuren Inspection Inc
- Applus Services S.A.
Key Developments in NDT Inspection Services Industry Industry
- 2023-Q3: MISTRAS Group launched a new AI-powered defect detection software.
- 2022-Q4: Applus Services acquired a smaller NDT inspection company, expanding its market presence.
- 2021-Q2: Intertek invested in the development of a new robotic inspection system for pipeline inspections. (Further developments will be included in the full report)
Strategic Outlook for NDT Inspection Services Industry Market
The NDT inspection services market is poised for continued growth, driven by technological innovation, increasing demand from key end-user industries, and expanding regulations. The adoption of advanced technologies, such as AI and automation, will play a significant role in shaping the future of the market. Companies that can successfully adapt to technological advancements and customer needs are likely to gain a competitive advantage in this dynamic and growing market.
NDT Inspection Services Industry Segmentation
-
1. Testing Technology
- 1.1. Radiography
- 1.2. Ultrasonic
- 1.3. Magnetic Particle
- 1.4. Liquid Penetrant
- 1.5. Visual Inspection
-
2. End-user Industry
- 2.1. Oil and Gas
- 2.2. Aerospace and Defense
- 2.3. Power and Energy
- 2.4. Construction
- 2.5. Automotive and Transportation
- 2.6. Other End-user Industries
NDT Inspection Services Industry Segmentation By Geography
-
1. North America
- 1.1. United States
- 1.2. Canada
-
2. Europe
- 2.1. United Kingdom
- 2.2. Germany
- 2.3. France
- 2.4. Rest of Europe
-
3. Asia Pacific
- 3.1. China
- 3.2. Japan
- 3.3. India
- 3.4. Rest of Asia Pacific
- 4. Latin America
- 5. Middle East and Africa
NDT Inspection Services Industry Regional Market Share
Geographic Coverage of NDT Inspection Services Industry
NDT Inspection Services Industry REPORT HIGHLIGHTS
| Aspects | Details |
|---|---|
| Study Period | 2020-2034 |
| Base Year | 2025 |
| Estimated Year | 2026 |
| Forecast Period | 2026-2034 |
| Historical Period | 2020-2025 |
| Growth Rate | CAGR of 6.5% from 2020-2034 |
| Segmentation |
|
Table of Contents
- 1. Introduction
- 1.1. Research Scope
- 1.2. Market Segmentation
- 1.3. Research Objective
- 1.4. Definitions and Assumptions
- 2. Executive Summary
- 2.1. Market Snapshot
- 3. Market Dynamics
- 3.1. Market Drivers
- 3.2. Market Restrains
- 3.3. Market Trends
- 3.4. Market Opportunities
- 4. Market Factor Analysis
- 4.1. Porters Five Forces
- 4.1.1. Bargaining Power of Suppliers
- 4.1.2. Bargaining Power of Buyers
- 4.1.3. Threat of New Entrants
- 4.1.4. Threat of Substitutes
- 4.1.5. Competitive Rivalry
- 4.2. PESTEL analysis
- 4.3. BCG Analysis
- 4.3.1. Stars (High Growth, High Market Share)
- 4.3.2. Cash Cows (Low Growth, High Market Share)
- 4.3.3. Question Mark (High Growth, Low Market Share)
- 4.3.4. Dogs (Low Growth, Low Market Share)
- 4.4. Ansoff Matrix Analysis
- 4.5. Supply Chain Analysis
- 4.6. Regulatory Landscape
- 4.7. Current Market Potential and Opportunity Assessment (TAM–SAM–SOM Framework)
- 4.8. RAX Analyst Note
- 4.1. Porters Five Forces
- 5. Market Analysis, Insights and Forecast 2021-2033
- 5.1. Market Analysis, Insights and Forecast - by Testing Technology
- 5.1.1. Radiography
- 5.1.2. Ultrasonic
- 5.1.3. Magnetic Particle
- 5.1.4. Liquid Penetrant
- 5.1.5. Visual Inspection
- 5.2. Market Analysis, Insights and Forecast - by End-user Industry
- 5.2.1. Oil and Gas
- 5.2.2. Aerospace and Defense
- 5.2.3. Power and Energy
- 5.2.4. Construction
- 5.2.5. Automotive and Transportation
- 5.2.6. Other End-user Industries
- 5.3. Market Analysis, Insights and Forecast - by Region
- 5.3.1. North America
- 5.3.2. Europe
- 5.3.3. Asia Pacific
- 5.3.4. Latin America
- 5.3.5. Middle East and Africa
- 5.1. Market Analysis, Insights and Forecast - by Testing Technology
- 6. Global NDT Inspection Services Industry Analysis, Insights and Forecast, 2021-2033
- 6.1. Market Analysis, Insights and Forecast - by Testing Technology
- 6.1.1. Radiography
- 6.1.2. Ultrasonic
- 6.1.3. Magnetic Particle
- 6.1.4. Liquid Penetrant
- 6.1.5. Visual Inspection
- 6.2. Market Analysis, Insights and Forecast - by End-user Industry
- 6.2.1. Oil and Gas
- 6.2.2. Aerospace and Defense
- 6.2.3. Power and Energy
- 6.2.4. Construction
- 6.2.5. Automotive and Transportation
- 6.2.6. Other End-user Industries
- 6.1. Market Analysis, Insights and Forecast - by Testing Technology
- 7. North America NDT Inspection Services Industry Analysis, Insights and Forecast, 2020-2032
- 7.1. Market Analysis, Insights and Forecast - by Testing Technology
- 7.1.1. Radiography
- 7.1.2. Ultrasonic
- 7.1.3. Magnetic Particle
- 7.1.4. Liquid Penetrant
- 7.1.5. Visual Inspection
- 7.2. Market Analysis, Insights and Forecast - by End-user Industry
- 7.2.1. Oil and Gas
- 7.2.2. Aerospace and Defense
- 7.2.3. Power and Energy
- 7.2.4. Construction
- 7.2.5. Automotive and Transportation
- 7.2.6. Other End-user Industries
- 7.1. Market Analysis, Insights and Forecast - by Testing Technology
- 8. Europe NDT Inspection Services Industry Analysis, Insights and Forecast, 2020-2032
- 8.1. Market Analysis, Insights and Forecast - by Testing Technology
- 8.1.1. Radiography
- 8.1.2. Ultrasonic
- 8.1.3. Magnetic Particle
- 8.1.4. Liquid Penetrant
- 8.1.5. Visual Inspection
- 8.2. Market Analysis, Insights and Forecast - by End-user Industry
- 8.2.1. Oil and Gas
- 8.2.2. Aerospace and Defense
- 8.2.3. Power and Energy
- 8.2.4. Construction
- 8.2.5. Automotive and Transportation
- 8.2.6. Other End-user Industries
- 8.1. Market Analysis, Insights and Forecast - by Testing Technology
- 9. Asia Pacific NDT Inspection Services Industry Analysis, Insights and Forecast, 2020-2032
- 9.1. Market Analysis, Insights and Forecast - by Testing Technology
- 9.1.1. Radiography
- 9.1.2. Ultrasonic
- 9.1.3. Magnetic Particle
- 9.1.4. Liquid Penetrant
- 9.1.5. Visual Inspection
- 9.2. Market Analysis, Insights and Forecast - by End-user Industry
- 9.2.1. Oil and Gas
- 9.2.2. Aerospace and Defense
- 9.2.3. Power and Energy
- 9.2.4. Construction
- 9.2.5. Automotive and Transportation
- 9.2.6. Other End-user Industries
- 9.1. Market Analysis, Insights and Forecast - by Testing Technology
- 10. Latin America NDT Inspection Services Industry Analysis, Insights and Forecast, 2020-2032
- 10.1. Market Analysis, Insights and Forecast - by Testing Technology
- 10.1.1. Radiography
- 10.1.2. Ultrasonic
- 10.1.3. Magnetic Particle
- 10.1.4. Liquid Penetrant
- 10.1.5. Visual Inspection
- 10.2. Market Analysis, Insights and Forecast - by End-user Industry
- 10.2.1. Oil and Gas
- 10.2.2. Aerospace and Defense
- 10.2.3. Power and Energy
- 10.2.4. Construction
- 10.2.5. Automotive and Transportation
- 10.2.6. Other End-user Industries
- 10.1. Market Analysis, Insights and Forecast - by Testing Technology
- 11. Middle East and Africa NDT Inspection Services Industry Analysis, Insights and Forecast, 2020-2032
- 11.1. Market Analysis, Insights and Forecast - by Testing Technology
- 11.1.1. Radiography
- 11.1.2. Ultrasonic
- 11.1.3. Magnetic Particle
- 11.1.4. Liquid Penetrant
- 11.1.5. Visual Inspection
- 11.2. Market Analysis, Insights and Forecast - by End-user Industry
- 11.2.1. Oil and Gas
- 11.2.2. Aerospace and Defense
- 11.2.3. Power and Energy
- 11.2.4. Construction
- 11.2.5. Automotive and Transportation
- 11.2.6. Other End-user Industries
- 11.1. Market Analysis, Insights and Forecast - by Testing Technology
- 12. Competitive Analysis
- 12.1. Company Profiles
- 12.1.1 Intertek Group Plc
- 12.1.1.1. Company Overview
- 12.1.1.2. Products
- 12.1.1.3. Company Financials
- 12.1.1.4. SWOT Analysis
- 12.1.2 MISTRAS Group
- 12.1.2.1. Company Overview
- 12.1.2.2. Products
- 12.1.2.3. Company Financials
- 12.1.2.4. SWOT Analysis
- 12.1.3 Mitchell Laboratories Inc
- 12.1.3.1. Company Overview
- 12.1.3.2. Products
- 12.1.3.3. Company Financials
- 12.1.3.4. SWOT Analysis
- 12.1.4 Magnaflux Corp *List Not Exhaustive
- 12.1.4.1. Company Overview
- 12.1.4.2. Products
- 12.1.4.3. Company Financials
- 12.1.4.4. SWOT Analysis
- 12.1.5 Jan-Kens Enameling Co
- 12.1.5.1. Company Overview
- 12.1.5.2. Products
- 12.1.5.3. Company Financials
- 12.1.5.4. SWOT Analysis
- 12.1.6 GE Measurement and Control Company (Baker & Hughes Company)
- 12.1.6.1. Company Overview
- 12.1.6.2. Products
- 12.1.6.3. Company Financials
- 12.1.6.4. SWOT Analysis
- 12.1.7 LynX Inspection Inc
- 12.1.7.1. Company Overview
- 12.1.7.2. Products
- 12.1.7.3. Company Financials
- 12.1.7.4. SWOT Analysis
- 12.1.8 Olympus Corporation
- 12.1.8.1. Company Overview
- 12.1.8.2. Products
- 12.1.8.3. Company Financials
- 12.1.8.4. SWOT Analysis
- 12.1.9 Acuren Inspection Inc
- 12.1.9.1. Company Overview
- 12.1.9.2. Products
- 12.1.9.3. Company Financials
- 12.1.9.4. SWOT Analysis
- 12.1.10 Applus Services S A
- 12.1.10.1. Company Overview
- 12.1.10.2. Products
- 12.1.10.3. Company Financials
- 12.1.10.4. SWOT Analysis
- 12.1.1 Intertek Group Plc
- 12.2. Market Entropy
- 12.2.1 Company's Key Areas Served
- 12.2.2 Recent Developments
- 12.3. Company Market Share Analysis 2025
- 12.3.1 Top 5 Companies Market Share Analysis
- 12.3.2 Top 3 Companies Market Share Analysis
- 12.4. List of Potential Customers
- 13. Research Methodology
List of Figures
- Figure 1: Global NDT Inspection Services Industry Revenue Breakdown (billion, %) by Region 2025 & 2033
- Figure 2: North America NDT Inspection Services Industry Revenue (billion), by Testing Technology 2025 & 2033
- Figure 3: North America NDT Inspection Services Industry Revenue Share (%), by Testing Technology 2025 & 2033
- Figure 4: North America NDT Inspection Services Industry Revenue (billion), by End-user Industry 2025 & 2033
- Figure 5: North America NDT Inspection Services Industry Revenue Share (%), by End-user Industry 2025 & 2033
- Figure 6: North America NDT Inspection Services Industry Revenue (billion), by Country 2025 & 2033
- Figure 7: North America NDT Inspection Services Industry Revenue Share (%), by Country 2025 & 2033
- Figure 8: Europe NDT Inspection Services Industry Revenue (billion), by Testing Technology 2025 & 2033
- Figure 9: Europe NDT Inspection Services Industry Revenue Share (%), by Testing Technology 2025 & 2033
- Figure 10: Europe NDT Inspection Services Industry Revenue (billion), by End-user Industry 2025 & 2033
- Figure 11: Europe NDT Inspection Services Industry Revenue Share (%), by End-user Industry 2025 & 2033
- Figure 12: Europe NDT Inspection Services Industry Revenue (billion), by Country 2025 & 2033
- Figure 13: Europe NDT Inspection Services Industry Revenue Share (%), by Country 2025 & 2033
- Figure 14: Asia Pacific NDT Inspection Services Industry Revenue (billion), by Testing Technology 2025 & 2033
- Figure 15: Asia Pacific NDT Inspection Services Industry Revenue Share (%), by Testing Technology 2025 & 2033
- Figure 16: Asia Pacific NDT Inspection Services Industry Revenue (billion), by End-user Industry 2025 & 2033
- Figure 17: Asia Pacific NDT Inspection Services Industry Revenue Share (%), by End-user Industry 2025 & 2033
- Figure 18: Asia Pacific NDT Inspection Services Industry Revenue (billion), by Country 2025 & 2033
- Figure 19: Asia Pacific NDT Inspection Services Industry Revenue Share (%), by Country 2025 & 2033
- Figure 20: Latin America NDT Inspection Services Industry Revenue (billion), by Testing Technology 2025 & 2033
- Figure 21: Latin America NDT Inspection Services Industry Revenue Share (%), by Testing Technology 2025 & 2033
- Figure 22: Latin America NDT Inspection Services Industry Revenue (billion), by End-user Industry 2025 & 2033
- Figure 23: Latin America NDT Inspection Services Industry Revenue Share (%), by End-user Industry 2025 & 2033
- Figure 24: Latin America NDT Inspection Services Industry Revenue (billion), by Country 2025 & 2033
- Figure 25: Latin America NDT Inspection Services Industry Revenue Share (%), by Country 2025 & 2033
- Figure 26: Middle East and Africa NDT Inspection Services Industry Revenue (billion), by Testing Technology 2025 & 2033
- Figure 27: Middle East and Africa NDT Inspection Services Industry Revenue Share (%), by Testing Technology 2025 & 2033
- Figure 28: Middle East and Africa NDT Inspection Services Industry Revenue (billion), by End-user Industry 2025 & 2033
- Figure 29: Middle East and Africa NDT Inspection Services Industry Revenue Share (%), by End-user Industry 2025 & 2033
- Figure 30: Middle East and Africa NDT Inspection Services Industry Revenue (billion), by Country 2025 & 2033
- Figure 31: Middle East and Africa NDT Inspection Services Industry Revenue Share (%), by Country 2025 & 2033
List of Tables
- Table 1: Global NDT Inspection Services Industry Revenue billion Forecast, by Testing Technology 2020 & 2033
- Table 2: Global NDT Inspection Services Industry Revenue billion Forecast, by End-user Industry 2020 & 2033
- Table 3: Global NDT Inspection Services Industry Revenue billion Forecast, by Region 2020 & 2033
- Table 4: Global NDT Inspection Services Industry Revenue billion Forecast, by Testing Technology 2020 & 2033
- Table 5: Global NDT Inspection Services Industry Revenue billion Forecast, by End-user Industry 2020 & 2033
- Table 6: Global NDT Inspection Services Industry Revenue billion Forecast, by Country 2020 & 2033
- Table 7: United States NDT Inspection Services Industry Revenue (billion) Forecast, by Application 2020 & 2033
- Table 8: Canada NDT Inspection Services Industry Revenue (billion) Forecast, by Application 2020 & 2033
- Table 9: Global NDT Inspection Services Industry Revenue billion Forecast, by Testing Technology 2020 & 2033
- Table 10: Global NDT Inspection Services Industry Revenue billion Forecast, by End-user Industry 2020 & 2033
- Table 11: Global NDT Inspection Services Industry Revenue billion Forecast, by Country 2020 & 2033
- Table 12: United Kingdom NDT Inspection Services Industry Revenue (billion) Forecast, by Application 2020 & 2033
- Table 13: Germany NDT Inspection Services Industry Revenue (billion) Forecast, by Application 2020 & 2033
- Table 14: France NDT Inspection Services Industry Revenue (billion) Forecast, by Application 2020 & 2033
- Table 15: Rest of Europe NDT Inspection Services Industry Revenue (billion) Forecast, by Application 2020 & 2033
- Table 16: Global NDT Inspection Services Industry Revenue billion Forecast, by Testing Technology 2020 & 2033
- Table 17: Global NDT Inspection Services Industry Revenue billion Forecast, by End-user Industry 2020 & 2033
- Table 18: Global NDT Inspection Services Industry Revenue billion Forecast, by Country 2020 & 2033
- Table 19: China NDT Inspection Services Industry Revenue (billion) Forecast, by Application 2020 & 2033
- Table 20: Japan NDT Inspection Services Industry Revenue (billion) Forecast, by Application 2020 & 2033
- Table 21: India NDT Inspection Services Industry Revenue (billion) Forecast, by Application 2020 & 2033
- Table 22: Rest of Asia Pacific NDT Inspection Services Industry Revenue (billion) Forecast, by Application 2020 & 2033
- Table 23: Global NDT Inspection Services Industry Revenue billion Forecast, by Testing Technology 2020 & 2033
- Table 24: Global NDT Inspection Services Industry Revenue billion Forecast, by End-user Industry 2020 & 2033
- Table 25: Global NDT Inspection Services Industry Revenue billion Forecast, by Country 2020 & 2033
- Table 26: Global NDT Inspection Services Industry Revenue billion Forecast, by Testing Technology 2020 & 2033
- Table 27: Global NDT Inspection Services Industry Revenue billion Forecast, by End-user Industry 2020 & 2033
- Table 28: Global NDT Inspection Services Industry Revenue billion Forecast, by Country 2020 & 2033
Frequently Asked Questions
1. What is the projected Compound Annual Growth Rate (CAGR) of the NDT Inspection Services Industry?
The projected CAGR is approximately 6.5%.
2. Which companies are prominent players in the NDT Inspection Services Industry?
Key companies in the market include Intertek Group Plc, MISTRAS Group, Mitchell Laboratories Inc, Magnaflux Corp *List Not Exhaustive, Jan-Kens Enameling Co, GE Measurement and Control Company (Baker & Hughes Company), LynX Inspection Inc, Olympus Corporation, Acuren Inspection Inc, Applus Services S A.
3. What are the main segments of the NDT Inspection Services Industry?
The market segments include Testing Technology, End-user Industry.
4. Can you provide details about the market size?
The market size is estimated to be USD 18.17 billion as of 2022.
5. What are some drivers contributing to market growth?
; Stringent Regulations Mandating Safety Standards; Innovation and Advancement in NDT Inspection Technology; Lack of Skilled Personnel and Training Facilities.
6. What are the notable trends driving market growth?
Aerospace Industry is Expected to Account for a Major Share of the Market.
7. Are there any restraints impacting market growth?
; Reluctance to Adopt NDT Techniques.
8. Can you provide examples of recent developments in the market?
N/A
9. What pricing options are available for accessing the report?
Pricing options include single-user, multi-user, and enterprise licenses priced at USD 4750, USD 5250, and USD 8750 respectively.
10. Is the market size provided in terms of value or volume?
The market size is provided in terms of value, measured in billion.
11. Are there any specific market keywords associated with the report?
Yes, the market keyword associated with the report is "NDT Inspection Services Industry," which aids in identifying and referencing the specific market segment covered.
12. How do I determine which pricing option suits my needs best?
The pricing options vary based on user requirements and access needs. Individual users may opt for single-user licenses, while businesses requiring broader access may choose multi-user or enterprise licenses for cost-effective access to the report.
13. Are there any additional resources or data provided in the NDT Inspection Services Industry report?
While the report offers comprehensive insights, it's advisable to review the specific contents or supplementary materials provided to ascertain if additional resources or data are available.
14. How can I stay updated on further developments or reports in the NDT Inspection Services Industry?
To stay informed about further developments, trends, and reports in the NDT Inspection Services Industry, consider subscribing to industry newsletters, following relevant companies and organizations, or regularly checking reputable industry news sources and publications.
Methodology
Step 1 - Identification of Relevant Samples Size from Population Database


Step 2 - Approaches for Defining Global Market Size (Value, Volume* & Price*)

Note*: In applicable scenarios
Step 3 - Data Sources
Primary Research
- Web Analytics
- Survey Reports
- Research Institute
- Latest Research Reports
- Opinion Leaders
Secondary Research
- Annual Reports
- White Paper
- Latest Press Release
- Industry Association
- Paid Database
- Investor Presentations

Step 4 - Data Triangulation
Involves using different sources of information in order to increase the validity of a study
These sources are likely to be stakeholders in a program - participants, other researchers, program staff, other community members, and so on.
Then we put all data in single framework & apply various statistical tools to find out the dynamic on the market.
During the analysis stage, feedback from the stakeholder groups would be compared to determine areas of agreement as well as areas of divergence