
Key Insights
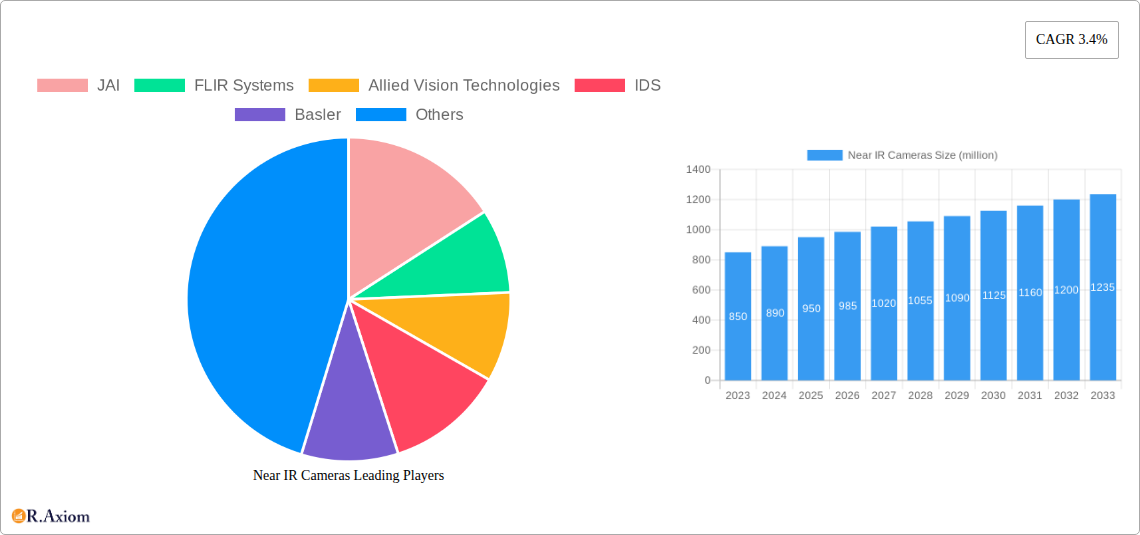
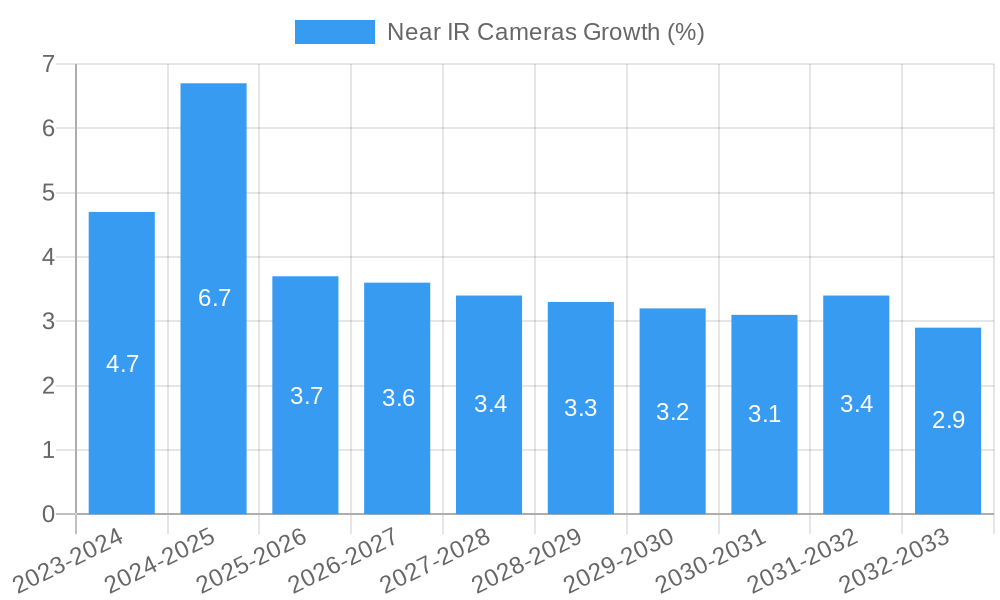
The global Near Infrared (NIR) Camera market is poised for significant expansion, projected to reach an impressive market size of $950 million by 2025, with a robust Compound Annual Growth Rate (CAGR) of 3.4% anticipated throughout the forecast period. This growth is propelled by an increasing demand for advanced imaging solutions across a multitude of industries, including manufacturing, agriculture, and security. The inherent ability of NIR cameras to capture spectral information beyond the visible spectrum allows for enhanced material inspection, quality control, and identification of subtle variations that are invisible to conventional cameras. Key applications driving this upward trajectory include sophisticated industrial automation, precise measurement and detection systems, and specialized applications requiring non-invasive analysis. The rising adoption of Industry 4.0 principles, coupled with the growing need for efficient and accurate diagnostic tools, further solidifies the market's positive outlook.
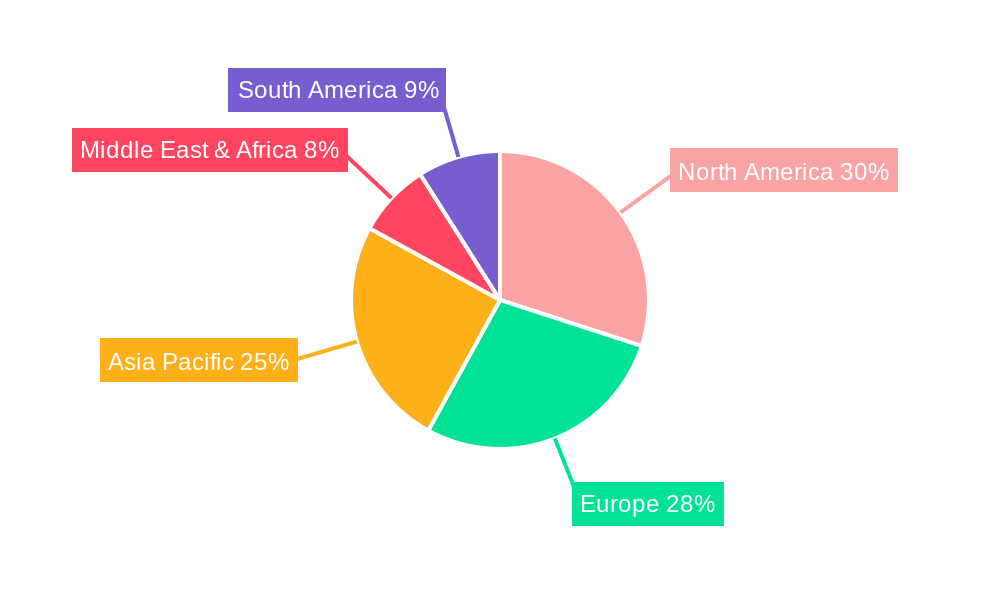
The market's dynamism is further shaped by evolving technological advancements and emerging application areas. Innovations in sensor technology, such as improvements in CCD and CMOS NIR cameras, are leading to higher resolutions, enhanced sensitivity, and more compact designs, making these cameras more accessible and versatile. While the market benefits from strong demand, potential restraints such as the high initial cost of advanced systems and the need for specialized expertise in data interpretation could pose challenges. However, strategic collaborations between technology providers and end-users, alongside ongoing research and development, are expected to mitigate these restraints. Geographically, North America and Europe currently lead in market adoption due to their established industrial bases and significant investments in R&D. The Asia Pacific region, however, is emerging as a high-growth market, driven by rapid industrialization and increasing adoption of automation and smart manufacturing technologies.
This comprehensive report offers an in-depth analysis of the global Near IR Cameras market, providing essential insights for stakeholders seeking to navigate this dynamic sector. With a study period spanning from 2019 to 2033, this report leverages historical data, current market conditions (base year 2025), and robust forecast projections to deliver actionable intelligence.
Near IR Cameras Market Concentration & Innovation
The Near IR Cameras market exhibits a moderate level of concentration, with key players like JAI, FLIR Systems, and Allied Vision Technologies holding significant market share, estimated to be over 30% combined. Innovation remains a primary driver, fueled by advancements in sensor technology and the increasing demand for high-resolution imaging in specialized applications. Regulatory frameworks, particularly concerning industrial automation and safety standards, are also shaping product development and market entry. Product substitutes, such as thermal imaging cameras in specific scenarios, present a competitive challenge, though the unique capabilities of Near IR cameras continue to secure their market position. End-user trends point towards a growing preference for miniaturized, power-efficient, and AI-integrated camera solutions. Mergers and acquisitions (M&A) activities, with estimated deal values in the tens of millions, are expected to continue as companies seek to expand their product portfolios and market reach.
Near IR Cameras Industry Trends & Insights
The Near IR Cameras market is poised for substantial growth, driven by several key factors. The increasing adoption of automation across various industries, including manufacturing, agriculture, and pharmaceuticals, is a primary growth catalyst. As industries seek to improve quality control, streamline processes, and enhance safety, the demand for sophisticated imaging solutions like Near IR cameras escalates. Technological disruptions, such as the transition from CCD to CMOS sensor technology, are enhancing camera performance, offering higher frame rates, lower power consumption, and improved image quality. This transition is crucial for developing more compact and versatile Near IR camera systems. Consumer preferences are evolving, with a growing demand for cameras that offer enhanced spectral capabilities, increased sensitivity, and seamless integration with existing systems. Furthermore, the expanding applications in areas like remote sensing, medical diagnostics, and food inspection are contributing significantly to market penetration. The competitive landscape is characterized by ongoing product development and strategic partnerships, with companies striving to differentiate themselves through superior imaging performance and specialized features. The projected Compound Annual Growth Rate (CAGR) for the Near IR Cameras market is estimated to be approximately 9.5% over the forecast period of 2025–2033. Market penetration is expected to rise from around 15% in 2024 to an estimated 35% by 2033, indicating a significant expansion of its adoption across diverse sectors.
Dominant Markets & Segments in Near IR Cameras
The Industry application segment is anticipated to remain the dominant market for Near IR cameras, driven by the burgeoning demand for automation, quality inspection, and process monitoring in manufacturing facilities worldwide. Economic policies promoting industrial digitization and infrastructure development in emerging economies are further bolstering this segment. Within this segment, key drivers include the need for:
- Enhanced Quality Control: Near IR cameras enable the detection of subtle surface defects, material variations, and foreign object contamination that are invisible to the human eye or standard visible light cameras. This is crucial in industries like automotive, electronics, and food and beverage.
- Process Optimization: Real-time monitoring of manufacturing processes, such as drying, coating, and chemical reactions, using Near IR spectroscopy allows for precise control and optimization, leading to increased efficiency and reduced waste.
- Safety and Security: Applications in surveillance, perimeter security, and obstacle detection in challenging lighting conditions benefit from the unique imaging capabilities of Near IR cameras.
The CMOS NIR Cameras type segment is expected to witness the most rapid growth, outpacing traditional CCD NIR cameras. This is due to the inherent advantages of CMOS technology, including:
- Higher Frame Rates and Lower Power Consumption: Enabling faster data acquisition and more portable, battery-operated systems.
- Improved Image Quality and Flexibility: Offering better low-light performance and wider dynamic range.
- Cost-Effectiveness: As CMOS manufacturing processes mature, the cost of these cameras is becoming increasingly competitive.
Regionally, North America and Europe are projected to maintain their dominance due to the strong presence of advanced manufacturing industries, robust R&D investments, and stringent quality control regulations. However, the Asia-Pacific region is expected to exhibit the highest growth rate, fueled by rapid industrialization, the expanding electronics manufacturing sector, and increasing government initiatives to promote smart manufacturing.
Near IR Cameras Product Developments
Recent product developments in the Near IR Cameras market are characterized by a focus on enhanced spectral resolution, improved sensitivity, and miniaturization. Companies are introducing cameras with wider spectral ranges and integrated data processing capabilities, enabling more sophisticated material identification and analysis. These innovations cater to growing applications in food inspection, pharmaceutical quality control, and agricultural monitoring, where precise identification and quantification of substances are critical. The competitive advantage lies in offering solutions that provide higher accuracy, faster processing speeds, and seamless integration into existing industrial automation systems.
Report Scope & Segmentation Analysis
This report meticulously analyzes the Near IR Cameras market across key segments.
Application Segments:
- Industry: This segment encompasses applications in manufacturing, pharmaceuticals, agriculture, and more, focusing on quality control, process monitoring, and automation. Growth projections indicate a significant expansion driven by industrial digitalization.
- Measurement & Detection: This includes spectroscopy, material analysis, and scientific research, where precise spectral measurements are paramount. Market sizes are expected to grow steadily with advancements in analytical instrumentation.
- Others: This category covers emerging applications in security, environmental monitoring, and consumer electronics. While smaller currently, this segment holds substantial growth potential.
Type Segments:
- CCD NIR Cameras: While established, this segment's growth is moderating as CMOS technology gains traction.
- CMOS NIR Cameras: This is the fastest-growing segment, driven by technological advancements and adoption in various industries. Market sizes are projected to surge due to superior performance and cost-effectiveness.
- Others: This includes specialized NIR camera types catering to niche applications.
Key Drivers of Near IR Cameras Growth
Several factors are propelling the growth of the Near IR Cameras market. Technologically, the continuous improvement in sensor sensitivity and spectral resolution allows for more accurate and nuanced imaging, enabling new applications. Economically, the global push towards Industry 4.0 and smart manufacturing necessitates advanced imaging solutions for automation and quality control, directly boosting demand. Regulatory factors, such as increased emphasis on product safety and traceability in industries like food and pharmaceuticals, further drive the adoption of Near IR cameras for verification and inspection purposes.
Challenges in the Near IR Cameras Sector
Despite robust growth, the Near IR Cameras sector faces several challenges. High initial investment costs for advanced imaging systems can be a barrier for smaller enterprises. Supply chain disruptions for specialized optical components can impact production timelines and costs. Furthermore, intense competition among established players and emerging entrants necessitates continuous innovation and competitive pricing strategies to maintain market share. The lack of widespread technical expertise in interpreting Near IR data can also limit adoption in certain sectors.
Emerging Opportunities in Near IR Cameras
Emerging opportunities in the Near IR Cameras market are abundant. The increasing demand for contactless inspection methods in sensitive industries presents a significant avenue. Advancements in AI and machine learning are enabling the development of smarter camera systems capable of real-time object recognition and anomaly detection. The growing applications in the healthcare sector, such as non-invasive diagnostics and drug analysis, offer substantial growth potential. Furthermore, the expansion of the agricultural technology sector, utilizing Near IR for crop health monitoring and yield prediction, is another promising area.
Leading Players in the Near IR Cameras Market
- JAI
- FLIR Systems
- Allied Vision Technologies
- IDS
- Basler
- HORIBA Scientific
- Lumenera
- QImaging
- Xenics
- Photonfocus
- Infrared Cameras
Key Developments in Near IR Cameras Industry
- 2024: Launch of new high-sensitivity CMOS NIR sensors by a leading manufacturer, enabling lower light detection for improved performance in challenging environments.
- 2023: Acquisition of a specialized NIR component supplier by a major camera manufacturer, aiming to strengthen its vertical integration and supply chain resilience.
- 2023: Introduction of an AI-powered NIR camera system for automated food inspection, demonstrating enhanced defect detection accuracy.
- 2022: Development of a compact, multi-spectral NIR camera module designed for integration into portable analytical devices.
- 2021: Significant investment in R&D for advanced spectral imaging technologies to expand applications in pharmaceutical quality control.
Strategic Outlook for Near IR Cameras Market
The strategic outlook for the Near IR Cameras market is highly positive. Continued technological advancements in sensor technology and data processing will unlock new application frontiers. The increasing focus on automation, quality assurance, and sustainability across industries will act as persistent growth catalysts. Companies that prioritize product innovation, strategic partnerships, and the development of integrated solutions will be well-positioned to capitalize on the expanding market opportunities and drive future growth. The robust demand from both established and emerging application areas ensures a sustained upward trajectory for the Near IR Cameras market.
Near IR Cameras Segmentation
-
1. Application
- 1.1. Industry
- 1.2. Measurement & Detection
- 1.3. Others
-
2. Types
- 2.1. CCD NIR Cameras
- 2.2. CMOS NIR Cameras
- 2.3. Others
Near IR Cameras Segmentation By Geography
-
1. North America
- 1.1. United States
- 1.2. Canada
- 1.3. Mexico
-
2. South America
- 2.1. Brazil
- 2.2. Argentina
- 2.3. Rest of South America
-
3. Europe
- 3.1. United Kingdom
- 3.2. Germany
- 3.3. France
- 3.4. Italy
- 3.5. Spain
- 3.6. Russia
- 3.7. Benelux
- 3.8. Nordics
- 3.9. Rest of Europe
-
4. Middle East & Africa
- 4.1. Turkey
- 4.2. Israel
- 4.3. GCC
- 4.4. North Africa
- 4.5. South Africa
- 4.6. Rest of Middle East & Africa
-
5. Asia Pacific
- 5.1. China
- 5.2. India
- 5.3. Japan
- 5.4. South Korea
- 5.5. ASEAN
- 5.6. Oceania
- 5.7. Rest of Asia Pacific
Near IR Cameras REPORT HIGHLIGHTS
| Aspects | Details |
|---|---|
| Study Period | 2019-2033 |
| Base Year | 2024 |
| Estimated Year | 2025 |
| Forecast Period | 2025-2033 |
| Historical Period | 2019-2024 |
| Growth Rate | CAGR of 3.4% from 2019-2033 |
| Segmentation |
|
Table of Contents
- 1. Introduction
- 1.1. Research Scope
- 1.2. Market Segmentation
- 1.3. Research Methodology
- 1.4. Definitions and Assumptions
- 2. Executive Summary
- 2.1. Introduction
- 3. Market Dynamics
- 3.1. Introduction
- 3.2. Market Drivers
- 3.3. Market Restrains
- 3.4. Market Trends
- 4. Market Factor Analysis
- 4.1. Porters Five Forces
- 4.2. Supply/Value Chain
- 4.3. PESTEL analysis
- 4.4. Market Entropy
- 4.5. Patent/Trademark Analysis
- 5. Global Near IR Cameras Analysis, Insights and Forecast, 2019-2031
- 5.1. Market Analysis, Insights and Forecast - by Application
- 5.1.1. Industry
- 5.1.2. Measurement & Detection
- 5.1.3. Others
- 5.2. Market Analysis, Insights and Forecast - by Types
- 5.2.1. CCD NIR Cameras
- 5.2.2. CMOS NIR Cameras
- 5.2.3. Others
- 5.3. Market Analysis, Insights and Forecast - by Region
- 5.3.1. North America
- 5.3.2. South America
- 5.3.3. Europe
- 5.3.4. Middle East & Africa
- 5.3.5. Asia Pacific
- 5.1. Market Analysis, Insights and Forecast - by Application
- 6. North America Near IR Cameras Analysis, Insights and Forecast, 2019-2031
- 6.1. Market Analysis, Insights and Forecast - by Application
- 6.1.1. Industry
- 6.1.2. Measurement & Detection
- 6.1.3. Others
- 6.2. Market Analysis, Insights and Forecast - by Types
- 6.2.1. CCD NIR Cameras
- 6.2.2. CMOS NIR Cameras
- 6.2.3. Others
- 6.1. Market Analysis, Insights and Forecast - by Application
- 7. South America Near IR Cameras Analysis, Insights and Forecast, 2019-2031
- 7.1. Market Analysis, Insights and Forecast - by Application
- 7.1.1. Industry
- 7.1.2. Measurement & Detection
- 7.1.3. Others
- 7.2. Market Analysis, Insights and Forecast - by Types
- 7.2.1. CCD NIR Cameras
- 7.2.2. CMOS NIR Cameras
- 7.2.3. Others
- 7.1. Market Analysis, Insights and Forecast - by Application
- 8. Europe Near IR Cameras Analysis, Insights and Forecast, 2019-2031
- 8.1. Market Analysis, Insights and Forecast - by Application
- 8.1.1. Industry
- 8.1.2. Measurement & Detection
- 8.1.3. Others
- 8.2. Market Analysis, Insights and Forecast - by Types
- 8.2.1. CCD NIR Cameras
- 8.2.2. CMOS NIR Cameras
- 8.2.3. Others
- 8.1. Market Analysis, Insights and Forecast - by Application
- 9. Middle East & Africa Near IR Cameras Analysis, Insights and Forecast, 2019-2031
- 9.1. Market Analysis, Insights and Forecast - by Application
- 9.1.1. Industry
- 9.1.2. Measurement & Detection
- 9.1.3. Others
- 9.2. Market Analysis, Insights and Forecast - by Types
- 9.2.1. CCD NIR Cameras
- 9.2.2. CMOS NIR Cameras
- 9.2.3. Others
- 9.1. Market Analysis, Insights and Forecast - by Application
- 10. Asia Pacific Near IR Cameras Analysis, Insights and Forecast, 2019-2031
- 10.1. Market Analysis, Insights and Forecast - by Application
- 10.1.1. Industry
- 10.1.2. Measurement & Detection
- 10.1.3. Others
- 10.2. Market Analysis, Insights and Forecast - by Types
- 10.2.1. CCD NIR Cameras
- 10.2.2. CMOS NIR Cameras
- 10.2.3. Others
- 10.1. Market Analysis, Insights and Forecast - by Application
- 11. Competitive Analysis
- 11.1. Global Market Share Analysis 2024
- 11.2. Company Profiles
- 11.2.1 JAI
- 11.2.1.1. Overview
- 11.2.1.2. Products
- 11.2.1.3. SWOT Analysis
- 11.2.1.4. Recent Developments
- 11.2.1.5. Financials (Based on Availability)
- 11.2.2 FLIR Systems
- 11.2.2.1. Overview
- 11.2.2.2. Products
- 11.2.2.3. SWOT Analysis
- 11.2.2.4. Recent Developments
- 11.2.2.5. Financials (Based on Availability)
- 11.2.3 Allied Vision Technologies
- 11.2.3.1. Overview
- 11.2.3.2. Products
- 11.2.3.3. SWOT Analysis
- 11.2.3.4. Recent Developments
- 11.2.3.5. Financials (Based on Availability)
- 11.2.4 IDS
- 11.2.4.1. Overview
- 11.2.4.2. Products
- 11.2.4.3. SWOT Analysis
- 11.2.4.4. Recent Developments
- 11.2.4.5. Financials (Based on Availability)
- 11.2.5 Basler
- 11.2.5.1. Overview
- 11.2.5.2. Products
- 11.2.5.3. SWOT Analysis
- 11.2.5.4. Recent Developments
- 11.2.5.5. Financials (Based on Availability)
- 11.2.6 HORIBA Scientific
- 11.2.6.1. Overview
- 11.2.6.2. Products
- 11.2.6.3. SWOT Analysis
- 11.2.6.4. Recent Developments
- 11.2.6.5. Financials (Based on Availability)
- 11.2.7 Lumenera
- 11.2.7.1. Overview
- 11.2.7.2. Products
- 11.2.7.3. SWOT Analysis
- 11.2.7.4. Recent Developments
- 11.2.7.5. Financials (Based on Availability)
- 11.2.8 QImaging
- 11.2.8.1. Overview
- 11.2.8.2. Products
- 11.2.8.3. SWOT Analysis
- 11.2.8.4. Recent Developments
- 11.2.8.5. Financials (Based on Availability)
- 11.2.9 Xenics
- 11.2.9.1. Overview
- 11.2.9.2. Products
- 11.2.9.3. SWOT Analysis
- 11.2.9.4. Recent Developments
- 11.2.9.5. Financials (Based on Availability)
- 11.2.10 Photonfocus
- 11.2.10.1. Overview
- 11.2.10.2. Products
- 11.2.10.3. SWOT Analysis
- 11.2.10.4. Recent Developments
- 11.2.10.5. Financials (Based on Availability)
- 11.2.11 Infrared Cameras
- 11.2.11.1. Overview
- 11.2.11.2. Products
- 11.2.11.3. SWOT Analysis
- 11.2.11.4. Recent Developments
- 11.2.11.5. Financials (Based on Availability)
- 11.2.1 JAI
List of Figures
- Figure 1: Global Near IR Cameras Revenue Breakdown (million, %) by Region 2024 & 2032
- Figure 2: Global Near IR Cameras Volume Breakdown (K, %) by Region 2024 & 2032
- Figure 3: North America Near IR Cameras Revenue (million), by Application 2024 & 2032
- Figure 4: North America Near IR Cameras Volume (K), by Application 2024 & 2032
- Figure 5: North America Near IR Cameras Revenue Share (%), by Application 2024 & 2032
- Figure 6: North America Near IR Cameras Volume Share (%), by Application 2024 & 2032
- Figure 7: North America Near IR Cameras Revenue (million), by Types 2024 & 2032
- Figure 8: North America Near IR Cameras Volume (K), by Types 2024 & 2032
- Figure 9: North America Near IR Cameras Revenue Share (%), by Types 2024 & 2032
- Figure 10: North America Near IR Cameras Volume Share (%), by Types 2024 & 2032
- Figure 11: North America Near IR Cameras Revenue (million), by Country 2024 & 2032
- Figure 12: North America Near IR Cameras Volume (K), by Country 2024 & 2032
- Figure 13: North America Near IR Cameras Revenue Share (%), by Country 2024 & 2032
- Figure 14: North America Near IR Cameras Volume Share (%), by Country 2024 & 2032
- Figure 15: South America Near IR Cameras Revenue (million), by Application 2024 & 2032
- Figure 16: South America Near IR Cameras Volume (K), by Application 2024 & 2032
- Figure 17: South America Near IR Cameras Revenue Share (%), by Application 2024 & 2032
- Figure 18: South America Near IR Cameras Volume Share (%), by Application 2024 & 2032
- Figure 19: South America Near IR Cameras Revenue (million), by Types 2024 & 2032
- Figure 20: South America Near IR Cameras Volume (K), by Types 2024 & 2032
- Figure 21: South America Near IR Cameras Revenue Share (%), by Types 2024 & 2032
- Figure 22: South America Near IR Cameras Volume Share (%), by Types 2024 & 2032
- Figure 23: South America Near IR Cameras Revenue (million), by Country 2024 & 2032
- Figure 24: South America Near IR Cameras Volume (K), by Country 2024 & 2032
- Figure 25: South America Near IR Cameras Revenue Share (%), by Country 2024 & 2032
- Figure 26: South America Near IR Cameras Volume Share (%), by Country 2024 & 2032
- Figure 27: Europe Near IR Cameras Revenue (million), by Application 2024 & 2032
- Figure 28: Europe Near IR Cameras Volume (K), by Application 2024 & 2032
- Figure 29: Europe Near IR Cameras Revenue Share (%), by Application 2024 & 2032
- Figure 30: Europe Near IR Cameras Volume Share (%), by Application 2024 & 2032
- Figure 31: Europe Near IR Cameras Revenue (million), by Types 2024 & 2032
- Figure 32: Europe Near IR Cameras Volume (K), by Types 2024 & 2032
- Figure 33: Europe Near IR Cameras Revenue Share (%), by Types 2024 & 2032
- Figure 34: Europe Near IR Cameras Volume Share (%), by Types 2024 & 2032
- Figure 35: Europe Near IR Cameras Revenue (million), by Country 2024 & 2032
- Figure 36: Europe Near IR Cameras Volume (K), by Country 2024 & 2032
- Figure 37: Europe Near IR Cameras Revenue Share (%), by Country 2024 & 2032
- Figure 38: Europe Near IR Cameras Volume Share (%), by Country 2024 & 2032
- Figure 39: Middle East & Africa Near IR Cameras Revenue (million), by Application 2024 & 2032
- Figure 40: Middle East & Africa Near IR Cameras Volume (K), by Application 2024 & 2032
- Figure 41: Middle East & Africa Near IR Cameras Revenue Share (%), by Application 2024 & 2032
- Figure 42: Middle East & Africa Near IR Cameras Volume Share (%), by Application 2024 & 2032
- Figure 43: Middle East & Africa Near IR Cameras Revenue (million), by Types 2024 & 2032
- Figure 44: Middle East & Africa Near IR Cameras Volume (K), by Types 2024 & 2032
- Figure 45: Middle East & Africa Near IR Cameras Revenue Share (%), by Types 2024 & 2032
- Figure 46: Middle East & Africa Near IR Cameras Volume Share (%), by Types 2024 & 2032
- Figure 47: Middle East & Africa Near IR Cameras Revenue (million), by Country 2024 & 2032
- Figure 48: Middle East & Africa Near IR Cameras Volume (K), by Country 2024 & 2032
- Figure 49: Middle East & Africa Near IR Cameras Revenue Share (%), by Country 2024 & 2032
- Figure 50: Middle East & Africa Near IR Cameras Volume Share (%), by Country 2024 & 2032
- Figure 51: Asia Pacific Near IR Cameras Revenue (million), by Application 2024 & 2032
- Figure 52: Asia Pacific Near IR Cameras Volume (K), by Application 2024 & 2032
- Figure 53: Asia Pacific Near IR Cameras Revenue Share (%), by Application 2024 & 2032
- Figure 54: Asia Pacific Near IR Cameras Volume Share (%), by Application 2024 & 2032
- Figure 55: Asia Pacific Near IR Cameras Revenue (million), by Types 2024 & 2032
- Figure 56: Asia Pacific Near IR Cameras Volume (K), by Types 2024 & 2032
- Figure 57: Asia Pacific Near IR Cameras Revenue Share (%), by Types 2024 & 2032
- Figure 58: Asia Pacific Near IR Cameras Volume Share (%), by Types 2024 & 2032
- Figure 59: Asia Pacific Near IR Cameras Revenue (million), by Country 2024 & 2032
- Figure 60: Asia Pacific Near IR Cameras Volume (K), by Country 2024 & 2032
- Figure 61: Asia Pacific Near IR Cameras Revenue Share (%), by Country 2024 & 2032
- Figure 62: Asia Pacific Near IR Cameras Volume Share (%), by Country 2024 & 2032
List of Tables
- Table 1: Global Near IR Cameras Revenue million Forecast, by Region 2019 & 2032
- Table 2: Global Near IR Cameras Volume K Forecast, by Region 2019 & 2032
- Table 3: Global Near IR Cameras Revenue million Forecast, by Application 2019 & 2032
- Table 4: Global Near IR Cameras Volume K Forecast, by Application 2019 & 2032
- Table 5: Global Near IR Cameras Revenue million Forecast, by Types 2019 & 2032
- Table 6: Global Near IR Cameras Volume K Forecast, by Types 2019 & 2032
- Table 7: Global Near IR Cameras Revenue million Forecast, by Region 2019 & 2032
- Table 8: Global Near IR Cameras Volume K Forecast, by Region 2019 & 2032
- Table 9: Global Near IR Cameras Revenue million Forecast, by Application 2019 & 2032
- Table 10: Global Near IR Cameras Volume K Forecast, by Application 2019 & 2032
- Table 11: Global Near IR Cameras Revenue million Forecast, by Types 2019 & 2032
- Table 12: Global Near IR Cameras Volume K Forecast, by Types 2019 & 2032
- Table 13: Global Near IR Cameras Revenue million Forecast, by Country 2019 & 2032
- Table 14: Global Near IR Cameras Volume K Forecast, by Country 2019 & 2032
- Table 15: United States Near IR Cameras Revenue (million) Forecast, by Application 2019 & 2032
- Table 16: United States Near IR Cameras Volume (K) Forecast, by Application 2019 & 2032
- Table 17: Canada Near IR Cameras Revenue (million) Forecast, by Application 2019 & 2032
- Table 18: Canada Near IR Cameras Volume (K) Forecast, by Application 2019 & 2032
- Table 19: Mexico Near IR Cameras Revenue (million) Forecast, by Application 2019 & 2032
- Table 20: Mexico Near IR Cameras Volume (K) Forecast, by Application 2019 & 2032
- Table 21: Global Near IR Cameras Revenue million Forecast, by Application 2019 & 2032
- Table 22: Global Near IR Cameras Volume K Forecast, by Application 2019 & 2032
- Table 23: Global Near IR Cameras Revenue million Forecast, by Types 2019 & 2032
- Table 24: Global Near IR Cameras Volume K Forecast, by Types 2019 & 2032
- Table 25: Global Near IR Cameras Revenue million Forecast, by Country 2019 & 2032
- Table 26: Global Near IR Cameras Volume K Forecast, by Country 2019 & 2032
- Table 27: Brazil Near IR Cameras Revenue (million) Forecast, by Application 2019 & 2032
- Table 28: Brazil Near IR Cameras Volume (K) Forecast, by Application 2019 & 2032
- Table 29: Argentina Near IR Cameras Revenue (million) Forecast, by Application 2019 & 2032
- Table 30: Argentina Near IR Cameras Volume (K) Forecast, by Application 2019 & 2032
- Table 31: Rest of South America Near IR Cameras Revenue (million) Forecast, by Application 2019 & 2032
- Table 32: Rest of South America Near IR Cameras Volume (K) Forecast, by Application 2019 & 2032
- Table 33: Global Near IR Cameras Revenue million Forecast, by Application 2019 & 2032
- Table 34: Global Near IR Cameras Volume K Forecast, by Application 2019 & 2032
- Table 35: Global Near IR Cameras Revenue million Forecast, by Types 2019 & 2032
- Table 36: Global Near IR Cameras Volume K Forecast, by Types 2019 & 2032
- Table 37: Global Near IR Cameras Revenue million Forecast, by Country 2019 & 2032
- Table 38: Global Near IR Cameras Volume K Forecast, by Country 2019 & 2032
- Table 39: United Kingdom Near IR Cameras Revenue (million) Forecast, by Application 2019 & 2032
- Table 40: United Kingdom Near IR Cameras Volume (K) Forecast, by Application 2019 & 2032
- Table 41: Germany Near IR Cameras Revenue (million) Forecast, by Application 2019 & 2032
- Table 42: Germany Near IR Cameras Volume (K) Forecast, by Application 2019 & 2032
- Table 43: France Near IR Cameras Revenue (million) Forecast, by Application 2019 & 2032
- Table 44: France Near IR Cameras Volume (K) Forecast, by Application 2019 & 2032
- Table 45: Italy Near IR Cameras Revenue (million) Forecast, by Application 2019 & 2032
- Table 46: Italy Near IR Cameras Volume (K) Forecast, by Application 2019 & 2032
- Table 47: Spain Near IR Cameras Revenue (million) Forecast, by Application 2019 & 2032
- Table 48: Spain Near IR Cameras Volume (K) Forecast, by Application 2019 & 2032
- Table 49: Russia Near IR Cameras Revenue (million) Forecast, by Application 2019 & 2032
- Table 50: Russia Near IR Cameras Volume (K) Forecast, by Application 2019 & 2032
- Table 51: Benelux Near IR Cameras Revenue (million) Forecast, by Application 2019 & 2032
- Table 52: Benelux Near IR Cameras Volume (K) Forecast, by Application 2019 & 2032
- Table 53: Nordics Near IR Cameras Revenue (million) Forecast, by Application 2019 & 2032
- Table 54: Nordics Near IR Cameras Volume (K) Forecast, by Application 2019 & 2032
- Table 55: Rest of Europe Near IR Cameras Revenue (million) Forecast, by Application 2019 & 2032
- Table 56: Rest of Europe Near IR Cameras Volume (K) Forecast, by Application 2019 & 2032
- Table 57: Global Near IR Cameras Revenue million Forecast, by Application 2019 & 2032
- Table 58: Global Near IR Cameras Volume K Forecast, by Application 2019 & 2032
- Table 59: Global Near IR Cameras Revenue million Forecast, by Types 2019 & 2032
- Table 60: Global Near IR Cameras Volume K Forecast, by Types 2019 & 2032
- Table 61: Global Near IR Cameras Revenue million Forecast, by Country 2019 & 2032
- Table 62: Global Near IR Cameras Volume K Forecast, by Country 2019 & 2032
- Table 63: Turkey Near IR Cameras Revenue (million) Forecast, by Application 2019 & 2032
- Table 64: Turkey Near IR Cameras Volume (K) Forecast, by Application 2019 & 2032
- Table 65: Israel Near IR Cameras Revenue (million) Forecast, by Application 2019 & 2032
- Table 66: Israel Near IR Cameras Volume (K) Forecast, by Application 2019 & 2032
- Table 67: GCC Near IR Cameras Revenue (million) Forecast, by Application 2019 & 2032
- Table 68: GCC Near IR Cameras Volume (K) Forecast, by Application 2019 & 2032
- Table 69: North Africa Near IR Cameras Revenue (million) Forecast, by Application 2019 & 2032
- Table 70: North Africa Near IR Cameras Volume (K) Forecast, by Application 2019 & 2032
- Table 71: South Africa Near IR Cameras Revenue (million) Forecast, by Application 2019 & 2032
- Table 72: South Africa Near IR Cameras Volume (K) Forecast, by Application 2019 & 2032
- Table 73: Rest of Middle East & Africa Near IR Cameras Revenue (million) Forecast, by Application 2019 & 2032
- Table 74: Rest of Middle East & Africa Near IR Cameras Volume (K) Forecast, by Application 2019 & 2032
- Table 75: Global Near IR Cameras Revenue million Forecast, by Application 2019 & 2032
- Table 76: Global Near IR Cameras Volume K Forecast, by Application 2019 & 2032
- Table 77: Global Near IR Cameras Revenue million Forecast, by Types 2019 & 2032
- Table 78: Global Near IR Cameras Volume K Forecast, by Types 2019 & 2032
- Table 79: Global Near IR Cameras Revenue million Forecast, by Country 2019 & 2032
- Table 80: Global Near IR Cameras Volume K Forecast, by Country 2019 & 2032
- Table 81: China Near IR Cameras Revenue (million) Forecast, by Application 2019 & 2032
- Table 82: China Near IR Cameras Volume (K) Forecast, by Application 2019 & 2032
- Table 83: India Near IR Cameras Revenue (million) Forecast, by Application 2019 & 2032
- Table 84: India Near IR Cameras Volume (K) Forecast, by Application 2019 & 2032
- Table 85: Japan Near IR Cameras Revenue (million) Forecast, by Application 2019 & 2032
- Table 86: Japan Near IR Cameras Volume (K) Forecast, by Application 2019 & 2032
- Table 87: South Korea Near IR Cameras Revenue (million) Forecast, by Application 2019 & 2032
- Table 88: South Korea Near IR Cameras Volume (K) Forecast, by Application 2019 & 2032
- Table 89: ASEAN Near IR Cameras Revenue (million) Forecast, by Application 2019 & 2032
- Table 90: ASEAN Near IR Cameras Volume (K) Forecast, by Application 2019 & 2032
- Table 91: Oceania Near IR Cameras Revenue (million) Forecast, by Application 2019 & 2032
- Table 92: Oceania Near IR Cameras Volume (K) Forecast, by Application 2019 & 2032
- Table 93: Rest of Asia Pacific Near IR Cameras Revenue (million) Forecast, by Application 2019 & 2032
- Table 94: Rest of Asia Pacific Near IR Cameras Volume (K) Forecast, by Application 2019 & 2032
Frequently Asked Questions
1. What is the projected Compound Annual Growth Rate (CAGR) of the Near IR Cameras?
The projected CAGR is approximately 3.4%.
2. Which companies are prominent players in the Near IR Cameras?
Key companies in the market include JAI, FLIR Systems, Allied Vision Technologies, IDS, Basler, HORIBA Scientific, Lumenera, QImaging, Xenics, Photonfocus, Infrared Cameras.
3. What are the main segments of the Near IR Cameras?
The market segments include Application, Types.
4. Can you provide details about the market size?
The market size is estimated to be USD 950 million as of 2022.
5. What are some drivers contributing to market growth?
N/A
6. What are the notable trends driving market growth?
N/A
7. Are there any restraints impacting market growth?
N/A
8. Can you provide examples of recent developments in the market?
N/A
9. What pricing options are available for accessing the report?
Pricing options include single-user, multi-user, and enterprise licenses priced at USD 3950.00, USD 5925.00, and USD 7900.00 respectively.
10. Is the market size provided in terms of value or volume?
The market size is provided in terms of value, measured in million and volume, measured in K.
11. Are there any specific market keywords associated with the report?
Yes, the market keyword associated with the report is "Near IR Cameras," which aids in identifying and referencing the specific market segment covered.
12. How do I determine which pricing option suits my needs best?
The pricing options vary based on user requirements and access needs. Individual users may opt for single-user licenses, while businesses requiring broader access may choose multi-user or enterprise licenses for cost-effective access to the report.
13. Are there any additional resources or data provided in the Near IR Cameras report?
While the report offers comprehensive insights, it's advisable to review the specific contents or supplementary materials provided to ascertain if additional resources or data are available.
14. How can I stay updated on further developments or reports in the Near IR Cameras?
To stay informed about further developments, trends, and reports in the Near IR Cameras, consider subscribing to industry newsletters, following relevant companies and organizations, or regularly checking reputable industry news sources and publications.
Methodology
Step 1 - Identification of Relevant Samples Size from Population Database


Step 2 - Approaches for Defining Global Market Size (Value, Volume* & Price*)

Note*: In applicable scenarios
Step 3 - Data Sources
Primary Research
- Web Analytics
- Survey Reports
- Research Institute
- Latest Research Reports
- Opinion Leaders
Secondary Research
- Annual Reports
- White Paper
- Latest Press Release
- Industry Association
- Paid Database
- Investor Presentations

Step 4 - Data Triangulation
Involves using different sources of information in order to increase the validity of a study
These sources are likely to be stakeholders in a program - participants, other researchers, program staff, other community members, and so on.
Then we put all data in single framework & apply various statistical tools to find out the dynamic on the market.
During the analysis stage, feedback from the stakeholder groups would be compared to determine areas of agreement as well as areas of divergence


