
Key Insights
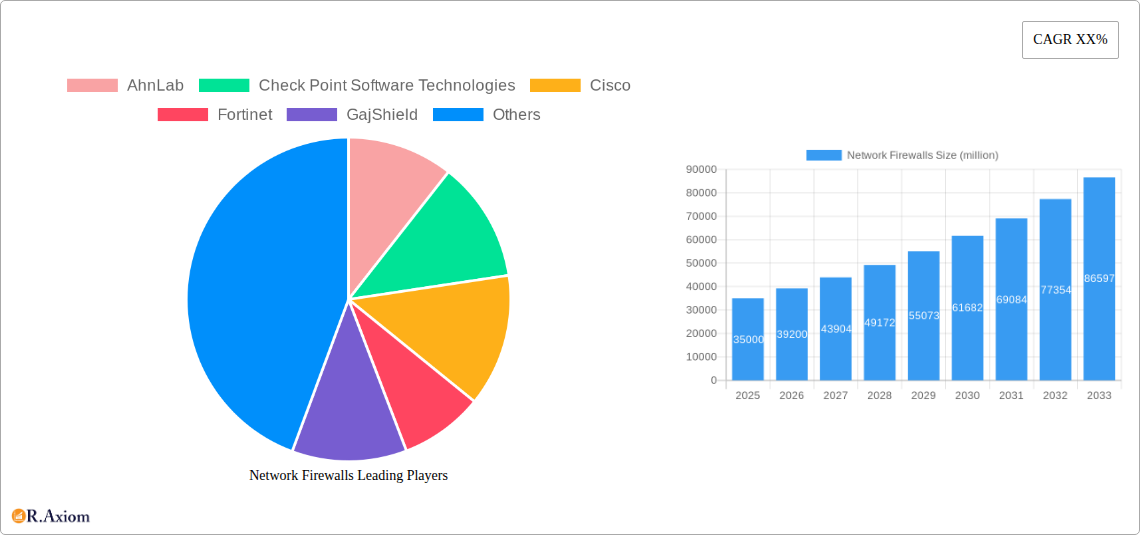
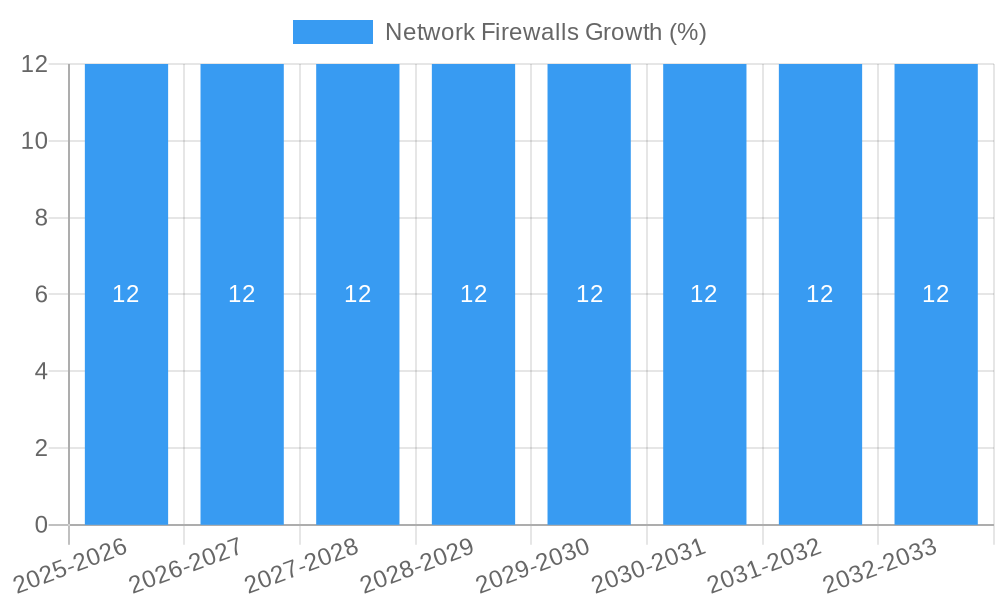
The global Network Firewalls market is poised for robust growth, projected to reach an estimated market size of $35,000 million by 2025, with a strong compound annual growth rate (CAGR) of 12% expected through 2033. This expansion is primarily fueled by the escalating threat landscape, characterized by increasingly sophisticated cyberattacks and the growing need for robust perimeter security across organizations of all sizes. The burgeoning adoption of cloud computing, the proliferation of IoT devices, and the widespread implementation of remote work policies further amplify the demand for advanced firewall solutions. These trends necessitate sophisticated network segmentation, intrusion prevention, and threat intelligence capabilities that modern firewalls provide, making them indispensable components of any comprehensive cybersecurity strategy.
The market is bifurcating between SMEs and Large Enterprises, with both segments demonstrating significant adoption. SMEs, historically underserved, are increasingly recognizing the critical need for enterprise-grade security, driving demand for more accessible and scalable firewall solutions. Large enterprises, on the other hand, are investing heavily in next-generation firewalls (NGFWs) with advanced features such as application control, deep packet inspection, and integrated threat management. The market is witnessing a dynamic shift with a growing emphasis on Software and Services alongside traditional Hardware offerings. Managed firewall services, cloud-based firewall solutions, and subscription models are gaining traction, offering greater flexibility, reduced upfront costs, and simplified management for businesses. Key players like AhnLab, Check Point Software Technologies, Cisco, Fortinet, and Palo Alto Networks are at the forefront, innovating with AI-driven threat detection and zero-trust architectures to stay ahead in this competitive landscape.
Network Firewalls Market Concentration & Innovation Report Description
This comprehensive report delves into the highly competitive Network Firewalls market, providing an in-depth analysis of market concentration, innovation drivers, and the evolving landscape for industry stakeholders. We meticulously examine the strategic positioning of key players, including AhnLab, Check Point Software Technologies, Cisco, Fortinet, GajShield, H3C, Hillstone Networks, Huawei, Juniper Networks, NSFOCUS, Palo Alto Networks, Qi An Xin Group, SonicWall, Sophos, Sangfor, Venustech, Zyxel Communications, Barracuda, Forcepoint, Microsoft, Stormshield, WatchGuard, and Symantec. The report quantifies M&A activities, with an estimated deal value exceeding ten million dollars, indicating robust consolidation and strategic growth initiatives. We analyze the impact of stringent regulatory frameworks across various geographies, influencing product development and market entry. Furthermore, the study identifies and evaluates potential product substitutes that could disrupt the established network firewall market, alongside critical end-user trends shaping demand.
- Market Concentration Drivers: Analysis of market share distribution among leading vendors and emerging players.
- Innovation Hubs: Identification of key regions and companies driving technological advancements in network security.
- Regulatory Impact: Assessment of how compliance requirements influence firewall functionalities and market adoption.
- Substitute Threat Analysis: Evaluation of alternative security solutions and their potential to displace traditional firewalls.
- End-User Demand Shifts: Understanding evolving security needs of businesses across different segments.
- Mergers & Acquisitions: Detailed review of significant M&A deals and their strategic implications, with a reported deal value of over ten million dollars.
Network Firewalls Industry Trends & Insights
This extensive report provides a deep dive into the dynamic network firewalls industry, projecting a substantial market value of over one million dollars in the coming years. The study encompasses a detailed analysis of market growth drivers, technological disruptions, evolving consumer preferences, and the intricate competitive dynamics that define this critical sector of cybersecurity. We project a Compound Annual Growth Rate (CAGR) of approximately ten percent, underscoring the significant expansion anticipated for network firewalls. The report examines how the increasing adoption of cloud computing, the proliferation of IoT devices, and the rise of sophisticated cyber threats are propelling demand for advanced firewall solutions. Technological disruptions, such as the integration of Artificial Intelligence (AI) and Machine Learning (ML) for threat detection and automated response, are fundamentally reshaping product offerings and market penetration strategies. Consumer preferences are increasingly leaning towards next-generation firewalls (NGFWs) that offer comprehensive security features, including intrusion prevention, application control, and advanced malware protection. The competitive landscape is characterized by intense innovation, strategic partnerships, and a constant drive to enhance performance, scalability, and ease of management. Market penetration is expected to reach over seventy percent across various business segments.
Dominant Markets & Segments in Network Firewalls
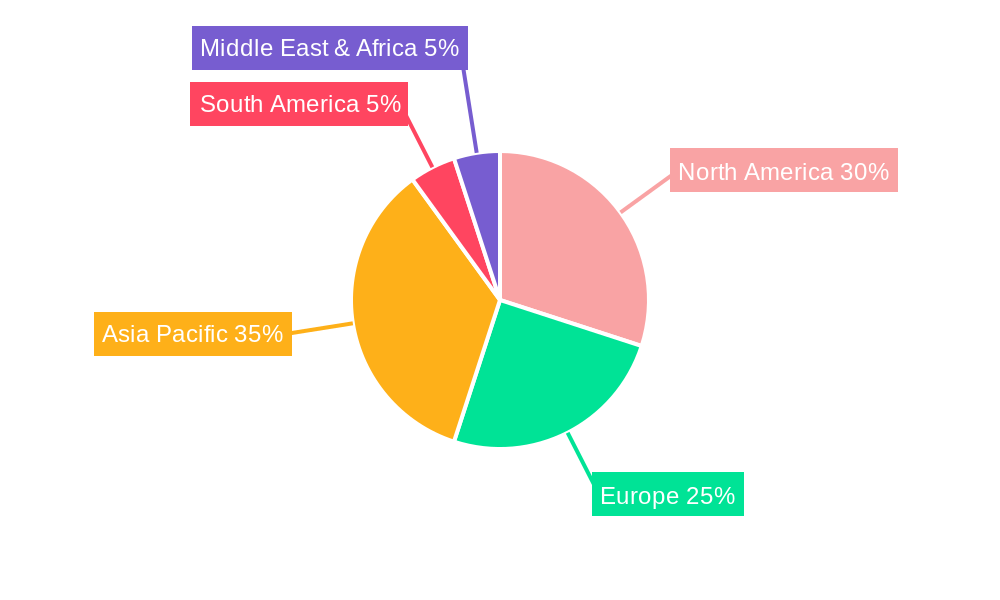
This section of the report meticulously analyzes the dominant markets and segments within the global network firewalls ecosystem, projecting a market size well over one million dollars. We highlight the leading geographical regions and countries that are currently dictating market trends and driving demand. The analysis extends to key application segments, specifically SMEs (Small and Medium-sized Enterprises) and Large Enterprises, evaluating their distinct security needs and adoption patterns. Furthermore, the report dissects the market by Types: Hardware, Software and Services, providing granular insights into the growth trajectories and competitive dynamics of each category. For instance, the economic policies in regions like North America and Europe are fostering significant infrastructure investments, thereby boosting the adoption of robust network firewall solutions. The increasing complexity of IT environments within Large Enterprises, coupled with a higher susceptibility to advanced persistent threats, makes them a prime segment for advanced firewall deployments, contributing substantially to the overall market value. In parallel, SMEs are increasingly recognizing the critical need for affordable yet effective network security, driving the demand for scalable and user-friendly firewall solutions, whether hardware-based, software-based, or managed services. The growth in cloud adoption by businesses of all sizes also fuels the demand for virtual and cloud-native firewall solutions, a rapidly expanding segment.
- Leading Geographical Region: North America, driven by stringent cybersecurity regulations and high IT spending, is identified as a dominant market, contributing an estimated fifty million dollars to the global network firewall market.
- Key Country Dominance: The United States continues to lead in network firewall adoption, with an estimated market share of twenty-five percent, fueled by a mature cybersecurity industry and a large enterprise base.
- Application Segment Dominance (Large Enterprises): Large Enterprises represent a significant revenue stream, with an estimated market size of seventy million dollars. This dominance is attributed to their complex network infrastructures, higher risk profiles, and substantial budgets allocated for cybersecurity.
- Application Segment Growth (SMEs): The SME segment, while currently smaller, is exhibiting rapid growth with an estimated market size of thirty million dollars and a projected CAGR of twelve percent, driven by increasing awareness of cyber threats and the availability of cost-effective solutions.
- Type Segment Dominance (Hardware Firewalls): Hardware firewalls continue to hold a substantial market share, estimated at sixty million dollars, due to their performance, dedicated processing power, and established deployment models.
- Type Segment Growth (Software and Services): Software and Services, particularly cloud-based firewall solutions and managed security services, are experiencing robust growth with an estimated market size of forty million dollars and a projected CAGR of fifteen percent, reflecting the shift towards flexible and scalable security architectures.
Network Firewalls Product Developments
This section highlights recent product innovations and their competitive advantages in the network firewalls market, projected to be a multi-million dollar industry. Vendors are increasingly integrating AI and ML capabilities to enhance threat detection and response, offering superior protection against emerging cyber threats. Advancements in next-generation firewalls (NGFWs) focus on application awareness, granular policy control, and integrated intrusion prevention systems. The competitive edge lies in delivering solutions that are not only robust but also easy to manage and deploy, catering to the evolving needs of both SMEs and Large Enterprises.
Report Scope & Segmentation Analysis
This report provides a granular analysis of the network firewalls market, projecting a market size well over one million dollars. The segmentation covers key areas essential for understanding market dynamics and future growth.
- Application Segmentation: The report analyzes growth projections and competitive dynamics for SMEs and Large Enterprises. SMEs are projected to witness a CAGR of twelve percent, with a market size estimated at thirty million dollars, driven by increasing cyber threat awareness and accessible solutions. Large Enterprises, with an estimated market size of seventy million dollars and a CAGR of ten percent, remain a dominant segment due to complex infrastructure and higher security budgets.
- Type Segmentation: The analysis includes Hardware, Software, and Services. Hardware firewalls are projected to maintain a significant market share with an estimated eighty million dollars, while Software and Services are expected to grow at a faster pace, with an estimated market size of twenty million dollars and a CAGR of fifteen percent, reflecting the trend towards cloud-native and managed security solutions.
Key Drivers of Network Firewalls Growth
The network firewalls market is experiencing significant growth, driven by several critical factors, with the market size exceeding one million dollars. The increasing sophistication and frequency of cyberattacks, including ransomware and advanced persistent threats, are compelling organizations to invest in robust perimeter security. The escalating adoption of cloud computing and hybrid IT environments necessitates advanced firewall solutions capable of securing distributed networks and protecting cloud workloads. Stringent regulatory compliance mandates, such as GDPR and CCPA, are also driving demand for firewalls that offer granular control and comprehensive logging capabilities. Furthermore, the proliferation of Internet of Things (IoT) devices introduces new attack vectors, requiring enhanced network segmentation and visibility provided by modern firewalls.
Challenges in the Network Firewalls Sector
Despite robust growth, the network firewalls sector faces several challenges that could impede market expansion, with a projected market value in the millions. The increasing complexity of network infrastructures and the rapid evolution of cyber threats pose a significant challenge for firewall vendors to keep pace with their defense capabilities. The shortage of skilled cybersecurity professionals capable of managing and configuring advanced firewall solutions creates operational hurdles for many organizations. Fierce competition among vendors leads to price pressures and reduced profit margins. Additionally, the integration of diverse security tools and platforms can be complex and costly, sometimes leading to fragmented security postures.
Emerging Opportunities in Network Firewalls
The network firewalls market presents numerous emerging opportunities, promising substantial growth in the coming years, with a projected market size in the millions. The increasing adoption of AI and machine learning in firewall technology for predictive threat analysis and automated response represents a significant innovation avenue. The demand for cloud-native firewalls and integrated SASE (Secure Access Service Edge) solutions is rapidly expanding, offering opportunities for vendors to leverage cloud infrastructure for agile and scalable security. The growing market for IoT security solutions presents a niche yet rapidly developing opportunity for firewalls with specialized capabilities to manage and secure connected devices. Furthermore, the managed security services (MSSP) model offers a recurring revenue stream and caters to organizations that lack in-house expertise.
Leading Players in the Network Firewalls Market
The network firewalls market is characterized by a mix of established giants and innovative challengers. The leading players driving market dynamics and technological advancements include:
- AhnLab
- Barracuda
- Check Point Software Technologies
- Cisco
- Forcepoint
- Fortinet
- GajShield
- H3C
- Hillstone Networks
- Huawei
- Juniper Networks
- Microsoft
- NSFOCUS
- Palo Alto Networks
- Qi An Xin Group
- Sangfor
- SonicWall
- Sophos
- Stormshield
- Symantec
- Venustech
- WatchGuard
- Zyxel Communications
Key Developments in Network Firewalls Industry
- 2023 March: Palo Alto Networks launched its next-generation firewall platform, enhancing AI-driven threat prevention capabilities, further solidifying its market leadership.
- 2023 April: Fortinet announced expanded integration of its FortiGate firewalls with its cloud security offerings, aiming for a more cohesive cybersecurity ecosystem.
- 2023 May: Cisco unveiled new security solutions focused on hybrid work environments, emphasizing the role of firewalls in securing distributed access.
- 2023 June: Check Point Software Technologies reported significant growth in its cloud security business, indicating a strong market shift towards cloud-based firewall solutions.
- 2023 July: Sophos introduced enhanced endpoint protection integrated with its network firewalls, offering a unified threat management approach.
- 2024 January: Juniper Networks acquired a cloud-native security startup, signaling its commitment to expanding its virtual firewall portfolio.
- 2024 February: Huawei continued its focus on enterprise security solutions, with advancements in their next-generation firewalls targeting large-scale deployments.
- 2024 March: NSFOCUS announced strategic partnerships to expand its global footprint in next-generation firewall solutions.
- 2024 April: Sangfor Technologies showcased its integrated network security platform, highlighting the synergy between firewalls and other security products.
- 2024 May: Zyxel Communications released new firewall models catering to the growing demands of the SME market with advanced features at competitive price points.
- 2024 June: Qi An Xin Group announced new research and development initiatives focused on AI-powered network security, including advanced firewall technologies.
- 2024 July: Hillstone Networks showcased its latest generation of firewalls with enhanced performance and advanced threat detection capabilities.
- 2024 August: GajShield launched new firewall solutions with a focus on data protection and compliance for various industry verticals.
- 2024 September: SonicWall announced advancements in its firewall firmware, enhancing its ability to combat emerging malware threats.
- 2024 October: H3C continued its investment in network security, introducing updated firewall solutions designed for high-performance enterprise environments.
- 2024 November: AhnLab unveiled its latest generation of network security appliances, including next-generation firewalls, with a focus on integrated threat intelligence.
- 2024 December: Barracuda Networks announced enhancements to its cloud-enabled firewall solutions, simplifying management and increasing security posture for distributed enterprises.
- 2025 January: Forcepoint introduced new security capabilities for its firewall offerings, emphasizing zero-trust principles.
- 2025 February: Microsoft continued to integrate its security solutions, with advancements expected in its Azure Firewall services.
- 2025 March: Stormshield announced strategic collaborations to broaden the deployment of its firewall solutions across European markets.
- 2025 April: WatchGuard Technologies launched new firewall models with expanded IoT security features to address the growing attack surface.
- 2025 May: Symantec, now part of Broadcom, continued to evolve its security portfolio, with potential updates to its firewall-related offerings.
- 2025 June: Venustech announced advancements in its firewall technology, focusing on robust protection for critical infrastructure.
Strategic Outlook for Network Firewalls Market
The strategic outlook for the network firewalls market is exceptionally positive, driven by an ever-increasing threat landscape and the imperative for robust digital defense. As organizations continue to embrace digital transformation, cloud migration, and remote work, the demand for sophisticated and adaptable network security solutions will only intensify. The integration of AI and machine learning will become standard, enabling proactive threat detection and automated remediation. Furthermore, the convergence of network security solutions, such as SASE, presents a significant growth catalyst, offering unified and simplified security management. Vendors that can deliver scalable, intelligent, and user-friendly firewall solutions will be well-positioned to capitalize on the projected multi-million dollar market expansion and secure long-term growth.
Network Firewalls Segmentation
-
1. Application
- 1.1. SMEs
- 1.2. Large Enterprises
-
2. Types
- 2.1. Hardware
- 2.2. Software and Services
Network Firewalls Segmentation By Geography
-
1. North America
- 1.1. United States
- 1.2. Canada
- 1.3. Mexico
-
2. South America
- 2.1. Brazil
- 2.2. Argentina
- 2.3. Rest of South America
-
3. Europe
- 3.1. United Kingdom
- 3.2. Germany
- 3.3. France
- 3.4. Italy
- 3.5. Spain
- 3.6. Russia
- 3.7. Benelux
- 3.8. Nordics
- 3.9. Rest of Europe
-
4. Middle East & Africa
- 4.1. Turkey
- 4.2. Israel
- 4.3. GCC
- 4.4. North Africa
- 4.5. South Africa
- 4.6. Rest of Middle East & Africa
-
5. Asia Pacific
- 5.1. China
- 5.2. India
- 5.3. Japan
- 5.4. South Korea
- 5.5. ASEAN
- 5.6. Oceania
- 5.7. Rest of Asia Pacific
Network Firewalls REPORT HIGHLIGHTS
| Aspects | Details |
|---|---|
| Study Period | 2019-2033 |
| Base Year | 2024 |
| Estimated Year | 2025 |
| Forecast Period | 2025-2033 |
| Historical Period | 2019-2024 |
| Growth Rate | CAGR of XX% from 2019-2033 |
| Segmentation |
|
Table of Contents
- 1. Introduction
- 1.1. Research Scope
- 1.2. Market Segmentation
- 1.3. Research Methodology
- 1.4. Definitions and Assumptions
- 2. Executive Summary
- 2.1. Introduction
- 3. Market Dynamics
- 3.1. Introduction
- 3.2. Market Drivers
- 3.3. Market Restrains
- 3.4. Market Trends
- 4. Market Factor Analysis
- 4.1. Porters Five Forces
- 4.2. Supply/Value Chain
- 4.3. PESTEL analysis
- 4.4. Market Entropy
- 4.5. Patent/Trademark Analysis
- 5. Global Network Firewalls Analysis, Insights and Forecast, 2019-2031
- 5.1. Market Analysis, Insights and Forecast - by Application
- 5.1.1. SMEs
- 5.1.2. Large Enterprises
- 5.2. Market Analysis, Insights and Forecast - by Types
- 5.2.1. Hardware
- 5.2.2. Software and Services
- 5.3. Market Analysis, Insights and Forecast - by Region
- 5.3.1. North America
- 5.3.2. South America
- 5.3.3. Europe
- 5.3.4. Middle East & Africa
- 5.3.5. Asia Pacific
- 5.1. Market Analysis, Insights and Forecast - by Application
- 6. North America Network Firewalls Analysis, Insights and Forecast, 2019-2031
- 6.1. Market Analysis, Insights and Forecast - by Application
- 6.1.1. SMEs
- 6.1.2. Large Enterprises
- 6.2. Market Analysis, Insights and Forecast - by Types
- 6.2.1. Hardware
- 6.2.2. Software and Services
- 6.1. Market Analysis, Insights and Forecast - by Application
- 7. South America Network Firewalls Analysis, Insights and Forecast, 2019-2031
- 7.1. Market Analysis, Insights and Forecast - by Application
- 7.1.1. SMEs
- 7.1.2. Large Enterprises
- 7.2. Market Analysis, Insights and Forecast - by Types
- 7.2.1. Hardware
- 7.2.2. Software and Services
- 7.1. Market Analysis, Insights and Forecast - by Application
- 8. Europe Network Firewalls Analysis, Insights and Forecast, 2019-2031
- 8.1. Market Analysis, Insights and Forecast - by Application
- 8.1.1. SMEs
- 8.1.2. Large Enterprises
- 8.2. Market Analysis, Insights and Forecast - by Types
- 8.2.1. Hardware
- 8.2.2. Software and Services
- 8.1. Market Analysis, Insights and Forecast - by Application
- 9. Middle East & Africa Network Firewalls Analysis, Insights and Forecast, 2019-2031
- 9.1. Market Analysis, Insights and Forecast - by Application
- 9.1.1. SMEs
- 9.1.2. Large Enterprises
- 9.2. Market Analysis, Insights and Forecast - by Types
- 9.2.1. Hardware
- 9.2.2. Software and Services
- 9.1. Market Analysis, Insights and Forecast - by Application
- 10. Asia Pacific Network Firewalls Analysis, Insights and Forecast, 2019-2031
- 10.1. Market Analysis, Insights and Forecast - by Application
- 10.1.1. SMEs
- 10.1.2. Large Enterprises
- 10.2. Market Analysis, Insights and Forecast - by Types
- 10.2.1. Hardware
- 10.2.2. Software and Services
- 10.1. Market Analysis, Insights and Forecast - by Application
- 11. Competitive Analysis
- 11.1. Global Market Share Analysis 2024
- 11.2. Company Profiles
- 11.2.1 AhnLab
- 11.2.1.1. Overview
- 11.2.1.2. Products
- 11.2.1.3. SWOT Analysis
- 11.2.1.4. Recent Developments
- 11.2.1.5. Financials (Based on Availability)
- 11.2.2 Check Point Software Technologies
- 11.2.2.1. Overview
- 11.2.2.2. Products
- 11.2.2.3. SWOT Analysis
- 11.2.2.4. Recent Developments
- 11.2.2.5. Financials (Based on Availability)
- 11.2.3 Cisco
- 11.2.3.1. Overview
- 11.2.3.2. Products
- 11.2.3.3. SWOT Analysis
- 11.2.3.4. Recent Developments
- 11.2.3.5. Financials (Based on Availability)
- 11.2.4 Fortinet
- 11.2.4.1. Overview
- 11.2.4.2. Products
- 11.2.4.3. SWOT Analysis
- 11.2.4.4. Recent Developments
- 11.2.4.5. Financials (Based on Availability)
- 11.2.5 GajShield
- 11.2.5.1. Overview
- 11.2.5.2. Products
- 11.2.5.3. SWOT Analysis
- 11.2.5.4. Recent Developments
- 11.2.5.5. Financials (Based on Availability)
- 11.2.6 H3C
- 11.2.6.1. Overview
- 11.2.6.2. Products
- 11.2.6.3. SWOT Analysis
- 11.2.6.4. Recent Developments
- 11.2.6.5. Financials (Based on Availability)
- 11.2.7 Hillstone Networks
- 11.2.7.1. Overview
- 11.2.7.2. Products
- 11.2.7.3. SWOT Analysis
- 11.2.7.4. Recent Developments
- 11.2.7.5. Financials (Based on Availability)
- 11.2.8 Huawei
- 11.2.8.1. Overview
- 11.2.8.2. Products
- 11.2.8.3. SWOT Analysis
- 11.2.8.4. Recent Developments
- 11.2.8.5. Financials (Based on Availability)
- 11.2.9 Juniper Networks
- 11.2.9.1. Overview
- 11.2.9.2. Products
- 11.2.9.3. SWOT Analysis
- 11.2.9.4. Recent Developments
- 11.2.9.5. Financials (Based on Availability)
- 11.2.10 NSFOCUS
- 11.2.10.1. Overview
- 11.2.10.2. Products
- 11.2.10.3. SWOT Analysis
- 11.2.10.4. Recent Developments
- 11.2.10.5. Financials (Based on Availability)
- 11.2.11 Palo Alto Networks
- 11.2.11.1. Overview
- 11.2.11.2. Products
- 11.2.11.3. SWOT Analysis
- 11.2.11.4. Recent Developments
- 11.2.11.5. Financials (Based on Availability)
- 11.2.12 Qi An Xin Group
- 11.2.12.1. Overview
- 11.2.12.2. Products
- 11.2.12.3. SWOT Analysis
- 11.2.12.4. Recent Developments
- 11.2.12.5. Financials (Based on Availability)
- 11.2.13 SonicWall
- 11.2.13.1. Overview
- 11.2.13.2. Products
- 11.2.13.3. SWOT Analysis
- 11.2.13.4. Recent Developments
- 11.2.13.5. Financials (Based on Availability)
- 11.2.14 Sophos
- 11.2.14.1. Overview
- 11.2.14.2. Products
- 11.2.14.3. SWOT Analysis
- 11.2.14.4. Recent Developments
- 11.2.14.5. Financials (Based on Availability)
- 11.2.15 Sangfor
- 11.2.15.1. Overview
- 11.2.15.2. Products
- 11.2.15.3. SWOT Analysis
- 11.2.15.4. Recent Developments
- 11.2.15.5. Financials (Based on Availability)
- 11.2.16 Venustech
- 11.2.16.1. Overview
- 11.2.16.2. Products
- 11.2.16.3. SWOT Analysis
- 11.2.16.4. Recent Developments
- 11.2.16.5. Financials (Based on Availability)
- 11.2.17 Zyxel Communications
- 11.2.17.1. Overview
- 11.2.17.2. Products
- 11.2.17.3. SWOT Analysis
- 11.2.17.4. Recent Developments
- 11.2.17.5. Financials (Based on Availability)
- 11.2.18 Barracuda
- 11.2.18.1. Overview
- 11.2.18.2. Products
- 11.2.18.3. SWOT Analysis
- 11.2.18.4. Recent Developments
- 11.2.18.5. Financials (Based on Availability)
- 11.2.19 Forcepoint
- 11.2.19.1. Overview
- 11.2.19.2. Products
- 11.2.19.3. SWOT Analysis
- 11.2.19.4. Recent Developments
- 11.2.19.5. Financials (Based on Availability)
- 11.2.20 Microsoft
- 11.2.20.1. Overview
- 11.2.20.2. Products
- 11.2.20.3. SWOT Analysis
- 11.2.20.4. Recent Developments
- 11.2.20.5. Financials (Based on Availability)
- 11.2.21 Stormshield
- 11.2.21.1. Overview
- 11.2.21.2. Products
- 11.2.21.3. SWOT Analysis
- 11.2.21.4. Recent Developments
- 11.2.21.5. Financials (Based on Availability)
- 11.2.22 WatchGuard
- 11.2.22.1. Overview
- 11.2.22.2. Products
- 11.2.22.3. SWOT Analysis
- 11.2.22.4. Recent Developments
- 11.2.22.5. Financials (Based on Availability)
- 11.2.23 Symantec
- 11.2.23.1. Overview
- 11.2.23.2. Products
- 11.2.23.3. SWOT Analysis
- 11.2.23.4. Recent Developments
- 11.2.23.5. Financials (Based on Availability)
- 11.2.1 AhnLab
List of Figures
- Figure 1: Global Network Firewalls Revenue Breakdown (million, %) by Region 2024 & 2032
- Figure 2: North America Network Firewalls Revenue (million), by Application 2024 & 2032
- Figure 3: North America Network Firewalls Revenue Share (%), by Application 2024 & 2032
- Figure 4: North America Network Firewalls Revenue (million), by Types 2024 & 2032
- Figure 5: North America Network Firewalls Revenue Share (%), by Types 2024 & 2032
- Figure 6: North America Network Firewalls Revenue (million), by Country 2024 & 2032
- Figure 7: North America Network Firewalls Revenue Share (%), by Country 2024 & 2032
- Figure 8: South America Network Firewalls Revenue (million), by Application 2024 & 2032
- Figure 9: South America Network Firewalls Revenue Share (%), by Application 2024 & 2032
- Figure 10: South America Network Firewalls Revenue (million), by Types 2024 & 2032
- Figure 11: South America Network Firewalls Revenue Share (%), by Types 2024 & 2032
- Figure 12: South America Network Firewalls Revenue (million), by Country 2024 & 2032
- Figure 13: South America Network Firewalls Revenue Share (%), by Country 2024 & 2032
- Figure 14: Europe Network Firewalls Revenue (million), by Application 2024 & 2032
- Figure 15: Europe Network Firewalls Revenue Share (%), by Application 2024 & 2032
- Figure 16: Europe Network Firewalls Revenue (million), by Types 2024 & 2032
- Figure 17: Europe Network Firewalls Revenue Share (%), by Types 2024 & 2032
- Figure 18: Europe Network Firewalls Revenue (million), by Country 2024 & 2032
- Figure 19: Europe Network Firewalls Revenue Share (%), by Country 2024 & 2032
- Figure 20: Middle East & Africa Network Firewalls Revenue (million), by Application 2024 & 2032
- Figure 21: Middle East & Africa Network Firewalls Revenue Share (%), by Application 2024 & 2032
- Figure 22: Middle East & Africa Network Firewalls Revenue (million), by Types 2024 & 2032
- Figure 23: Middle East & Africa Network Firewalls Revenue Share (%), by Types 2024 & 2032
- Figure 24: Middle East & Africa Network Firewalls Revenue (million), by Country 2024 & 2032
- Figure 25: Middle East & Africa Network Firewalls Revenue Share (%), by Country 2024 & 2032
- Figure 26: Asia Pacific Network Firewalls Revenue (million), by Application 2024 & 2032
- Figure 27: Asia Pacific Network Firewalls Revenue Share (%), by Application 2024 & 2032
- Figure 28: Asia Pacific Network Firewalls Revenue (million), by Types 2024 & 2032
- Figure 29: Asia Pacific Network Firewalls Revenue Share (%), by Types 2024 & 2032
- Figure 30: Asia Pacific Network Firewalls Revenue (million), by Country 2024 & 2032
- Figure 31: Asia Pacific Network Firewalls Revenue Share (%), by Country 2024 & 2032
List of Tables
- Table 1: Global Network Firewalls Revenue million Forecast, by Region 2019 & 2032
- Table 2: Global Network Firewalls Revenue million Forecast, by Application 2019 & 2032
- Table 3: Global Network Firewalls Revenue million Forecast, by Types 2019 & 2032
- Table 4: Global Network Firewalls Revenue million Forecast, by Region 2019 & 2032
- Table 5: Global Network Firewalls Revenue million Forecast, by Application 2019 & 2032
- Table 6: Global Network Firewalls Revenue million Forecast, by Types 2019 & 2032
- Table 7: Global Network Firewalls Revenue million Forecast, by Country 2019 & 2032
- Table 8: United States Network Firewalls Revenue (million) Forecast, by Application 2019 & 2032
- Table 9: Canada Network Firewalls Revenue (million) Forecast, by Application 2019 & 2032
- Table 10: Mexico Network Firewalls Revenue (million) Forecast, by Application 2019 & 2032
- Table 11: Global Network Firewalls Revenue million Forecast, by Application 2019 & 2032
- Table 12: Global Network Firewalls Revenue million Forecast, by Types 2019 & 2032
- Table 13: Global Network Firewalls Revenue million Forecast, by Country 2019 & 2032
- Table 14: Brazil Network Firewalls Revenue (million) Forecast, by Application 2019 & 2032
- Table 15: Argentina Network Firewalls Revenue (million) Forecast, by Application 2019 & 2032
- Table 16: Rest of South America Network Firewalls Revenue (million) Forecast, by Application 2019 & 2032
- Table 17: Global Network Firewalls Revenue million Forecast, by Application 2019 & 2032
- Table 18: Global Network Firewalls Revenue million Forecast, by Types 2019 & 2032
- Table 19: Global Network Firewalls Revenue million Forecast, by Country 2019 & 2032
- Table 20: United Kingdom Network Firewalls Revenue (million) Forecast, by Application 2019 & 2032
- Table 21: Germany Network Firewalls Revenue (million) Forecast, by Application 2019 & 2032
- Table 22: France Network Firewalls Revenue (million) Forecast, by Application 2019 & 2032
- Table 23: Italy Network Firewalls Revenue (million) Forecast, by Application 2019 & 2032
- Table 24: Spain Network Firewalls Revenue (million) Forecast, by Application 2019 & 2032
- Table 25: Russia Network Firewalls Revenue (million) Forecast, by Application 2019 & 2032
- Table 26: Benelux Network Firewalls Revenue (million) Forecast, by Application 2019 & 2032
- Table 27: Nordics Network Firewalls Revenue (million) Forecast, by Application 2019 & 2032
- Table 28: Rest of Europe Network Firewalls Revenue (million) Forecast, by Application 2019 & 2032
- Table 29: Global Network Firewalls Revenue million Forecast, by Application 2019 & 2032
- Table 30: Global Network Firewalls Revenue million Forecast, by Types 2019 & 2032
- Table 31: Global Network Firewalls Revenue million Forecast, by Country 2019 & 2032
- Table 32: Turkey Network Firewalls Revenue (million) Forecast, by Application 2019 & 2032
- Table 33: Israel Network Firewalls Revenue (million) Forecast, by Application 2019 & 2032
- Table 34: GCC Network Firewalls Revenue (million) Forecast, by Application 2019 & 2032
- Table 35: North Africa Network Firewalls Revenue (million) Forecast, by Application 2019 & 2032
- Table 36: South Africa Network Firewalls Revenue (million) Forecast, by Application 2019 & 2032
- Table 37: Rest of Middle East & Africa Network Firewalls Revenue (million) Forecast, by Application 2019 & 2032
- Table 38: Global Network Firewalls Revenue million Forecast, by Application 2019 & 2032
- Table 39: Global Network Firewalls Revenue million Forecast, by Types 2019 & 2032
- Table 40: Global Network Firewalls Revenue million Forecast, by Country 2019 & 2032
- Table 41: China Network Firewalls Revenue (million) Forecast, by Application 2019 & 2032
- Table 42: India Network Firewalls Revenue (million) Forecast, by Application 2019 & 2032
- Table 43: Japan Network Firewalls Revenue (million) Forecast, by Application 2019 & 2032
- Table 44: South Korea Network Firewalls Revenue (million) Forecast, by Application 2019 & 2032
- Table 45: ASEAN Network Firewalls Revenue (million) Forecast, by Application 2019 & 2032
- Table 46: Oceania Network Firewalls Revenue (million) Forecast, by Application 2019 & 2032
- Table 47: Rest of Asia Pacific Network Firewalls Revenue (million) Forecast, by Application 2019 & 2032
Frequently Asked Questions
1. What is the projected Compound Annual Growth Rate (CAGR) of the Network Firewalls?
The projected CAGR is approximately XX%.
2. Which companies are prominent players in the Network Firewalls?
Key companies in the market include AhnLab, Check Point Software Technologies, Cisco, Fortinet, GajShield, H3C, Hillstone Networks, Huawei, Juniper Networks, NSFOCUS, Palo Alto Networks, Qi An Xin Group, SonicWall, Sophos, Sangfor, Venustech, Zyxel Communications, Barracuda, Forcepoint, Microsoft, Stormshield, WatchGuard, Symantec.
3. What are the main segments of the Network Firewalls?
The market segments include Application, Types.
4. Can you provide details about the market size?
The market size is estimated to be USD XXX million as of 2022.
5. What are some drivers contributing to market growth?
N/A
6. What are the notable trends driving market growth?
N/A
7. Are there any restraints impacting market growth?
N/A
8. Can you provide examples of recent developments in the market?
N/A
9. What pricing options are available for accessing the report?
Pricing options include single-user, multi-user, and enterprise licenses priced at USD 3350.00, USD 5025.00, and USD 6700.00 respectively.
10. Is the market size provided in terms of value or volume?
The market size is provided in terms of value, measured in million.
11. Are there any specific market keywords associated with the report?
Yes, the market keyword associated with the report is "Network Firewalls," which aids in identifying and referencing the specific market segment covered.
12. How do I determine which pricing option suits my needs best?
The pricing options vary based on user requirements and access needs. Individual users may opt for single-user licenses, while businesses requiring broader access may choose multi-user or enterprise licenses for cost-effective access to the report.
13. Are there any additional resources or data provided in the Network Firewalls report?
While the report offers comprehensive insights, it's advisable to review the specific contents or supplementary materials provided to ascertain if additional resources or data are available.
14. How can I stay updated on further developments or reports in the Network Firewalls?
To stay informed about further developments, trends, and reports in the Network Firewalls, consider subscribing to industry newsletters, following relevant companies and organizations, or regularly checking reputable industry news sources and publications.
Methodology
Step 1 - Identification of Relevant Samples Size from Population Database


Step 2 - Approaches for Defining Global Market Size (Value, Volume* & Price*)

Note*: In applicable scenarios
Step 3 - Data Sources
Primary Research
- Web Analytics
- Survey Reports
- Research Institute
- Latest Research Reports
- Opinion Leaders
Secondary Research
- Annual Reports
- White Paper
- Latest Press Release
- Industry Association
- Paid Database
- Investor Presentations

Step 4 - Data Triangulation
Involves using different sources of information in order to increase the validity of a study
These sources are likely to be stakeholders in a program - participants, other researchers, program staff, other community members, and so on.
Then we put all data in single framework & apply various statistical tools to find out the dynamic on the market.
During the analysis stage, feedback from the stakeholder groups would be compared to determine areas of agreement as well as areas of divergence


