

Key Insights
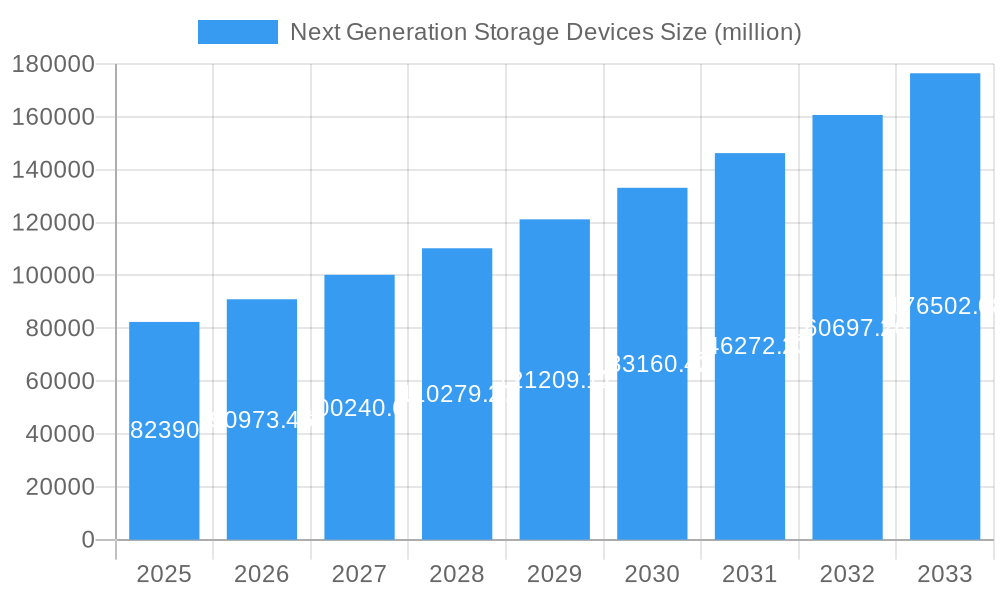
The Next Generation Storage Devices market is experiencing robust growth, projected to reach \$82.39 billion in 2025 and maintain a Compound Annual Growth Rate (CAGR) of 10.5% from 2025 to 2033. This expansion is fueled by several key drivers. The increasing volume of data generated across various sectors, including healthcare, finance, and entertainment, necessitates efficient and scalable storage solutions. The rising adoption of cloud computing and the shift towards hybrid cloud environments further accelerates market growth. Businesses are increasingly seeking solutions that offer improved performance, enhanced security, and reduced operational costs. Advancements in technologies such as NVMe (Non-Volatile Memory Express) and the proliferation of software-defined storage are also contributing factors. Competition in the market is fierce, with established players like Dell, HPE, and NetApp alongside newer entrants like Nutanix and Pure Storage vying for market share. The market is segmented based on storage type (e.g., flash, disk, cloud), deployment model (on-premises, cloud), and industry vertical. While challenges remain, such as the complexity of integrating new technologies and managing data security across diverse platforms, the overall market trajectory remains strongly positive.
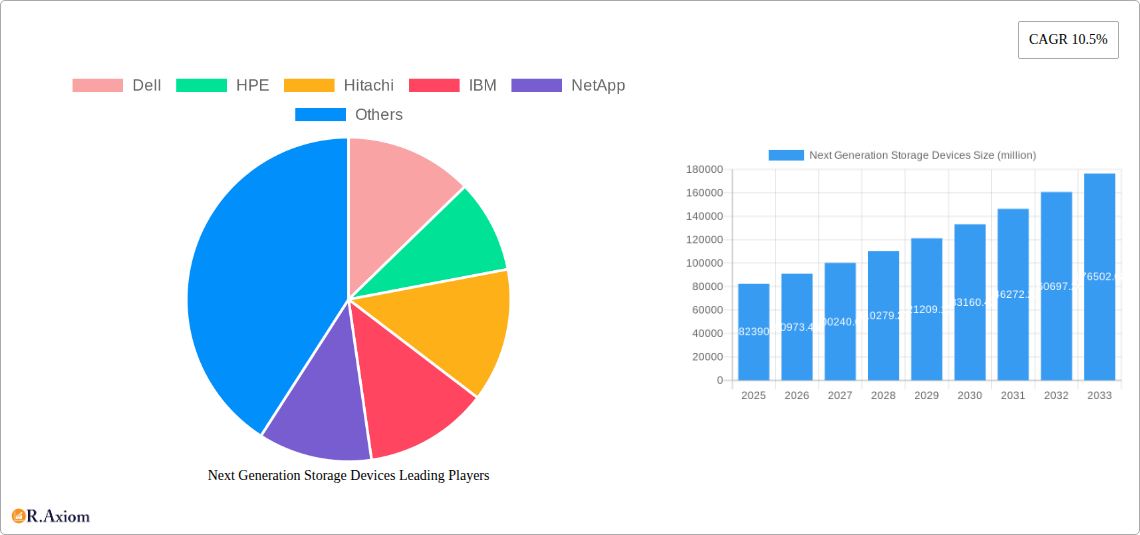
Next Generation Storage Devices Market Size (In Billion)
The forecast period of 2025-2033 will witness continued innovation in storage technologies, with a focus on improving data management capabilities, enhancing scalability and reducing latency. We expect to see increased adoption of AI and machine learning in storage management systems to optimize performance and reduce costs. The market will likely see consolidation amongst smaller players, leading to a more concentrated vendor landscape. Geographical expansion will continue, particularly in emerging markets in Asia-Pacific and Latin America, driven by increasing digitalization and infrastructure development. Focus will also shift towards sustainable and environmentally friendly storage solutions as businesses embrace their corporate social responsibility initiatives. The overall market outlook remains optimistic, with significant growth potential over the next decade, propelled by the unrelenting growth of data and the evolution of enterprise IT infrastructure.
Next Generation Storage Devices Company Market Share
This comprehensive report provides an in-depth analysis of the Next Generation Storage Devices market, offering invaluable insights for industry stakeholders, investors, and strategists. The study covers the period from 2019 to 2033, with a focus on the forecast period from 2025 to 2033 and a base year of 2025. The report leverages extensive primary and secondary research to deliver accurate market sizing, growth projections, and competitive landscape analysis. It examines key trends, challenges, and opportunities shaping the future of next-generation storage, including NVMe, storage-class memory, and distributed storage solutions. This report is essential for understanding the evolving dynamics of this rapidly growing market segment.
Next Generation Storage Devices Market Concentration & Innovation
The next-generation storage devices market is characterized by a moderately concentrated landscape, with a few major players holding significant market share. In 2025, the top five companies—Dell, HPE, NetApp, IBM, and Pure Storage—are estimated to collectively account for approximately 60% of the $xx million market. However, the market is witnessing increased innovation, driven by the need for higher performance, scalability, and cost efficiency. Key innovation drivers include the adoption of NVMe technology, the emergence of storage-class memory (SCM), and advancements in software-defined storage. Regulatory frameworks concerning data privacy and security are significantly influencing market dynamics, while the rise of cloud computing and the increasing availability of affordable alternatives such as cloud storage services present both opportunities and challenges. Mergers and acquisitions (M&A) activity has been moderate, with deal values totaling approximately $xx million in 2024, primarily focused on consolidating technology and expanding market reach. The ongoing trend of consolidation is likely to further shape market dynamics in the coming years.
- Market Share (2025): Dell (18%), HPE (15%), NetApp (12%), IBM (10%), Pure Storage (5%), Others (40%)
- M&A Activity (2019-2024): Total deal value approximately $xx million
Next Generation Storage Devices Industry Trends & Insights
The next-generation storage devices market is experiencing robust growth, driven by several factors. The increasing adoption of cloud computing and big data analytics is fueling demand for high-performance, scalable storage solutions. The compound annual growth rate (CAGR) is projected to be approximately 15% from 2025 to 2033, with the market expected to reach $xx million by 2033. Technological disruptions, such as the widespread adoption of NVMe and the emergence of SCM, are revolutionizing storage performance and efficiency. Consumer preferences are shifting towards more agile, flexible, and cost-effective storage solutions, driving demand for cloud-based and software-defined storage. Competitive dynamics are marked by ongoing innovation and strategic partnerships, with major players investing heavily in R&D to maintain a competitive edge. Market penetration of NVMe-based storage is expected to reach 40% by 2033, indicating significant market transformation. The increasing demand for data security and disaster recovery solutions is further driving market growth.
Dominant Markets & Segments in Next Generation Storage Devices
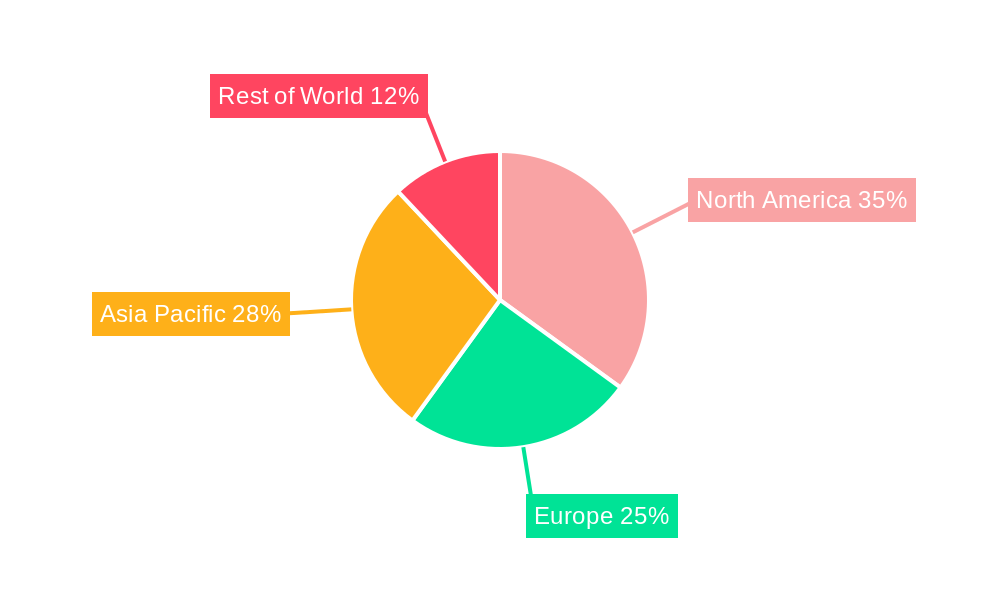
The North American region currently holds the dominant position in the next-generation storage devices market, accounting for approximately 40% of the global market share in 2025. This dominance is primarily attributed to the high concentration of technology companies, significant investments in IT infrastructure, and strong demand from various industry verticals. Key drivers for this regional dominance include:
- Robust IT infrastructure: Extensive investments in data centers and cloud infrastructure.
- High technology adoption: Early adoption of new technologies, including NVMe and SCM.
- Stringent data privacy regulations: Driving demand for secure storage solutions.
- Strong economic growth: Fostering high levels of investment in IT infrastructure.
Europe and Asia Pacific are also witnessing significant growth, driven by increasing digitalization and rising demand for cloud-based storage solutions. The enterprise segment is the largest end-user segment, driven by the need for robust and scalable storage solutions to manage growing data volumes.
Next Generation Storage Devices Product Developments
Recent product innovations in the next-generation storage devices market focus on improving performance, scalability, and cost efficiency. NVMe-based solid-state drives (SSDs) are becoming increasingly prevalent, offering significant speed improvements compared to traditional SATA SSDs. The emergence of storage-class memory (SCM) promises to bridge the performance gap between DRAM and NAND flash, enabling even faster data access speeds. Software-defined storage (SDS) solutions are gaining traction due to their flexibility and scalability, allowing businesses to adapt their storage infrastructure to changing needs. These advancements are improving the market fit by enabling businesses to manage increasingly large data volumes and enhance overall IT efficiency.
Report Scope & Segmentation Analysis
This report segments the next-generation storage devices market based on several key parameters:
By Type: This segment includes NVMe SSDs, SATA SSDs, HDDs, and emerging technologies like SCM. The NVMe SSD segment is projected to experience the highest growth rate.
By Application: This segment includes enterprise storage, cloud storage, and consumer storage. Enterprise storage holds the largest market share, driven by the demand for high-capacity and high-performance solutions.
By End-User: This includes various industries such as BFSI, healthcare, government, and others, with BFSI being the leading end-user segment due to the large volumes of transactional data they handle. Growth projections vary across these segments.
By Geography: This includes detailed analysis by region and country, focusing on North America, Europe, Asia Pacific, and other regions. Competitive dynamics vary across these regions. The market size is broken down by each segment for detailed analysis.
Key Drivers of Next Generation Storage Devices Growth
Several key factors contribute to the growth of the next-generation storage devices market. The exponential growth of data, driven by the increasing adoption of cloud computing, IoT, and big data analytics, is a primary driver. The demand for higher performance and faster data access speeds is compelling the adoption of NVMe and SCM technologies. Government initiatives promoting digital transformation and investments in IT infrastructure are further boosting market growth. Finally, decreasing costs of SSDs and advancements in software-defined storage are making these technologies more accessible to a broader range of users.
Challenges in the Next Generation Storage Devices Sector
The next-generation storage devices sector faces several challenges. The high initial investment costs associated with NVMe and SCM technologies can be a barrier for smaller businesses. The complexity of implementing and managing these advanced storage solutions can also be a deterrent. Competition from established players and the emergence of new entrants in the market create competitive pressures, affecting profitability. Supply chain disruptions and the rising costs of raw materials can impact the availability and cost of storage devices.
Emerging Opportunities in Next Generation Storage Devices
Several emerging opportunities exist in the next-generation storage devices market. The growing adoption of edge computing and AI/ML applications presents significant opportunities for high-performance, low-latency storage solutions. The increasing demand for data security and disaster recovery solutions is driving demand for advanced data protection and backup technologies. The development of new storage technologies, such as DNA storage, offers potentially transformative long-term opportunities. The growth of the cloud storage market also offers significant expansion opportunities.
Leading Players in the Next Generation Storage Devices Market
- Dell
- HPE
- Hitachi
- IBM
- NetApp
- Nutanix
- Oracle StorageTek
- Pure Storage
- Tintri
- Toshiba
- Carbonite
- SugarSync
- Dropbox
- JustCloud
- Norton
- SpiderOak
- OpenDrive
- Adrive
- Reduxio
- AMI StorTrends
- Tegile Systems
- Idrive
- Microsoft
Key Developments in Next Generation Storage Devices Industry
- Q4 2024: Dell announces a new NVMe-based storage array with enhanced performance capabilities.
- Q1 2025: HPE launches a software-defined storage platform integrating AI-powered data management capabilities.
- Q2 2025: NetApp acquires a smaller storage startup specializing in data virtualization technology.
- Q3 2025: IBM releases a new generation of storage-class memory (SCM) based storage solutions.
Strategic Outlook for Next Generation Storage Devices Market
The next-generation storage devices market is poised for continued growth, driven by increasing data volumes, technological advancements, and growing adoption across various industries. The market will be shaped by the ongoing adoption of NVMe, SCM, and software-defined storage, leading to greater efficiency, performance, and scalability. The increasing focus on data security and disaster recovery will drive demand for robust and reliable storage solutions. The market presents significant opportunities for companies that can innovate, adapt to evolving consumer preferences, and leverage emerging technologies to deliver advanced storage solutions. The long-term outlook for the market remains positive, with substantial growth potential in the coming years.
Next Generation Storage Devices Segmentation
-
1. Application
- 1.1. BFSI
- 1.2. Retail
- 1.3. IT & Telecommunication
- 1.4. Healthcare
- 1.5. Government
- 1.6. Education
- 1.7. Media & Entertainment
- 1.8. Others
-
2. Types
- 2.1. Magnetic Storage
- 2.2. Solid-state Storage
- 2.3. Cloud-based Storage
- 2.4. Hybrid Array
Next Generation Storage Devices Segmentation By Geography
-
1. North America
- 1.1. United States
- 1.2. Canada
- 1.3. Mexico
-
2. South America
- 2.1. Brazil
- 2.2. Argentina
- 2.3. Rest of South America
-
3. Europe
- 3.1. United Kingdom
- 3.2. Germany
- 3.3. France
- 3.4. Italy
- 3.5. Spain
- 3.6. Russia
- 3.7. Benelux
- 3.8. Nordics
- 3.9. Rest of Europe
-
4. Middle East & Africa
- 4.1. Turkey
- 4.2. Israel
- 4.3. GCC
- 4.4. North Africa
- 4.5. South Africa
- 4.6. Rest of Middle East & Africa
-
5. Asia Pacific
- 5.1. China
- 5.2. India
- 5.3. Japan
- 5.4. South Korea
- 5.5. ASEAN
- 5.6. Oceania
- 5.7. Rest of Asia Pacific
Next Generation Storage Devices Regional Market Share
Geographic Coverage of Next Generation Storage Devices
Next Generation Storage Devices REPORT HIGHLIGHTS
| Aspects | Details |
|---|---|
| Study Period | 2020-2034 |
| Base Year | 2025 |
| Estimated Year | 2026 |
| Forecast Period | 2026-2034 |
| Historical Period | 2020-2025 |
| Growth Rate | CAGR of 10.5% from 2020-2034 |
| Segmentation |
|
Table of Contents
- 1. Introduction
- 1.1. Research Scope
- 1.2. Market Segmentation
- 1.3. Research Objective
- 1.4. Definitions and Assumptions
- 2. Executive Summary
- 2.1. Market Snapshot
- 3. Market Dynamics
- 3.1. Market Drivers
- 3.2. Market Restrains
- 3.3. Market Trends
- 3.4. Market Opportunities
- 4. Market Factor Analysis
- 4.1. Porters Five Forces
- 4.1.1. Bargaining Power of Suppliers
- 4.1.2. Bargaining Power of Buyers
- 4.1.3. Threat of New Entrants
- 4.1.4. Threat of Substitutes
- 4.1.5. Competitive Rivalry
- 4.2. PESTEL analysis
- 4.3. BCG Analysis
- 4.3.1. Stars (High Growth, High Market Share)
- 4.3.2. Cash Cows (Low Growth, High Market Share)
- 4.3.3. Question Mark (High Growth, Low Market Share)
- 4.3.4. Dogs (Low Growth, Low Market Share)
- 4.4. Ansoff Matrix Analysis
- 4.5. Supply Chain Analysis
- 4.6. Regulatory Landscape
- 4.7. Current Market Potential and Opportunity Assessment (TAM–SAM–SOM Framework)
- 4.8. RAX Analyst Note
- 4.1. Porters Five Forces
- 5. Market Analysis, Insights and Forecast 2021-2033
- 5.1. Market Analysis, Insights and Forecast - by Application
- 5.1.1. BFSI
- 5.1.2. Retail
- 5.1.3. IT & Telecommunication
- 5.1.4. Healthcare
- 5.1.5. Government
- 5.1.6. Education
- 5.1.7. Media & Entertainment
- 5.1.8. Others
- 5.2. Market Analysis, Insights and Forecast - by Types
- 5.2.1. Magnetic Storage
- 5.2.2. Solid-state Storage
- 5.2.3. Cloud-based Storage
- 5.2.4. Hybrid Array
- 5.3. Market Analysis, Insights and Forecast - by Region
- 5.3.1. North America
- 5.3.2. South America
- 5.3.3. Europe
- 5.3.4. Middle East & Africa
- 5.3.5. Asia Pacific
- 5.1. Market Analysis, Insights and Forecast - by Application
- 6. Global Next Generation Storage Devices Analysis, Insights and Forecast, 2021-2033
- 6.1. Market Analysis, Insights and Forecast - by Application
- 6.1.1. BFSI
- 6.1.2. Retail
- 6.1.3. IT & Telecommunication
- 6.1.4. Healthcare
- 6.1.5. Government
- 6.1.6. Education
- 6.1.7. Media & Entertainment
- 6.1.8. Others
- 6.2. Market Analysis, Insights and Forecast - by Types
- 6.2.1. Magnetic Storage
- 6.2.2. Solid-state Storage
- 6.2.3. Cloud-based Storage
- 6.2.4. Hybrid Array
- 6.1. Market Analysis, Insights and Forecast - by Application
- 7. North America Next Generation Storage Devices Analysis, Insights and Forecast, 2020-2032
- 7.1. Market Analysis, Insights and Forecast - by Application
- 7.1.1. BFSI
- 7.1.2. Retail
- 7.1.3. IT & Telecommunication
- 7.1.4. Healthcare
- 7.1.5. Government
- 7.1.6. Education
- 7.1.7. Media & Entertainment
- 7.1.8. Others
- 7.2. Market Analysis, Insights and Forecast - by Types
- 7.2.1. Magnetic Storage
- 7.2.2. Solid-state Storage
- 7.2.3. Cloud-based Storage
- 7.2.4. Hybrid Array
- 7.1. Market Analysis, Insights and Forecast - by Application
- 8. South America Next Generation Storage Devices Analysis, Insights and Forecast, 2020-2032
- 8.1. Market Analysis, Insights and Forecast - by Application
- 8.1.1. BFSI
- 8.1.2. Retail
- 8.1.3. IT & Telecommunication
- 8.1.4. Healthcare
- 8.1.5. Government
- 8.1.6. Education
- 8.1.7. Media & Entertainment
- 8.1.8. Others
- 8.2. Market Analysis, Insights and Forecast - by Types
- 8.2.1. Magnetic Storage
- 8.2.2. Solid-state Storage
- 8.2.3. Cloud-based Storage
- 8.2.4. Hybrid Array
- 8.1. Market Analysis, Insights and Forecast - by Application
- 9. Europe Next Generation Storage Devices Analysis, Insights and Forecast, 2020-2032
- 9.1. Market Analysis, Insights and Forecast - by Application
- 9.1.1. BFSI
- 9.1.2. Retail
- 9.1.3. IT & Telecommunication
- 9.1.4. Healthcare
- 9.1.5. Government
- 9.1.6. Education
- 9.1.7. Media & Entertainment
- 9.1.8. Others
- 9.2. Market Analysis, Insights and Forecast - by Types
- 9.2.1. Magnetic Storage
- 9.2.2. Solid-state Storage
- 9.2.3. Cloud-based Storage
- 9.2.4. Hybrid Array
- 9.1. Market Analysis, Insights and Forecast - by Application
- 10. Middle East & Africa Next Generation Storage Devices Analysis, Insights and Forecast, 2020-2032
- 10.1. Market Analysis, Insights and Forecast - by Application
- 10.1.1. BFSI
- 10.1.2. Retail
- 10.1.3. IT & Telecommunication
- 10.1.4. Healthcare
- 10.1.5. Government
- 10.1.6. Education
- 10.1.7. Media & Entertainment
- 10.1.8. Others
- 10.2. Market Analysis, Insights and Forecast - by Types
- 10.2.1. Magnetic Storage
- 10.2.2. Solid-state Storage
- 10.2.3. Cloud-based Storage
- 10.2.4. Hybrid Array
- 10.1. Market Analysis, Insights and Forecast - by Application
- 11. Asia Pacific Next Generation Storage Devices Analysis, Insights and Forecast, 2020-2032
- 11.1. Market Analysis, Insights and Forecast - by Application
- 11.1.1. BFSI
- 11.1.2. Retail
- 11.1.3. IT & Telecommunication
- 11.1.4. Healthcare
- 11.1.5. Government
- 11.1.6. Education
- 11.1.7. Media & Entertainment
- 11.1.8. Others
- 11.2. Market Analysis, Insights and Forecast - by Types
- 11.2.1. Magnetic Storage
- 11.2.2. Solid-state Storage
- 11.2.3. Cloud-based Storage
- 11.2.4. Hybrid Array
- 11.1. Market Analysis, Insights and Forecast - by Application
- 12. Competitive Analysis
- 12.1. Company Profiles
- 12.1.1 Dell
- 12.1.1.1. Company Overview
- 12.1.1.2. Products
- 12.1.1.3. Company Financials
- 12.1.1.4. SWOT Analysis
- 12.1.2 HPE
- 12.1.2.1. Company Overview
- 12.1.2.2. Products
- 12.1.2.3. Company Financials
- 12.1.2.4. SWOT Analysis
- 12.1.3 Hitachi
- 12.1.3.1. Company Overview
- 12.1.3.2. Products
- 12.1.3.3. Company Financials
- 12.1.3.4. SWOT Analysis
- 12.1.4 IBM
- 12.1.4.1. Company Overview
- 12.1.4.2. Products
- 12.1.4.3. Company Financials
- 12.1.4.4. SWOT Analysis
- 12.1.5 NetApp
- 12.1.5.1. Company Overview
- 12.1.5.2. Products
- 12.1.5.3. Company Financials
- 12.1.5.4. SWOT Analysis
- 12.1.6 Nutanix
- 12.1.6.1. Company Overview
- 12.1.6.2. Products
- 12.1.6.3. Company Financials
- 12.1.6.4. SWOT Analysis
- 12.1.7 Oracle StorageTek
- 12.1.7.1. Company Overview
- 12.1.7.2. Products
- 12.1.7.3. Company Financials
- 12.1.7.4. SWOT Analysis
- 12.1.8 Pure Storage
- 12.1.8.1. Company Overview
- 12.1.8.2. Products
- 12.1.8.3. Company Financials
- 12.1.8.4. SWOT Analysis
- 12.1.9 Tintri
- 12.1.9.1. Company Overview
- 12.1.9.2. Products
- 12.1.9.3. Company Financials
- 12.1.9.4. SWOT Analysis
- 12.1.10 Toshiba
- 12.1.10.1. Company Overview
- 12.1.10.2. Products
- 12.1.10.3. Company Financials
- 12.1.10.4. SWOT Analysis
- 12.1.11 Carbonite
- 12.1.11.1. Company Overview
- 12.1.11.2. Products
- 12.1.11.3. Company Financials
- 12.1.11.4. SWOT Analysis
- 12.1.12 NetApp
- 12.1.12.1. Company Overview
- 12.1.12.2. Products
- 12.1.12.3. Company Financials
- 12.1.12.4. SWOT Analysis
- 12.1.13 SugarSync
- 12.1.13.1. Company Overview
- 12.1.13.2. Products
- 12.1.13.3. Company Financials
- 12.1.13.4. SWOT Analysis
- 12.1.14 Dropbox
- 12.1.14.1. Company Overview
- 12.1.14.2. Products
- 12.1.14.3. Company Financials
- 12.1.14.4. SWOT Analysis
- 12.1.15 JustCloud
- 12.1.15.1. Company Overview
- 12.1.15.2. Products
- 12.1.15.3. Company Financials
- 12.1.15.4. SWOT Analysis
- 12.1.16 Norton
- 12.1.16.1. Company Overview
- 12.1.16.2. Products
- 12.1.16.3. Company Financials
- 12.1.16.4. SWOT Analysis
- 12.1.17 SpiderOak
- 12.1.17.1. Company Overview
- 12.1.17.2. Products
- 12.1.17.3. Company Financials
- 12.1.17.4. SWOT Analysis
- 12.1.18 OpenDrive
- 12.1.18.1. Company Overview
- 12.1.18.2. Products
- 12.1.18.3. Company Financials
- 12.1.18.4. SWOT Analysis
- 12.1.19 Adrive
- 12.1.19.1. Company Overview
- 12.1.19.2. Products
- 12.1.19.3. Company Financials
- 12.1.19.4. SWOT Analysis
- 12.1.20 Reduxio
- 12.1.20.1. Company Overview
- 12.1.20.2. Products
- 12.1.20.3. Company Financials
- 12.1.20.4. SWOT Analysis
- 12.1.21 AMI StorTrends
- 12.1.21.1. Company Overview
- 12.1.21.2. Products
- 12.1.21.3. Company Financials
- 12.1.21.4. SWOT Analysis
- 12.1.22 Tegile Systems
- 12.1.22.1. Company Overview
- 12.1.22.2. Products
- 12.1.22.3. Company Financials
- 12.1.22.4. SWOT Analysis
- 12.1.23 Idrive
- 12.1.23.1. Company Overview
- 12.1.23.2. Products
- 12.1.23.3. Company Financials
- 12.1.23.4. SWOT Analysis
- 12.1.24 Microsoft
- 12.1.24.1. Company Overview
- 12.1.24.2. Products
- 12.1.24.3. Company Financials
- 12.1.24.4. SWOT Analysis
- 12.1.1 Dell
- 12.2. Market Entropy
- 12.2.1 Company's Key Areas Served
- 12.2.2 Recent Developments
- 12.3. Company Market Share Analysis 2025
- 12.3.1 Top 5 Companies Market Share Analysis
- 12.3.2 Top 3 Companies Market Share Analysis
- 12.4. List of Potential Customers
- 13. Research Methodology
List of Figures
- Figure 1: Global Next Generation Storage Devices Revenue Breakdown (million, %) by Region 2025 & 2033
- Figure 2: North America Next Generation Storage Devices Revenue (million), by Application 2025 & 2033
- Figure 3: North America Next Generation Storage Devices Revenue Share (%), by Application 2025 & 2033
- Figure 4: North America Next Generation Storage Devices Revenue (million), by Types 2025 & 2033
- Figure 5: North America Next Generation Storage Devices Revenue Share (%), by Types 2025 & 2033
- Figure 6: North America Next Generation Storage Devices Revenue (million), by Country 2025 & 2033
- Figure 7: North America Next Generation Storage Devices Revenue Share (%), by Country 2025 & 2033
- Figure 8: South America Next Generation Storage Devices Revenue (million), by Application 2025 & 2033
- Figure 9: South America Next Generation Storage Devices Revenue Share (%), by Application 2025 & 2033
- Figure 10: South America Next Generation Storage Devices Revenue (million), by Types 2025 & 2033
- Figure 11: South America Next Generation Storage Devices Revenue Share (%), by Types 2025 & 2033
- Figure 12: South America Next Generation Storage Devices Revenue (million), by Country 2025 & 2033
- Figure 13: South America Next Generation Storage Devices Revenue Share (%), by Country 2025 & 2033
- Figure 14: Europe Next Generation Storage Devices Revenue (million), by Application 2025 & 2033
- Figure 15: Europe Next Generation Storage Devices Revenue Share (%), by Application 2025 & 2033
- Figure 16: Europe Next Generation Storage Devices Revenue (million), by Types 2025 & 2033
- Figure 17: Europe Next Generation Storage Devices Revenue Share (%), by Types 2025 & 2033
- Figure 18: Europe Next Generation Storage Devices Revenue (million), by Country 2025 & 2033
- Figure 19: Europe Next Generation Storage Devices Revenue Share (%), by Country 2025 & 2033
- Figure 20: Middle East & Africa Next Generation Storage Devices Revenue (million), by Application 2025 & 2033
- Figure 21: Middle East & Africa Next Generation Storage Devices Revenue Share (%), by Application 2025 & 2033
- Figure 22: Middle East & Africa Next Generation Storage Devices Revenue (million), by Types 2025 & 2033
- Figure 23: Middle East & Africa Next Generation Storage Devices Revenue Share (%), by Types 2025 & 2033
- Figure 24: Middle East & Africa Next Generation Storage Devices Revenue (million), by Country 2025 & 2033
- Figure 25: Middle East & Africa Next Generation Storage Devices Revenue Share (%), by Country 2025 & 2033
- Figure 26: Asia Pacific Next Generation Storage Devices Revenue (million), by Application 2025 & 2033
- Figure 27: Asia Pacific Next Generation Storage Devices Revenue Share (%), by Application 2025 & 2033
- Figure 28: Asia Pacific Next Generation Storage Devices Revenue (million), by Types 2025 & 2033
- Figure 29: Asia Pacific Next Generation Storage Devices Revenue Share (%), by Types 2025 & 2033
- Figure 30: Asia Pacific Next Generation Storage Devices Revenue (million), by Country 2025 & 2033
- Figure 31: Asia Pacific Next Generation Storage Devices Revenue Share (%), by Country 2025 & 2033
List of Tables
- Table 1: Global Next Generation Storage Devices Revenue million Forecast, by Application 2020 & 2033
- Table 2: Global Next Generation Storage Devices Revenue million Forecast, by Types 2020 & 2033
- Table 3: Global Next Generation Storage Devices Revenue million Forecast, by Region 2020 & 2033
- Table 4: Global Next Generation Storage Devices Revenue million Forecast, by Application 2020 & 2033
- Table 5: Global Next Generation Storage Devices Revenue million Forecast, by Types 2020 & 2033
- Table 6: Global Next Generation Storage Devices Revenue million Forecast, by Country 2020 & 2033
- Table 7: United States Next Generation Storage Devices Revenue (million) Forecast, by Application 2020 & 2033
- Table 8: Canada Next Generation Storage Devices Revenue (million) Forecast, by Application 2020 & 2033
- Table 9: Mexico Next Generation Storage Devices Revenue (million) Forecast, by Application 2020 & 2033
- Table 10: Global Next Generation Storage Devices Revenue million Forecast, by Application 2020 & 2033
- Table 11: Global Next Generation Storage Devices Revenue million Forecast, by Types 2020 & 2033
- Table 12: Global Next Generation Storage Devices Revenue million Forecast, by Country 2020 & 2033
- Table 13: Brazil Next Generation Storage Devices Revenue (million) Forecast, by Application 2020 & 2033
- Table 14: Argentina Next Generation Storage Devices Revenue (million) Forecast, by Application 2020 & 2033
- Table 15: Rest of South America Next Generation Storage Devices Revenue (million) Forecast, by Application 2020 & 2033
- Table 16: Global Next Generation Storage Devices Revenue million Forecast, by Application 2020 & 2033
- Table 17: Global Next Generation Storage Devices Revenue million Forecast, by Types 2020 & 2033
- Table 18: Global Next Generation Storage Devices Revenue million Forecast, by Country 2020 & 2033
- Table 19: United Kingdom Next Generation Storage Devices Revenue (million) Forecast, by Application 2020 & 2033
- Table 20: Germany Next Generation Storage Devices Revenue (million) Forecast, by Application 2020 & 2033
- Table 21: France Next Generation Storage Devices Revenue (million) Forecast, by Application 2020 & 2033
- Table 22: Italy Next Generation Storage Devices Revenue (million) Forecast, by Application 2020 & 2033
- Table 23: Spain Next Generation Storage Devices Revenue (million) Forecast, by Application 2020 & 2033
- Table 24: Russia Next Generation Storage Devices Revenue (million) Forecast, by Application 2020 & 2033
- Table 25: Benelux Next Generation Storage Devices Revenue (million) Forecast, by Application 2020 & 2033
- Table 26: Nordics Next Generation Storage Devices Revenue (million) Forecast, by Application 2020 & 2033
- Table 27: Rest of Europe Next Generation Storage Devices Revenue (million) Forecast, by Application 2020 & 2033
- Table 28: Global Next Generation Storage Devices Revenue million Forecast, by Application 2020 & 2033
- Table 29: Global Next Generation Storage Devices Revenue million Forecast, by Types 2020 & 2033
- Table 30: Global Next Generation Storage Devices Revenue million Forecast, by Country 2020 & 2033
- Table 31: Turkey Next Generation Storage Devices Revenue (million) Forecast, by Application 2020 & 2033
- Table 32: Israel Next Generation Storage Devices Revenue (million) Forecast, by Application 2020 & 2033
- Table 33: GCC Next Generation Storage Devices Revenue (million) Forecast, by Application 2020 & 2033
- Table 34: North Africa Next Generation Storage Devices Revenue (million) Forecast, by Application 2020 & 2033
- Table 35: South Africa Next Generation Storage Devices Revenue (million) Forecast, by Application 2020 & 2033
- Table 36: Rest of Middle East & Africa Next Generation Storage Devices Revenue (million) Forecast, by Application 2020 & 2033
- Table 37: Global Next Generation Storage Devices Revenue million Forecast, by Application 2020 & 2033
- Table 38: Global Next Generation Storage Devices Revenue million Forecast, by Types 2020 & 2033
- Table 39: Global Next Generation Storage Devices Revenue million Forecast, by Country 2020 & 2033
- Table 40: China Next Generation Storage Devices Revenue (million) Forecast, by Application 2020 & 2033
- Table 41: India Next Generation Storage Devices Revenue (million) Forecast, by Application 2020 & 2033
- Table 42: Japan Next Generation Storage Devices Revenue (million) Forecast, by Application 2020 & 2033
- Table 43: South Korea Next Generation Storage Devices Revenue (million) Forecast, by Application 2020 & 2033
- Table 44: ASEAN Next Generation Storage Devices Revenue (million) Forecast, by Application 2020 & 2033
- Table 45: Oceania Next Generation Storage Devices Revenue (million) Forecast, by Application 2020 & 2033
- Table 46: Rest of Asia Pacific Next Generation Storage Devices Revenue (million) Forecast, by Application 2020 & 2033
Frequently Asked Questions
1. What is the projected Compound Annual Growth Rate (CAGR) of the Next Generation Storage Devices?
The projected CAGR is approximately 10.5%.
2. Which companies are prominent players in the Next Generation Storage Devices?
Key companies in the market include Dell, HPE, Hitachi, IBM, NetApp, Nutanix, Oracle StorageTek, Pure Storage, Tintri, Toshiba, Carbonite, NetApp, SugarSync, Dropbox, JustCloud, Norton, SpiderOak, OpenDrive, Adrive, Reduxio, AMI StorTrends, Tegile Systems, Idrive, Microsoft.
3. What are the main segments of the Next Generation Storage Devices?
The market segments include Application, Types.
4. Can you provide details about the market size?
The market size is estimated to be USD 82390 million as of 2022.
5. What are some drivers contributing to market growth?
N/A
6. What are the notable trends driving market growth?
N/A
7. Are there any restraints impacting market growth?
N/A
8. Can you provide examples of recent developments in the market?
N/A
9. What pricing options are available for accessing the report?
Pricing options include single-user, multi-user, and enterprise licenses priced at USD 2900.00, USD 4350.00, and USD 5800.00 respectively.
10. Is the market size provided in terms of value or volume?
The market size is provided in terms of value, measured in million.
11. Are there any specific market keywords associated with the report?
Yes, the market keyword associated with the report is "Next Generation Storage Devices," which aids in identifying and referencing the specific market segment covered.
12. How do I determine which pricing option suits my needs best?
The pricing options vary based on user requirements and access needs. Individual users may opt for single-user licenses, while businesses requiring broader access may choose multi-user or enterprise licenses for cost-effective access to the report.
13. Are there any additional resources or data provided in the Next Generation Storage Devices report?
While the report offers comprehensive insights, it's advisable to review the specific contents or supplementary materials provided to ascertain if additional resources or data are available.
14. How can I stay updated on further developments or reports in the Next Generation Storage Devices?
To stay informed about further developments, trends, and reports in the Next Generation Storage Devices, consider subscribing to industry newsletters, following relevant companies and organizations, or regularly checking reputable industry news sources and publications.
Methodology
Step 1 - Identification of Relevant Samples Size from Population Database


Step 2 - Approaches for Defining Global Market Size (Value, Volume* & Price*)

Note*: In applicable scenarios
Step 3 - Data Sources
Primary Research
- Web Analytics
- Survey Reports
- Research Institute
- Latest Research Reports
- Opinion Leaders
Secondary Research
- Annual Reports
- White Paper
- Latest Press Release
- Industry Association
- Paid Database
- Investor Presentations

Step 4 - Data Triangulation
Involves using different sources of information in order to increase the validity of a study
These sources are likely to be stakeholders in a program - participants, other researchers, program staff, other community members, and so on.
Then we put all data in single framework & apply various statistical tools to find out the dynamic on the market.
During the analysis stage, feedback from the stakeholder groups would be compared to determine areas of agreement as well as areas of divergence