

Key Insights
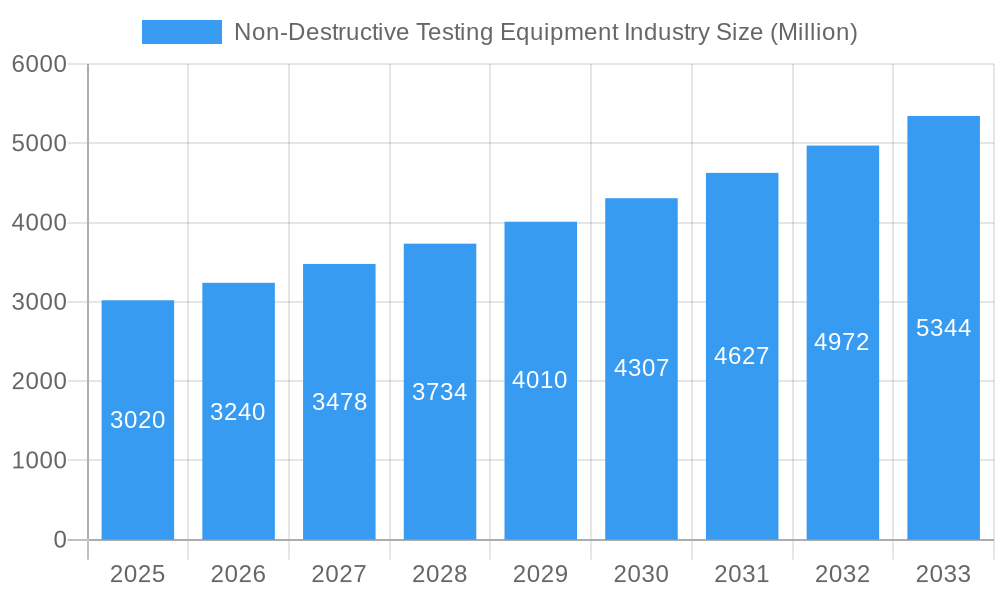
The Non-Destructive Testing (NDT) equipment market, valued at $3.02 billion in 2025, is projected to experience robust growth, driven by increasing demand across diverse sectors. A Compound Annual Growth Rate (CAGR) of 7.20% from 2025 to 2033 indicates a significant expansion, reaching an estimated market value exceeding $5 billion by 2033. This growth is fueled by several key factors: the rising need for infrastructure development and maintenance, particularly in the oil and gas, aerospace, and automotive industries, necessitates rigorous quality control and safety measures, boosting demand for NDT equipment. Stringent regulatory standards and safety compliance mandates across various industries also contribute to the market's expansion. Furthermore, technological advancements in NDT techniques, such as the development of more portable, efficient, and user-friendly equipment, are driving market penetration. Growth is expected to be particularly strong in regions like Asia, driven by significant investments in infrastructure and industrialization in countries such as China and India.
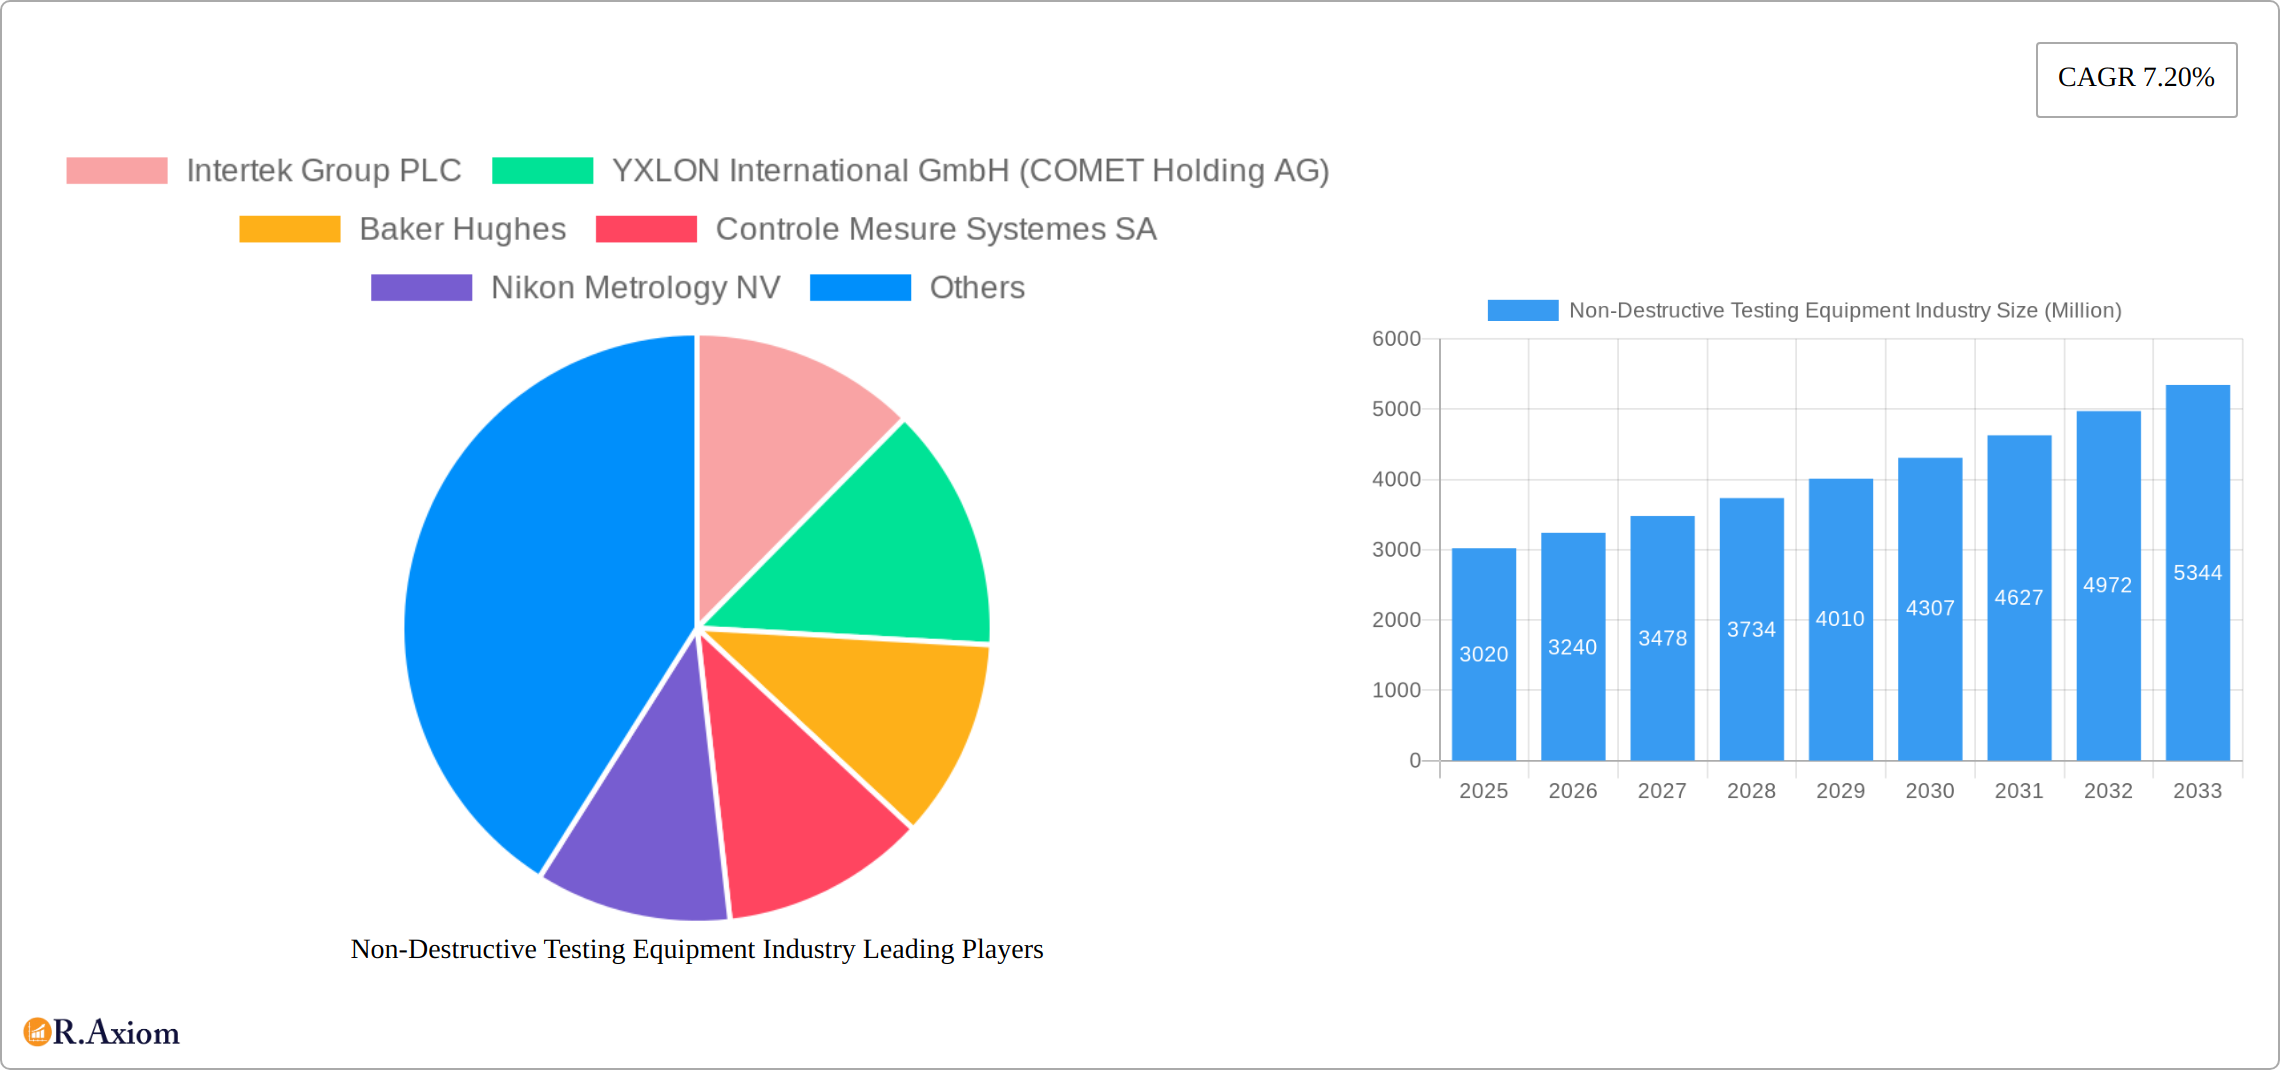
Non-Destructive Testing Equipment Industry Market Size (In Billion)
The market segmentation highlights the prevalence of radiography, ultrasonic, and magnetic particle testing equipment, reflecting established techniques within the industry. However, growth is expected in advanced technologies such as eddy current testing and visual inspection equipment, particularly in niche applications requiring high-precision analysis. The end-user industry segmentation clearly illustrates the significance of oil and gas, power and energy, and aerospace and defense, reflecting the critical role of NDT in ensuring operational safety and asset integrity within these high-risk sectors. While North America and Europe currently hold substantial market shares, the Asia-Pacific region is poised for significant growth, fueled by rapid industrialization and infrastructure development initiatives. Competition within the market is intense, with key players continually innovating and expanding their product portfolios to cater to evolving industry needs. The market's future growth trajectory is optimistic, reflecting the vital role of NDT in ensuring quality, safety, and operational efficiency across multiple sectors.
Non-Destructive Testing Equipment Industry Company Market Share
Non-Destructive Testing (NDT) Equipment Industry Market Report: 2019-2033
This comprehensive report provides a detailed analysis of the Non-Destructive Testing (NDT) Equipment industry, encompassing market size, segmentation, growth drivers, challenges, and key players. The study period covers 2019-2033, with a base year of 2025 and a forecast period of 2025-2033. The report offers actionable insights for industry stakeholders, investors, and businesses operating within this dynamic sector. The global market value is estimated at xx Million in 2025 and is projected to reach xx Million by 2033.
Non-Destructive Testing Equipment Industry Market Concentration & Innovation
The NDT equipment market exhibits a moderately concentrated landscape, with several multinational corporations holding significant market share. Intertek Group PLC, YXLON International GmbH (COMET Holding AG), Baker Hughes, and Fujifilm Corporation are among the leading players, each commanding a substantial portion of the global revenue. Precise market share figures are xx%, xx%, xx%, and xx% respectively, based on 2024 estimates. The industry is characterized by continuous innovation driven by the need for enhanced testing accuracy, improved efficiency, and the development of new technologies to meet evolving end-user requirements. Stringent regulatory frameworks governing safety and quality standards, particularly within sectors like aerospace and energy, significantly influence market dynamics. Furthermore, the increasing adoption of automation and digitalization within the NDT process is a significant driver of innovation, contributing to improved data acquisition and analysis. The presence of substitute technologies, such as advanced imaging techniques, presents competitive challenges. However, the unique capabilities of NDT, in terms of cost-effectiveness and non-invasive inspection, sustain its market position. M&A activities play a crucial role in shaping the industry landscape, with recent deals totaling an estimated xx Million over the past five years, consolidating market share and fostering technological advancements.
- Key Market Players: Intertek Group PLC, YXLON International GmbH (COMET Holding AG), Baker Hughes, Fujifilm Corporation, and others.
- Innovation Drivers: Technological advancements, regulatory compliance, and growing demand for accurate and efficient testing.
- M&A Activity: Consolidation through mergers and acquisitions, resulting in estimated deal values of xx Million over the past five years.
- Regulatory Frameworks: Stringent safety and quality standards impacting market growth and technology adoption.
Non-Destructive Testing Equipment Industry Trends & Insights
The NDT equipment market is experiencing robust growth, driven by several key factors. The increasing demand for infrastructure development, particularly in emerging economies, fuels the need for effective quality control and safety inspections. The expanding aerospace and defense industries contribute significantly to the market's expansion, due to the stringent regulatory requirements and the critical need for defect detection in aerospace components. Furthermore, the stringent safety and quality requirements within the oil and gas sector necessitate consistent non-destructive testing, leading to a large segment of the market. Technological advancements, such as the development of advanced sensors and automated systems, enhance the capabilities of NDT equipment, leading to improved accuracy and efficiency. The global NDT equipment market is expected to experience a Compound Annual Growth Rate (CAGR) of xx% during the forecast period (2025-2033). Market penetration of advanced technologies, such as phased array ultrasonic testing and digital radiography, is steadily increasing, further accelerating market growth. The competitive dynamics are shaped by technological innovation, pricing strategies, and the ability of manufacturers to meet the evolving needs of diverse end-user industries. Consumer preferences are shifting towards advanced, user-friendly equipment with improved data analysis capabilities.
Dominant Markets & Segments in Non-Destructive Testing Equipment Industry
The North American region continues to lead the global NDT equipment market, fueled by sustained high levels of industrial activity across pivotal sectors such as aerospace, oil & gas, and automotive. The Oil & Gas and Aerospace & Defense end-user segments remain the primary revenue generators, driven by increasingly stringent safety mandates and regulatory frameworks. Within the technology landscape, Ultrasonic Testing Equipment and Radiography Testing Equipment maintain their dominant positions, collectively representing a significant portion of the market share, with Ultrasonic Testing Equipment accounting for approximately **[Insert Specific Percentage Here]**% and Radiography Testing Equipment for around **[Insert Specific Percentage Here]**% of the total market revenue.
- Leading Region: North America (driven by strong industrial base, stringent regulations, and high adoption of advanced NDT technologies).
- Leading End-user Industries: Oil and Gas (necessitating regular pipeline and infrastructure inspections due to stringent safety standards) and Aerospace and Defense (requiring rigorous quality control for safety and performance of critical components).
- Leading Technologies: Ultrasonic Testing Equipment and Radiography Testing Equipment (valued for their versatility, cost-effectiveness, and proven reliability across diverse applications).
Non-Destructive Testing Equipment Industry Product Developments
Recent product innovations in the NDT equipment industry focus on enhanced portability, automation, and improved data analysis capabilities. New systems incorporate advanced sensors, AI-powered image processing, and cloud-based data management to improve accuracy, efficiency, and data accessibility. This allows for remote monitoring, real-time analysis, and improved decision-making for end-users. These advancements provide competitive advantages by enhancing inspection speed, reducing operational costs, and minimizing the risk of human error. The market is witnessing a strong focus on integrating advanced technologies to improve the overall efficiency and accuracy of NDT processes.
Report Scope & Segmentation Analysis
This comprehensive report provides an in-depth analysis of the NDT equipment market, meticulously segmented by both technology and end-user industry. The technology segmentation includes Radiography Testing Equipment, Ultrasonic Testing Equipment, Magnetic Particle Testing Equipment, Liquid Penetrant Testing Equipment, Visual Inspection Equipment, Eddy Current Equipment, and Other Emerging Technologies. On the end-user industry front, the market is divided into Oil and Gas, Power and Energy, Aerospace and Defense, Automotive and Transportation, Construction, and Other End-user Industries. For each segment, the report details market size, offers robust growth projections, and examines the competitive landscape, delivering critical insights into prevailing market dynamics and anticipated future trends. Detailed market size data for each technology and end-user segment is extensively elaborated within the full report.
Key Drivers of Non-Destructive Testing Equipment Industry Growth
The NDT equipment market's growth is propelled by several factors. Stringent safety regulations across various industries necessitate thorough inspections. The rising demand for infrastructure development, particularly in emerging economies, significantly boosts the need for quality control. Technological advancements, such as AI-powered image processing and automation, enhance testing accuracy and efficiency. Increasing adoption of advanced NDT techniques further drives market growth.
Challenges in the Non-Destructive Testing Equipment Industry Sector
The industry faces challenges including the high initial investment cost of advanced NDT equipment, the need for skilled personnel to operate and interpret test results, and intense competition from established and emerging players. Supply chain disruptions and fluctuations in raw material prices also impact profitability. Furthermore, regulatory changes and compliance requirements can lead to increased operational costs for businesses.
Emerging Opportunities in Non-Destructive Testing Equipment Industry
The Non-Destructive Testing Equipment Industry is experiencing a surge of innovation, with significant opportunities emerging in the development and widespread adoption of Artificial Intelligence (AI)-powered NDT solutions. These advanced systems promise enhanced accuracy, efficiency, and data interpretation capabilities. Furthermore, there is substantial growth potential in expanding NDT applications into new and developing global markets, alongside the strategic integration of NDT technologies with other inspection methodologies to facilitate holistic asset management. The increasing demand for automated inspection processes and remote monitoring capabilities also presents a fertile ground for market expansion and the introduction of groundbreaking solutions.
Leading Players in the Non-Destructive Testing Equipment Industry Market
- Intertek Group PLC
- YXLON International GmbH (COMET Holding AG)
- Baker Hughes
- Controle Mesure Systemes SA
- Nikon Metrology NV
- Fujifilm Corporation
- Mistras Group Inc
- OkoNDT Group
- Innospection Limited
- Applus+ Laboratories
- Bureau Veritas SA
- Olympus Corporation
- Magnaflux Corp
Key Developments in Non-Destructive Testing Equipment Industry Industry
- May 2023: MP Machinery and Testing unveiled its proprietary material testing equipment designed for the non-destructive determination of material properties, thereby broadening the application scope of NDT across a wider array of industrial sectors.
- May 2023: The American Petroleum Institute (API) formalized Memorandums of Understanding (MoUs) with the American Society for Non-Destructive Testing (ASNT) and the NDT Manufacturers Association (NDTMA). This strategic collaboration aims to elevate the standards of NDT practices and significantly enhance safety within the oil and gas industry, fostering market growth and reinforcing industry best practices.
Strategic Outlook for Non-Destructive Testing Equipment Industry Market
The NDT equipment market is on a trajectory of sustained and robust growth, propelled by continuous technological advancements, accelerating infrastructure development globally, and the ever-tightening safety regulations across diverse industries. The seamless integration of AI, advanced automation, and sophisticated data analytics is set to revolutionize NDT equipment, unlocking novel market opportunities and driving comprehensive industry expansion. A proactive focus on enhancing operational efficiency, improving testing accuracy, and delivering cost-effective solutions will be paramount for maintaining a competitive edge and achieving enduring success in the evolving market landscape.
Non-Destructive Testing Equipment Industry Segmentation
-
1. Technology
- 1.1. Radiography Testing Equipment
- 1.2. Ultrasonic Testing Equipment
- 1.3. Magnetic Particle Testing Equipment
- 1.4. Liquid Penetrant Testing Equipment
- 1.5. Visual Inspection Equipment
- 1.6. Eddy Current Equipment
- 1.7. Other Technologies Equipment
-
2. End-user Industry
- 2.1. Oil and Gas
- 2.2. Power and Energy
- 2.3. Aerospace and Defense
- 2.4. Automotive and Transportation
- 2.5. Construction
- 2.6. Other End-user Industries
Non-Destructive Testing Equipment Industry Segmentation By Geography
-
1. North America
- 1.1. United States
- 1.2. Canada
-
2. Europe
- 2.1. United Kingdom
- 2.2. Germany
- 2.3. France
- 2.4. Russia
- 2.5. Italy
-
3. Asia
- 3.1. China
- 3.2. India
- 3.3. South Korea
- 4. Australia and New Zealand
-
5. Latin America
- 5.1. Mexico
- 5.2. Brazil
- 5.3. Argentina
-
6. Middle East and Africa
- 6.1. Saudi Arabia
- 6.2. United Arab Emirates
- 6.3. Qatar
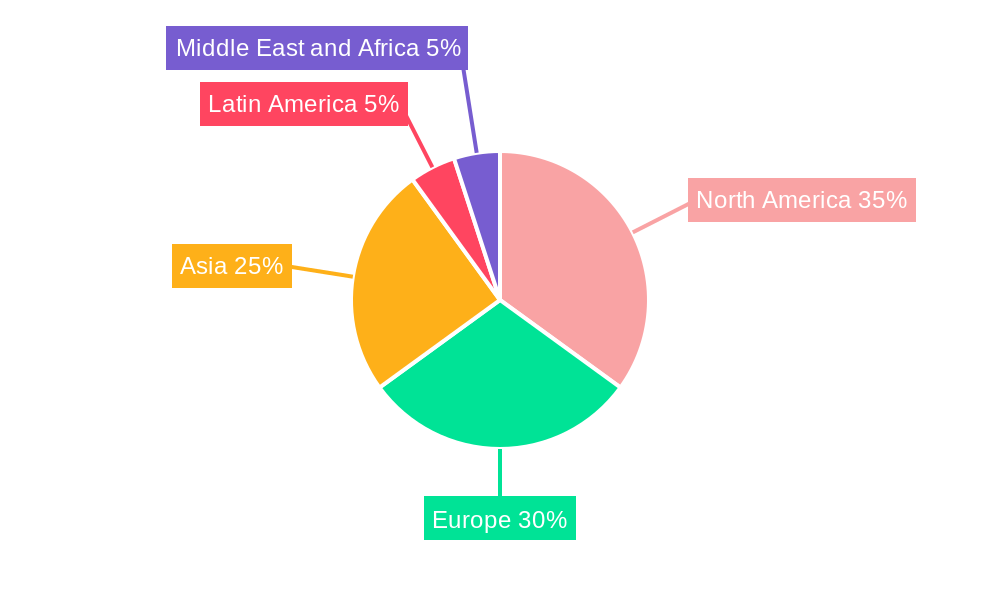
Non-Destructive Testing Equipment Industry Regional Market Share
Geographic Coverage of Non-Destructive Testing Equipment Industry
Non-Destructive Testing Equipment Industry REPORT HIGHLIGHTS
| Aspects | Details |
|---|---|
| Study Period | 2020-2034 |
| Base Year | 2025 |
| Estimated Year | 2026 |
| Forecast Period | 2026-2034 |
| Historical Period | 2020-2025 |
| Growth Rate | CAGR of 7.20% from 2020-2034 |
| Segmentation |
|
Table of Contents
- 1. Introduction
- 1.1. Research Scope
- 1.2. Market Segmentation
- 1.3. Research Objective
- 1.4. Definitions and Assumptions
- 2. Executive Summary
- 2.1. Market Snapshot
- 3. Market Dynamics
- 3.1. Market Drivers
- 3.2. Market Restrains
- 3.3. Market Trends
- 3.4. Market Opportunities
- 4. Market Factor Analysis
- 4.1. Porters Five Forces
- 4.1.1. Bargaining Power of Suppliers
- 4.1.2. Bargaining Power of Buyers
- 4.1.3. Threat of New Entrants
- 4.1.4. Threat of Substitutes
- 4.1.5. Competitive Rivalry
- 4.2. PESTEL analysis
- 4.3. BCG Analysis
- 4.3.1. Stars (High Growth, High Market Share)
- 4.3.2. Cash Cows (Low Growth, High Market Share)
- 4.3.3. Question Mark (High Growth, Low Market Share)
- 4.3.4. Dogs (Low Growth, Low Market Share)
- 4.4. Ansoff Matrix Analysis
- 4.5. Supply Chain Analysis
- 4.6. Regulatory Landscape
- 4.7. Current Market Potential and Opportunity Assessment (TAM–SAM–SOM Framework)
- 4.8. RAX Analyst Note
- 4.1. Porters Five Forces
- 5. Market Analysis, Insights and Forecast 2021-2033
- 5.1. Market Analysis, Insights and Forecast - by Technology
- 5.1.1. Radiography Testing Equipment
- 5.1.2. Ultrasonic Testing Equipment
- 5.1.3. Magnetic Particle Testing Equipment
- 5.1.4. Liquid Penetrant Testing Equipment
- 5.1.5. Visual Inspection Equipment
- 5.1.6. Eddy Current Equipment
- 5.1.7. Other Technologies Equipment
- 5.2. Market Analysis, Insights and Forecast - by End-user Industry
- 5.2.1. Oil and Gas
- 5.2.2. Power and Energy
- 5.2.3. Aerospace and Defense
- 5.2.4. Automotive and Transportation
- 5.2.5. Construction
- 5.2.6. Other End-user Industries
- 5.3. Market Analysis, Insights and Forecast - by Region
- 5.3.1. North America
- 5.3.2. Europe
- 5.3.3. Asia
- 5.3.4. Australia and New Zealand
- 5.3.5. Latin America
- 5.3.6. Middle East and Africa
- 5.1. Market Analysis, Insights and Forecast - by Technology
- 6. Global Non-Destructive Testing Equipment Industry Analysis, Insights and Forecast, 2021-2033
- 6.1. Market Analysis, Insights and Forecast - by Technology
- 6.1.1. Radiography Testing Equipment
- 6.1.2. Ultrasonic Testing Equipment
- 6.1.3. Magnetic Particle Testing Equipment
- 6.1.4. Liquid Penetrant Testing Equipment
- 6.1.5. Visual Inspection Equipment
- 6.1.6. Eddy Current Equipment
- 6.1.7. Other Technologies Equipment
- 6.2. Market Analysis, Insights and Forecast - by End-user Industry
- 6.2.1. Oil and Gas
- 6.2.2. Power and Energy
- 6.2.3. Aerospace and Defense
- 6.2.4. Automotive and Transportation
- 6.2.5. Construction
- 6.2.6. Other End-user Industries
- 6.1. Market Analysis, Insights and Forecast - by Technology
- 7. North America Non-Destructive Testing Equipment Industry Analysis, Insights and Forecast, 2020-2032
- 7.1. Market Analysis, Insights and Forecast - by Technology
- 7.1.1. Radiography Testing Equipment
- 7.1.2. Ultrasonic Testing Equipment
- 7.1.3. Magnetic Particle Testing Equipment
- 7.1.4. Liquid Penetrant Testing Equipment
- 7.1.5. Visual Inspection Equipment
- 7.1.6. Eddy Current Equipment
- 7.1.7. Other Technologies Equipment
- 7.2. Market Analysis, Insights and Forecast - by End-user Industry
- 7.2.1. Oil and Gas
- 7.2.2. Power and Energy
- 7.2.3. Aerospace and Defense
- 7.2.4. Automotive and Transportation
- 7.2.5. Construction
- 7.2.6. Other End-user Industries
- 7.1. Market Analysis, Insights and Forecast - by Technology
- 8. Europe Non-Destructive Testing Equipment Industry Analysis, Insights and Forecast, 2020-2032
- 8.1. Market Analysis, Insights and Forecast - by Technology
- 8.1.1. Radiography Testing Equipment
- 8.1.2. Ultrasonic Testing Equipment
- 8.1.3. Magnetic Particle Testing Equipment
- 8.1.4. Liquid Penetrant Testing Equipment
- 8.1.5. Visual Inspection Equipment
- 8.1.6. Eddy Current Equipment
- 8.1.7. Other Technologies Equipment
- 8.2. Market Analysis, Insights and Forecast - by End-user Industry
- 8.2.1. Oil and Gas
- 8.2.2. Power and Energy
- 8.2.3. Aerospace and Defense
- 8.2.4. Automotive and Transportation
- 8.2.5. Construction
- 8.2.6. Other End-user Industries
- 8.1. Market Analysis, Insights and Forecast - by Technology
- 9. Asia Non-Destructive Testing Equipment Industry Analysis, Insights and Forecast, 2020-2032
- 9.1. Market Analysis, Insights and Forecast - by Technology
- 9.1.1. Radiography Testing Equipment
- 9.1.2. Ultrasonic Testing Equipment
- 9.1.3. Magnetic Particle Testing Equipment
- 9.1.4. Liquid Penetrant Testing Equipment
- 9.1.5. Visual Inspection Equipment
- 9.1.6. Eddy Current Equipment
- 9.1.7. Other Technologies Equipment
- 9.2. Market Analysis, Insights and Forecast - by End-user Industry
- 9.2.1. Oil and Gas
- 9.2.2. Power and Energy
- 9.2.3. Aerospace and Defense
- 9.2.4. Automotive and Transportation
- 9.2.5. Construction
- 9.2.6. Other End-user Industries
- 9.1. Market Analysis, Insights and Forecast - by Technology
- 10. Australia and New Zealand Non-Destructive Testing Equipment Industry Analysis, Insights and Forecast, 2020-2032
- 10.1. Market Analysis, Insights and Forecast - by Technology
- 10.1.1. Radiography Testing Equipment
- 10.1.2. Ultrasonic Testing Equipment
- 10.1.3. Magnetic Particle Testing Equipment
- 10.1.4. Liquid Penetrant Testing Equipment
- 10.1.5. Visual Inspection Equipment
- 10.1.6. Eddy Current Equipment
- 10.1.7. Other Technologies Equipment
- 10.2. Market Analysis, Insights and Forecast - by End-user Industry
- 10.2.1. Oil and Gas
- 10.2.2. Power and Energy
- 10.2.3. Aerospace and Defense
- 10.2.4. Automotive and Transportation
- 10.2.5. Construction
- 10.2.6. Other End-user Industries
- 10.1. Market Analysis, Insights and Forecast - by Technology
- 11. Latin America Non-Destructive Testing Equipment Industry Analysis, Insights and Forecast, 2020-2032
- 11.1. Market Analysis, Insights and Forecast - by Technology
- 11.1.1. Radiography Testing Equipment
- 11.1.2. Ultrasonic Testing Equipment
- 11.1.3. Magnetic Particle Testing Equipment
- 11.1.4. Liquid Penetrant Testing Equipment
- 11.1.5. Visual Inspection Equipment
- 11.1.6. Eddy Current Equipment
- 11.1.7. Other Technologies Equipment
- 11.2. Market Analysis, Insights and Forecast - by End-user Industry
- 11.2.1. Oil and Gas
- 11.2.2. Power and Energy
- 11.2.3. Aerospace and Defense
- 11.2.4. Automotive and Transportation
- 11.2.5. Construction
- 11.2.6. Other End-user Industries
- 11.1. Market Analysis, Insights and Forecast - by Technology
- 12. Middle East and Africa Non-Destructive Testing Equipment Industry Analysis, Insights and Forecast, 2020-2032
- 12.1. Market Analysis, Insights and Forecast - by Technology
- 12.1.1. Radiography Testing Equipment
- 12.1.2. Ultrasonic Testing Equipment
- 12.1.3. Magnetic Particle Testing Equipment
- 12.1.4. Liquid Penetrant Testing Equipment
- 12.1.5. Visual Inspection Equipment
- 12.1.6. Eddy Current Equipment
- 12.1.7. Other Technologies Equipment
- 12.2. Market Analysis, Insights and Forecast - by End-user Industry
- 12.2.1. Oil and Gas
- 12.2.2. Power and Energy
- 12.2.3. Aerospace and Defense
- 12.2.4. Automotive and Transportation
- 12.2.5. Construction
- 12.2.6. Other End-user Industries
- 12.1. Market Analysis, Insights and Forecast - by Technology
- 13. Competitive Analysis
- 13.1. Company Profiles
- 13.1.1 Intertek Group PLC
- 13.1.1.1. Company Overview
- 13.1.1.2. Products
- 13.1.1.3. Company Financials
- 13.1.1.4. SWOT Analysis
- 13.1.2 YXLON International GmbH (COMET Holding AG)
- 13.1.2.1. Company Overview
- 13.1.2.2. Products
- 13.1.2.3. Company Financials
- 13.1.2.4. SWOT Analysis
- 13.1.3 Baker Hughes
- 13.1.3.1. Company Overview
- 13.1.3.2. Products
- 13.1.3.3. Company Financials
- 13.1.3.4. SWOT Analysis
- 13.1.4 Controle Mesure Systemes SA
- 13.1.4.1. Company Overview
- 13.1.4.2. Products
- 13.1.4.3. Company Financials
- 13.1.4.4. SWOT Analysis
- 13.1.5 Nikon Metrology NV
- 13.1.5.1. Company Overview
- 13.1.5.2. Products
- 13.1.5.3. Company Financials
- 13.1.5.4. SWOT Analysis
- 13.1.6 Fujifilm Corporation
- 13.1.6.1. Company Overview
- 13.1.6.2. Products
- 13.1.6.3. Company Financials
- 13.1.6.4. SWOT Analysis
- 13.1.7 Mistras Group Inc
- 13.1.7.1. Company Overview
- 13.1.7.2. Products
- 13.1.7.3. Company Financials
- 13.1.7.4. SWOT Analysis
- 13.1.8 OkoNDT Group
- 13.1.8.1. Company Overview
- 13.1.8.2. Products
- 13.1.8.3. Company Financials
- 13.1.8.4. SWOT Analysis
- 13.1.9 Innospection Limited
- 13.1.9.1. Company Overview
- 13.1.9.2. Products
- 13.1.9.3. Company Financials
- 13.1.9.4. SWOT Analysis
- 13.1.10 Applus+ Laboratories
- 13.1.10.1. Company Overview
- 13.1.10.2. Products
- 13.1.10.3. Company Financials
- 13.1.10.4. SWOT Analysis
- 13.1.11 Bureau Veritas SA
- 13.1.11.1. Company Overview
- 13.1.11.2. Products
- 13.1.11.3. Company Financials
- 13.1.11.4. SWOT Analysis
- 13.1.12 Olympus Corporation
- 13.1.12.1. Company Overview
- 13.1.12.2. Products
- 13.1.12.3. Company Financials
- 13.1.12.4. SWOT Analysis
- 13.1.13 Magnaflux Corp
- 13.1.13.1. Company Overview
- 13.1.13.2. Products
- 13.1.13.3. Company Financials
- 13.1.13.4. SWOT Analysis
- 13.1.1 Intertek Group PLC
- 13.2. Market Entropy
- 13.2.1 Company's Key Areas Served
- 13.2.2 Recent Developments
- 13.3. Company Market Share Analysis 2025
- 13.3.1 Top 5 Companies Market Share Analysis
- 13.3.2 Top 3 Companies Market Share Analysis
- 13.4. List of Potential Customers
- 14. Research Methodology
List of Figures
- Figure 1: Global Non-Destructive Testing Equipment Industry Revenue Breakdown (Million, %) by Region 2025 & 2033
- Figure 2: North America Non-Destructive Testing Equipment Industry Revenue (Million), by Technology 2025 & 2033
- Figure 3: North America Non-Destructive Testing Equipment Industry Revenue Share (%), by Technology 2025 & 2033
- Figure 4: North America Non-Destructive Testing Equipment Industry Revenue (Million), by End-user Industry 2025 & 2033
- Figure 5: North America Non-Destructive Testing Equipment Industry Revenue Share (%), by End-user Industry 2025 & 2033
- Figure 6: North America Non-Destructive Testing Equipment Industry Revenue (Million), by Country 2025 & 2033
- Figure 7: North America Non-Destructive Testing Equipment Industry Revenue Share (%), by Country 2025 & 2033
- Figure 8: Europe Non-Destructive Testing Equipment Industry Revenue (Million), by Technology 2025 & 2033
- Figure 9: Europe Non-Destructive Testing Equipment Industry Revenue Share (%), by Technology 2025 & 2033
- Figure 10: Europe Non-Destructive Testing Equipment Industry Revenue (Million), by End-user Industry 2025 & 2033
- Figure 11: Europe Non-Destructive Testing Equipment Industry Revenue Share (%), by End-user Industry 2025 & 2033
- Figure 12: Europe Non-Destructive Testing Equipment Industry Revenue (Million), by Country 2025 & 2033
- Figure 13: Europe Non-Destructive Testing Equipment Industry Revenue Share (%), by Country 2025 & 2033
- Figure 14: Asia Non-Destructive Testing Equipment Industry Revenue (Million), by Technology 2025 & 2033
- Figure 15: Asia Non-Destructive Testing Equipment Industry Revenue Share (%), by Technology 2025 & 2033
- Figure 16: Asia Non-Destructive Testing Equipment Industry Revenue (Million), by End-user Industry 2025 & 2033
- Figure 17: Asia Non-Destructive Testing Equipment Industry Revenue Share (%), by End-user Industry 2025 & 2033
- Figure 18: Asia Non-Destructive Testing Equipment Industry Revenue (Million), by Country 2025 & 2033
- Figure 19: Asia Non-Destructive Testing Equipment Industry Revenue Share (%), by Country 2025 & 2033
- Figure 20: Australia and New Zealand Non-Destructive Testing Equipment Industry Revenue (Million), by Technology 2025 & 2033
- Figure 21: Australia and New Zealand Non-Destructive Testing Equipment Industry Revenue Share (%), by Technology 2025 & 2033
- Figure 22: Australia and New Zealand Non-Destructive Testing Equipment Industry Revenue (Million), by End-user Industry 2025 & 2033
- Figure 23: Australia and New Zealand Non-Destructive Testing Equipment Industry Revenue Share (%), by End-user Industry 2025 & 2033
- Figure 24: Australia and New Zealand Non-Destructive Testing Equipment Industry Revenue (Million), by Country 2025 & 2033
- Figure 25: Australia and New Zealand Non-Destructive Testing Equipment Industry Revenue Share (%), by Country 2025 & 2033
- Figure 26: Latin America Non-Destructive Testing Equipment Industry Revenue (Million), by Technology 2025 & 2033
- Figure 27: Latin America Non-Destructive Testing Equipment Industry Revenue Share (%), by Technology 2025 & 2033
- Figure 28: Latin America Non-Destructive Testing Equipment Industry Revenue (Million), by End-user Industry 2025 & 2033
- Figure 29: Latin America Non-Destructive Testing Equipment Industry Revenue Share (%), by End-user Industry 2025 & 2033
- Figure 30: Latin America Non-Destructive Testing Equipment Industry Revenue (Million), by Country 2025 & 2033
- Figure 31: Latin America Non-Destructive Testing Equipment Industry Revenue Share (%), by Country 2025 & 2033
- Figure 32: Middle East and Africa Non-Destructive Testing Equipment Industry Revenue (Million), by Technology 2025 & 2033
- Figure 33: Middle East and Africa Non-Destructive Testing Equipment Industry Revenue Share (%), by Technology 2025 & 2033
- Figure 34: Middle East and Africa Non-Destructive Testing Equipment Industry Revenue (Million), by End-user Industry 2025 & 2033
- Figure 35: Middle East and Africa Non-Destructive Testing Equipment Industry Revenue Share (%), by End-user Industry 2025 & 2033
- Figure 36: Middle East and Africa Non-Destructive Testing Equipment Industry Revenue (Million), by Country 2025 & 2033
- Figure 37: Middle East and Africa Non-Destructive Testing Equipment Industry Revenue Share (%), by Country 2025 & 2033
List of Tables
- Table 1: Global Non-Destructive Testing Equipment Industry Revenue Million Forecast, by Technology 2020 & 2033
- Table 2: Global Non-Destructive Testing Equipment Industry Revenue Million Forecast, by End-user Industry 2020 & 2033
- Table 3: Global Non-Destructive Testing Equipment Industry Revenue Million Forecast, by Region 2020 & 2033
- Table 4: Global Non-Destructive Testing Equipment Industry Revenue Million Forecast, by Technology 2020 & 2033
- Table 5: Global Non-Destructive Testing Equipment Industry Revenue Million Forecast, by End-user Industry 2020 & 2033
- Table 6: Global Non-Destructive Testing Equipment Industry Revenue Million Forecast, by Country 2020 & 2033
- Table 7: United States Non-Destructive Testing Equipment Industry Revenue (Million) Forecast, by Application 2020 & 2033
- Table 8: Canada Non-Destructive Testing Equipment Industry Revenue (Million) Forecast, by Application 2020 & 2033
- Table 9: Global Non-Destructive Testing Equipment Industry Revenue Million Forecast, by Technology 2020 & 2033
- Table 10: Global Non-Destructive Testing Equipment Industry Revenue Million Forecast, by End-user Industry 2020 & 2033
- Table 11: Global Non-Destructive Testing Equipment Industry Revenue Million Forecast, by Country 2020 & 2033
- Table 12: United Kingdom Non-Destructive Testing Equipment Industry Revenue (Million) Forecast, by Application 2020 & 2033
- Table 13: Germany Non-Destructive Testing Equipment Industry Revenue (Million) Forecast, by Application 2020 & 2033
- Table 14: France Non-Destructive Testing Equipment Industry Revenue (Million) Forecast, by Application 2020 & 2033
- Table 15: Russia Non-Destructive Testing Equipment Industry Revenue (Million) Forecast, by Application 2020 & 2033
- Table 16: Italy Non-Destructive Testing Equipment Industry Revenue (Million) Forecast, by Application 2020 & 2033
- Table 17: Global Non-Destructive Testing Equipment Industry Revenue Million Forecast, by Technology 2020 & 2033
- Table 18: Global Non-Destructive Testing Equipment Industry Revenue Million Forecast, by End-user Industry 2020 & 2033
- Table 19: Global Non-Destructive Testing Equipment Industry Revenue Million Forecast, by Country 2020 & 2033
- Table 20: China Non-Destructive Testing Equipment Industry Revenue (Million) Forecast, by Application 2020 & 2033
- Table 21: India Non-Destructive Testing Equipment Industry Revenue (Million) Forecast, by Application 2020 & 2033
- Table 22: South Korea Non-Destructive Testing Equipment Industry Revenue (Million) Forecast, by Application 2020 & 2033
- Table 23: Global Non-Destructive Testing Equipment Industry Revenue Million Forecast, by Technology 2020 & 2033
- Table 24: Global Non-Destructive Testing Equipment Industry Revenue Million Forecast, by End-user Industry 2020 & 2033
- Table 25: Global Non-Destructive Testing Equipment Industry Revenue Million Forecast, by Country 2020 & 2033
- Table 26: Global Non-Destructive Testing Equipment Industry Revenue Million Forecast, by Technology 2020 & 2033
- Table 27: Global Non-Destructive Testing Equipment Industry Revenue Million Forecast, by End-user Industry 2020 & 2033
- Table 28: Global Non-Destructive Testing Equipment Industry Revenue Million Forecast, by Country 2020 & 2033
- Table 29: Mexico Non-Destructive Testing Equipment Industry Revenue (Million) Forecast, by Application 2020 & 2033
- Table 30: Brazil Non-Destructive Testing Equipment Industry Revenue (Million) Forecast, by Application 2020 & 2033
- Table 31: Argentina Non-Destructive Testing Equipment Industry Revenue (Million) Forecast, by Application 2020 & 2033
- Table 32: Global Non-Destructive Testing Equipment Industry Revenue Million Forecast, by Technology 2020 & 2033
- Table 33: Global Non-Destructive Testing Equipment Industry Revenue Million Forecast, by End-user Industry 2020 & 2033
- Table 34: Global Non-Destructive Testing Equipment Industry Revenue Million Forecast, by Country 2020 & 2033
- Table 35: Saudi Arabia Non-Destructive Testing Equipment Industry Revenue (Million) Forecast, by Application 2020 & 2033
- Table 36: United Arab Emirates Non-Destructive Testing Equipment Industry Revenue (Million) Forecast, by Application 2020 & 2033
- Table 37: Qatar Non-Destructive Testing Equipment Industry Revenue (Million) Forecast, by Application 2020 & 2033
Frequently Asked Questions
1. What is the projected Compound Annual Growth Rate (CAGR) of the Non-Destructive Testing Equipment Industry?
The projected CAGR is approximately 7.20%.
2. Which companies are prominent players in the Non-Destructive Testing Equipment Industry?
Key companies in the market include Intertek Group PLC, YXLON International GmbH (COMET Holding AG), Baker Hughes, Controle Mesure Systemes SA, Nikon Metrology NV, Fujifilm Corporation, Mistras Group Inc, OkoNDT Group, Innospection Limited, Applus+ Laboratories, Bureau Veritas SA, Olympus Corporation, Magnaflux Corp.
3. What are the main segments of the Non-Destructive Testing Equipment Industry?
The market segments include Technology, End-user Industry.
4. Can you provide details about the market size?
The market size is estimated to be USD 3.02 Million as of 2022.
5. What are some drivers contributing to market growth?
Stringent Regulations Mandating Safety; Aging Infrastructure and Increasing Need for Maintenance.
6. What are the notable trends driving market growth?
Oil and Gas Holds Highest Market Share.
7. Are there any restraints impacting market growth?
Lack of Skilled Personnel and Training Facilities.
8. Can you provide examples of recent developments in the market?
May 2023: MP Machinery and Testing announced the release of proprietary material testing equipment that non-destructively determines the material properties of structures and in-service components. MPM provides advanced material testing products and services for the steel, nuclear power & energy, aerospace, pipe, defense, and transportation industries.
9. What pricing options are available for accessing the report?
Pricing options include single-user, multi-user, and enterprise licenses priced at USD 4750, USD 5250, and USD 8750 respectively.
10. Is the market size provided in terms of value or volume?
The market size is provided in terms of value, measured in Million.
11. Are there any specific market keywords associated with the report?
Yes, the market keyword associated with the report is "Non-Destructive Testing Equipment Industry," which aids in identifying and referencing the specific market segment covered.
12. How do I determine which pricing option suits my needs best?
The pricing options vary based on user requirements and access needs. Individual users may opt for single-user licenses, while businesses requiring broader access may choose multi-user or enterprise licenses for cost-effective access to the report.
13. Are there any additional resources or data provided in the Non-Destructive Testing Equipment Industry report?
While the report offers comprehensive insights, it's advisable to review the specific contents or supplementary materials provided to ascertain if additional resources or data are available.
14. How can I stay updated on further developments or reports in the Non-Destructive Testing Equipment Industry?
To stay informed about further developments, trends, and reports in the Non-Destructive Testing Equipment Industry, consider subscribing to industry newsletters, following relevant companies and organizations, or regularly checking reputable industry news sources and publications.
Methodology
Step 1 - Identification of Relevant Samples Size from Population Database


Step 2 - Approaches for Defining Global Market Size (Value, Volume* & Price*)

Note*: In applicable scenarios
Step 3 - Data Sources
Primary Research
- Web Analytics
- Survey Reports
- Research Institute
- Latest Research Reports
- Opinion Leaders
Secondary Research
- Annual Reports
- White Paper
- Latest Press Release
- Industry Association
- Paid Database
- Investor Presentations

Step 4 - Data Triangulation
Involves using different sources of information in order to increase the validity of a study
These sources are likely to be stakeholders in a program - participants, other researchers, program staff, other community members, and so on.
Then we put all data in single framework & apply various statistical tools to find out the dynamic on the market.
During the analysis stage, feedback from the stakeholder groups would be compared to determine areas of agreement as well as areas of divergence