
Key Insights
The Non-GMO Textured Soy Protein (TSP) market is experiencing robust growth, driven by increasing consumer demand for clean-label, plant-based protein sources. The market's 7.54% CAGR from 2019-2024 suggests a significant expansion, projected to continue through 2033. Key drivers include the rising popularity of vegetarian and vegan diets, growing health consciousness, and increasing awareness of the benefits of soy protein as a complete protein source, rich in essential amino acids. The food and beverage industry is the largest application segment, with textured soy protein used extensively in meat alternatives, protein bars, and other processed foods. The organic segment is also witnessing considerable growth, fueled by the rising preference for naturally produced and sustainably sourced ingredients. However, factors like price fluctuations in raw materials and potential supply chain disruptions can pose challenges to market expansion. Competitive landscape analysis reveals a mix of large multinational corporations like Cargill and ADM alongside smaller specialized players. Regional analysis indicates that North America and Asia Pacific are currently leading the market, propelled by strong consumer demand and established manufacturing infrastructure in these regions. The future growth trajectory is likely to be influenced by technological advancements in soy protein processing, leading to enhanced functionality and improved nutritional profiles, ultimately broadening the applications and expanding market reach.
The Non-GMO TSP market is segmented by type (conventional and organic) and application (food and beverages, animal feed, and other food applications). The conventional segment holds a larger market share currently, but the organic segment is rapidly expanding due to rising consumer preference for healthier and sustainable options. Geographic distribution shows significant market presence in North America and Asia Pacific, owing to established supply chains and high consumer demand. Future market prospects appear promising, driven by the increasing adoption of plant-based diets globally, coupled with the ongoing efforts to improve the texture and functionality of Non-GMO textured soy protein to enhance its appeal in various applications. Emerging markets in developing economies are also expected to contribute to market growth in the coming years. The competitive landscape necessitates strategic partnerships, product innovation, and efficient supply chain management to capitalize on the emerging opportunities.
Non-GMO Textured Soy Protein Industry Market Report: 2019-2033
This comprehensive report provides an in-depth analysis of the Non-GMO Textured Soy Protein industry, offering valuable insights for industry stakeholders, investors, and market entrants. Covering the period from 2019 to 2033, with a base year of 2025 and a forecast period of 2025-2033, this report meticulously examines market trends, competitive dynamics, and growth opportunities within this rapidly evolving sector. The global market size is projected to reach xx Million by 2033, exhibiting a robust CAGR of xx% during the forecast period.
Non-GMO Textured Soy Protein Industry Market Concentration & Innovation
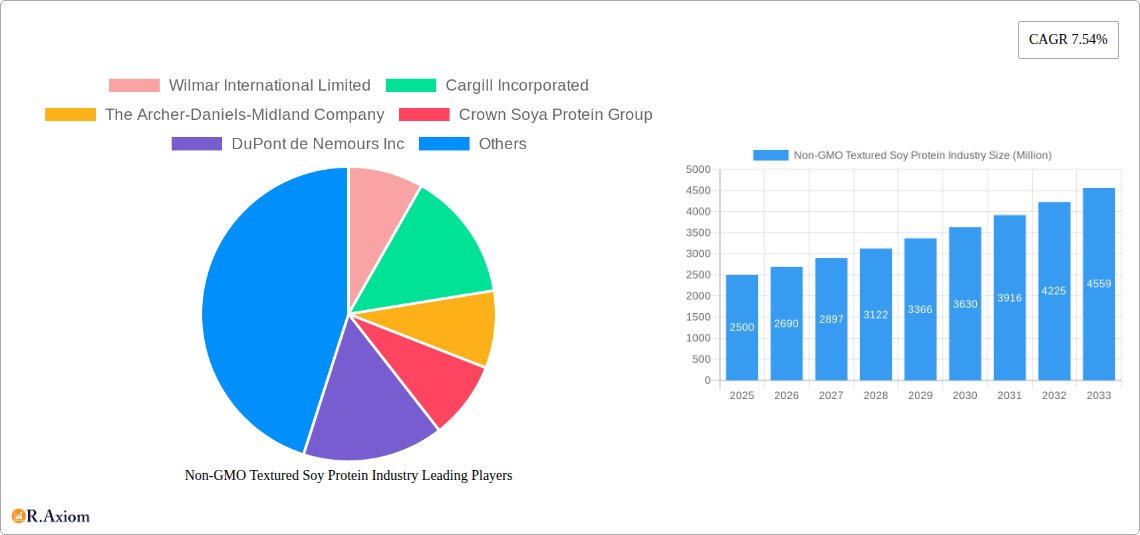
This section analyzes the competitive landscape of the Non-GMO Textured Soy Protein industry, assessing market concentration, innovation drivers, regulatory influences, and strategic activities. The market is characterized by a moderately concentrated structure, with key players like Wilmar International Limited, Cargill Incorporated, and Archer-Daniels-Midland Company holding significant market share. However, the presence of several regional and specialized players contributes to a dynamic competitive environment.
- Market Share: Wilmar International Limited holds an estimated xx% market share, followed by Cargill Incorporated at xx% and ADM at xx%. Smaller players collectively account for the remaining xx%.
- Innovation Drivers: The increasing demand for plant-based protein sources fuels innovation in soy protein texturization technologies, focusing on improved functionality, texture, and nutritional profiles. This includes advancements in extrusion processes and the development of novel soy protein isolates.
- Regulatory Landscape: Government regulations regarding GMO labeling and food safety standards significantly impact the industry. Compliance with these regulations is crucial for market access and maintaining consumer trust.
- Product Substitutes: Competitors include other plant-based proteins like pea protein and wheat gluten, each posing unique challenges and opportunities.
- M&A Activity: The industry has witnessed several mergers and acquisitions (M&A) in recent years, valued at approximately xx Million collectively. These transactions reflect consolidation efforts and strategic expansion strategies by major players. Examples include [insert specific M&A examples if available, with deal values].
- End-User Trends: Growing consumer awareness of health and sustainability is driving demand for non-GMO soy protein in various applications.
Non-GMO Textured Soy Protein Industry Industry Trends & Insights
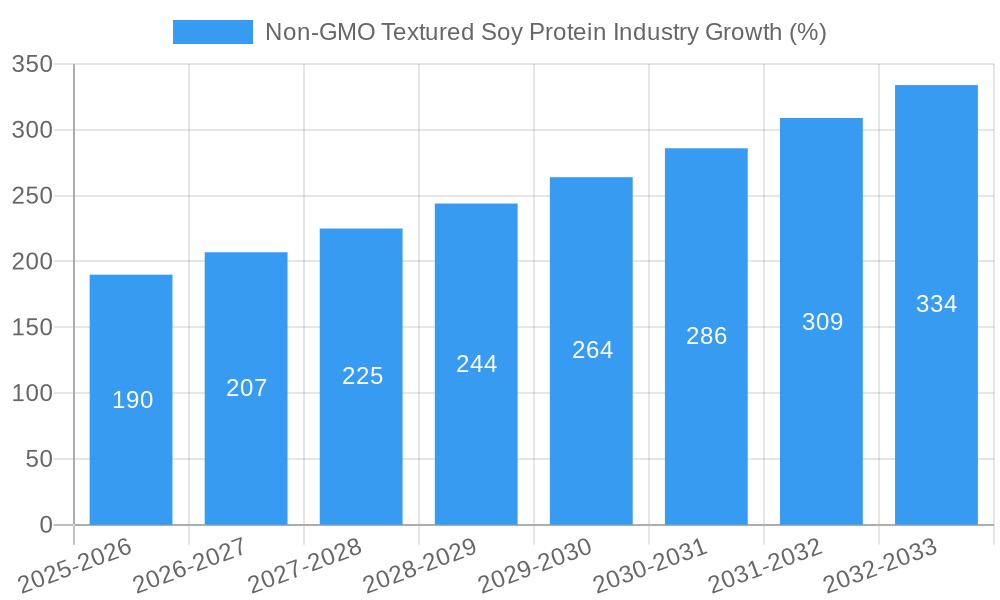
This section delves into the key market trends influencing the growth of the Non-GMO Textured Soy Protein industry. The market is experiencing strong growth driven by several factors. The rising global population, coupled with increasing disposable incomes, especially in developing economies, fuels the demand for affordable and nutritious protein sources. The growing preference for plant-based diets and the increasing awareness of health and wellness are further propelling this market expansion. Technological advancements in soy protein processing are enhancing the functionality and versatility of the product, opening up new applications across various industries. However, price volatility in raw materials and intense competition present ongoing challenges.
The CAGR for the Non-GMO Textured Soy Protein market is estimated at xx% during the forecast period (2025-2033). Market penetration in key regions is expected to increase significantly due to the growing adoption of plant-based alternatives and sustained marketing efforts. The competitive landscape is characterized by intense rivalry among established players and emerging companies, often leading to strategic partnerships, product innovation, and pricing strategies.
Dominant Markets & Segments in Non-GMO Textured Soy Protein Industry
This section identifies the dominant regions, countries, and segments within the Non-GMO Textured Soy Protein market.
By Type:
- Conventional: The conventional segment holds a larger market share due to its cost-effectiveness and wide availability. Growth is driven by its use in various food and beverage applications.
- Organic: The organic segment demonstrates significant growth potential, driven by rising consumer demand for clean-label products and increased awareness of sustainable agriculture.
By Application:
- Food and Beverages: This segment dominates the market, with textured soy protein utilized as a key ingredient in meat alternatives, protein bars, and other food products. Growth is fueled by the increasing popularity of vegetarian and vegan diets.
- Animal Feed: The animal feed segment presents a significant opportunity for growth, with textured soy protein serving as a sustainable and cost-effective protein source for livestock. Stringent regulations and environmental concerns within animal feed markets are driving this demand.
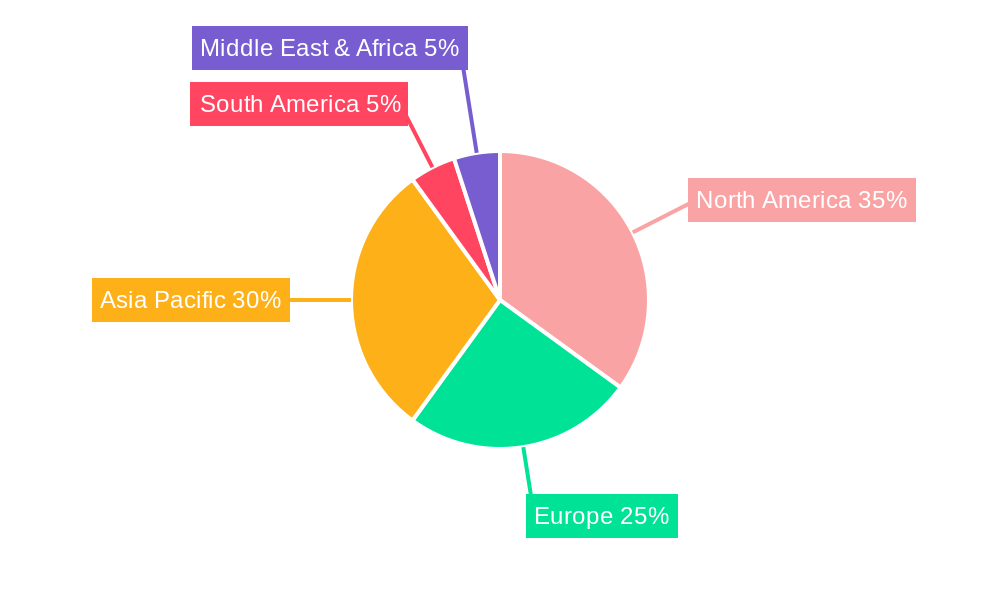
Geographic Dominance: [Insert dominant region/country, e.g., North America]. Key drivers for dominance include strong consumer demand, well-established supply chains, and favorable regulatory frameworks. This region benefits from robust infrastructure and supportive economic policies that foster industry growth.
Non-GMO Textured Soy Protein Industry Product Developments
Recent product innovations focus on enhancing texture, flavor, and nutritional value. New processing techniques improve the functionality of textured soy protein in various applications. This includes the development of soy protein isolates with improved solubility and emulsification properties and the creation of innovative soy-based meat alternatives with enhanced taste and texture. These developments aim to expand the product's appeal across diverse consumer segments and application areas, offering competitive advantages to manufacturers.
Report Scope & Segmentation Analysis
This report segments the Non-GMO Textured Soy Protein market by type (conventional and organic) and application (food and beverages, animal feed). Each segment's growth projection, market size, and competitive dynamics are analyzed.
- Conventional Segment: This segment is expected to witness steady growth, driven by its widespread application in food and beverage products. The competitive landscape is characterized by intense price competition and continuous product innovation.
- Organic Segment: This segment is poised for substantial growth, driven by increasing consumer preference for organic and sustainable food products. However, higher production costs and limited availability are potential restraints.
- Food and Beverages Segment: This segment is the largest and fastest-growing application area, experiencing significant growth due to the growing demand for plant-based protein sources.
- Animal Feed Segment: This segment is witnessing moderate growth, driven by the increasing use of textured soy protein as a sustainable and cost-effective animal feed ingredient.
Key Drivers of Non-GMO Textured Soy Protein Industry Growth
The Non-GMO Textured Soy Protein industry's growth is propelled by increasing consumer demand for plant-based proteins, driven by health consciousness and environmental concerns. Technological advancements in soy protein processing enhance its functionality, expanding its application range. Favorable government policies promoting sustainable agriculture and the rising popularity of vegan and vegetarian diets also contribute significantly to market expansion.
Challenges in the Non-GMO Textured Soy Protein Industry Sector
The industry faces challenges, including fluctuations in raw material prices, stringent regulatory compliance requirements, and intense competition from other plant-based protein sources. Supply chain disruptions and the need for continuous innovation to meet evolving consumer preferences also pose significant challenges. These factors can affect profitability and market share for individual companies.
Emerging Opportunities in Non-GMO Textured Soy Protein Industry
Emerging opportunities lie in expanding into new geographic markets, particularly in developing countries with growing populations and increasing disposable incomes. Developing novel applications for textured soy protein in functional foods and specialized dietary products offers considerable potential. Furthermore, exploring sustainable and environmentally friendly processing technologies can enhance the industry's attractiveness and improve its market position.
Leading Players in the Non-GMO Textured Soy Protein Industry Market
- Wilmar International Limited
- Cargill Incorporated
- The Archer-Daniels-Midland Company
- Crown Soya Protein Group
- DuPont de Nemours Inc
- Sonic Bioche
- Victoria Group
- Bremil Group
- Hoya Food
Key Developments in Non-GMO Textured Soy Protein Industry Industry
- 2022-Q4: Cargill Incorporated announced a significant investment in expanding its soy protein production capacity.
- 2023-Q1: Wilmar International Limited launched a new line of textured soy protein with enhanced nutritional properties.
- 2023-Q2: A major merger between two smaller soy protein producers created a more significant player in the market.
- [Add further developments as available with year/month and impact]
Strategic Outlook for Non-GMO Textured Soy Protein Industry Market
The future of the Non-GMO Textured Soy Protein industry appears promising. Sustained growth is expected, driven by the ongoing rise in demand for plant-based proteins and ongoing innovations in processing technologies. Expanding into new markets and product applications will be key to maximizing future market potential. Companies that prioritize sustainability and invest in research and development are well-positioned to capitalize on future opportunities within this dynamic industry.
Non-GMO Textured Soy Protein Industry Segmentation
-
1. Type
- 1.1. Conventional
- 1.2. Organic
-
2. Application
-
2.1. Food and Beverages
- 2.1.1. Meat Substitutes
- 2.1.2. Dairy Alternatives
- 2.1.3. Infant Nutrition
- 2.1.4. Bakery Products
- 2.1.5. Cereal and Snacks
- 2.1.6. Other Food Applications
- 2.2. Animal Feed
-
2.1. Food and Beverages
Non-GMO Textured Soy Protein Industry Segmentation By Geography
-
1. North America
- 1.1. United States
- 1.2. Canada
- 1.3. Mexico
- 1.4. Rest of North America
-
2. Europe
- 2.1. Germany
- 2.2. United Kingdom
- 2.3. France
- 2.4. Italy
- 2.5. Spain
- 2.6. Rest of Europe
-
3. Asia Pacific
- 3.1. India
- 3.2. China
- 3.3. Japan
- 3.4. Australia
- 3.5. Rest of Asia Pacific
-
4. South America
- 4.1. Brazil
- 4.2. Argentina
- 4.3. Rest of South America
-
5. Middle East and Africa
- 5.1. South Africa
- 5.2. Saudi Arabia
- 5.3. Rest of Middle East and Africa
Non-GMO Textured Soy Protein Industry REPORT HIGHLIGHTS
| Aspects | Details |
|---|---|
| Study Period | 2019-2033 |
| Base Year | 2024 |
| Estimated Year | 2025 |
| Forecast Period | 2025-2033 |
| Historical Period | 2019-2024 |
| Growth Rate | CAGR of 7.54% from 2019-2033 |
| Segmentation |
|
Table of Contents
- 1. Introduction
- 1.1. Research Scope
- 1.2. Market Segmentation
- 1.3. Research Methodology
- 1.4. Definitions and Assumptions
- 2. Executive Summary
- 2.1. Introduction
- 3. Market Dynamics
- 3.1. Introduction
- 3.2. Market Drivers
- 3.2.1. Increasing Demand for Vegan Food & Beverages Driving the Market; Intolerance and Allergies Associated with Animal Protein Products
- 3.3. Market Restrains
- 3.3.1. High Market Penetration of Animal Protein
- 3.4. Market Trends
- 3.4.1. Non-GMO Textured Soy Protein to gain Prominence
- 4. Market Factor Analysis
- 4.1. Porters Five Forces
- 4.2. Supply/Value Chain
- 4.3. PESTEL analysis
- 4.4. Market Entropy
- 4.5. Patent/Trademark Analysis
- 5. Global Non-GMO Textured Soy Protein Industry Analysis, Insights and Forecast, 2019-2031
- 5.1. Market Analysis, Insights and Forecast - by Type
- 5.1.1. Conventional
- 5.1.2. Organic
- 5.2. Market Analysis, Insights and Forecast - by Application
- 5.2.1. Food and Beverages
- 5.2.1.1. Meat Substitutes
- 5.2.1.2. Dairy Alternatives
- 5.2.1.3. Infant Nutrition
- 5.2.1.4. Bakery Products
- 5.2.1.5. Cereal and Snacks
- 5.2.1.6. Other Food Applications
- 5.2.2. Animal Feed
- 5.2.1. Food and Beverages
- 5.3. Market Analysis, Insights and Forecast - by Region
- 5.3.1. North America
- 5.3.2. Europe
- 5.3.3. Asia Pacific
- 5.3.4. South America
- 5.3.5. Middle East and Africa
- 5.1. Market Analysis, Insights and Forecast - by Type
- 6. North America Non-GMO Textured Soy Protein Industry Analysis, Insights and Forecast, 2019-2031
- 6.1. Market Analysis, Insights and Forecast - by Type
- 6.1.1. Conventional
- 6.1.2. Organic
- 6.2. Market Analysis, Insights and Forecast - by Application
- 6.2.1. Food and Beverages
- 6.2.1.1. Meat Substitutes
- 6.2.1.2. Dairy Alternatives
- 6.2.1.3. Infant Nutrition
- 6.2.1.4. Bakery Products
- 6.2.1.5. Cereal and Snacks
- 6.2.1.6. Other Food Applications
- 6.2.2. Animal Feed
- 6.2.1. Food and Beverages
- 6.1. Market Analysis, Insights and Forecast - by Type
- 7. Europe Non-GMO Textured Soy Protein Industry Analysis, Insights and Forecast, 2019-2031
- 7.1. Market Analysis, Insights and Forecast - by Type
- 7.1.1. Conventional
- 7.1.2. Organic
- 7.2. Market Analysis, Insights and Forecast - by Application
- 7.2.1. Food and Beverages
- 7.2.1.1. Meat Substitutes
- 7.2.1.2. Dairy Alternatives
- 7.2.1.3. Infant Nutrition
- 7.2.1.4. Bakery Products
- 7.2.1.5. Cereal and Snacks
- 7.2.1.6. Other Food Applications
- 7.2.2. Animal Feed
- 7.2.1. Food and Beverages
- 7.1. Market Analysis, Insights and Forecast - by Type
- 8. Asia Pacific Non-GMO Textured Soy Protein Industry Analysis, Insights and Forecast, 2019-2031
- 8.1. Market Analysis, Insights and Forecast - by Type
- 8.1.1. Conventional
- 8.1.2. Organic
- 8.2. Market Analysis, Insights and Forecast - by Application
- 8.2.1. Food and Beverages
- 8.2.1.1. Meat Substitutes
- 8.2.1.2. Dairy Alternatives
- 8.2.1.3. Infant Nutrition
- 8.2.1.4. Bakery Products
- 8.2.1.5. Cereal and Snacks
- 8.2.1.6. Other Food Applications
- 8.2.2. Animal Feed
- 8.2.1. Food and Beverages
- 8.1. Market Analysis, Insights and Forecast - by Type
- 9. South America Non-GMO Textured Soy Protein Industry Analysis, Insights and Forecast, 2019-2031
- 9.1. Market Analysis, Insights and Forecast - by Type
- 9.1.1. Conventional
- 9.1.2. Organic
- 9.2. Market Analysis, Insights and Forecast - by Application
- 9.2.1. Food and Beverages
- 9.2.1.1. Meat Substitutes
- 9.2.1.2. Dairy Alternatives
- 9.2.1.3. Infant Nutrition
- 9.2.1.4. Bakery Products
- 9.2.1.5. Cereal and Snacks
- 9.2.1.6. Other Food Applications
- 9.2.2. Animal Feed
- 9.2.1. Food and Beverages
- 9.1. Market Analysis, Insights and Forecast - by Type
- 10. Middle East and Africa Non-GMO Textured Soy Protein Industry Analysis, Insights and Forecast, 2019-2031
- 10.1. Market Analysis, Insights and Forecast - by Type
- 10.1.1. Conventional
- 10.1.2. Organic
- 10.2. Market Analysis, Insights and Forecast - by Application
- 10.2.1. Food and Beverages
- 10.2.1.1. Meat Substitutes
- 10.2.1.2. Dairy Alternatives
- 10.2.1.3. Infant Nutrition
- 10.2.1.4. Bakery Products
- 10.2.1.5. Cereal and Snacks
- 10.2.1.6. Other Food Applications
- 10.2.2. Animal Feed
- 10.2.1. Food and Beverages
- 10.1. Market Analysis, Insights and Forecast - by Type
- 11. North America Non-GMO Textured Soy Protein Industry Analysis, Insights and Forecast, 2019-2031
- 11.1. Market Analysis, Insights and Forecast - By Country/Sub-region
- 11.1.1 United States
- 11.1.2 Canada
- 11.1.3 Mexico
- 11.1.4 Rest of North America
- 12. Europe Non-GMO Textured Soy Protein Industry Analysis, Insights and Forecast, 2019-2031
- 12.1. Market Analysis, Insights and Forecast - By Country/Sub-region
- 12.1.1 Germany
- 12.1.2 United Kingdom
- 12.1.3 France
- 12.1.4 Italy
- 12.1.5 Spain
- 12.1.6 Rest of Europe
- 13. Asia Pacific Non-GMO Textured Soy Protein Industry Analysis, Insights and Forecast, 2019-2031
- 13.1. Market Analysis, Insights and Forecast - By Country/Sub-region
- 13.1.1 India
- 13.1.2 China
- 13.1.3 Japan
- 13.1.4 Australia
- 13.1.5 Rest of Asia Pacific
- 14. South America Non-GMO Textured Soy Protein Industry Analysis, Insights and Forecast, 2019-2031
- 14.1. Market Analysis, Insights and Forecast - By Country/Sub-region
- 14.1.1 Brazil
- 14.1.2 Argentina
- 14.1.3 Rest of South America
- 15. Middle East & Africa Non-GMO Textured Soy Protein Industry Analysis, Insights and Forecast, 2019-2031
- 15.1. Market Analysis, Insights and Forecast - By Country/Sub-region
- 15.1.1 UAE
- 15.1.2 South Africa
- 15.1.3 Saudi Arabia
- 15.1.4 Rest of MEA
- 16. Competitive Analysis
- 16.1. Global Market Share Analysis 2024
- 16.2. Company Profiles
- 16.2.1 Wilmar International Limited
- 16.2.1.1. Overview
- 16.2.1.2. Products
- 16.2.1.3. SWOT Analysis
- 16.2.1.4. Recent Developments
- 16.2.1.5. Financials (Based on Availability)
- 16.2.2 Cargill Incorporated
- 16.2.2.1. Overview
- 16.2.2.2. Products
- 16.2.2.3. SWOT Analysis
- 16.2.2.4. Recent Developments
- 16.2.2.5. Financials (Based on Availability)
- 16.2.3 The Archer-Daniels-Midland Company
- 16.2.3.1. Overview
- 16.2.3.2. Products
- 16.2.3.3. SWOT Analysis
- 16.2.3.4. Recent Developments
- 16.2.3.5. Financials (Based on Availability)
- 16.2.4 Crown Soya Protein Group
- 16.2.4.1. Overview
- 16.2.4.2. Products
- 16.2.4.3. SWOT Analysis
- 16.2.4.4. Recent Developments
- 16.2.4.5. Financials (Based on Availability)
- 16.2.5 DuPont de Nemours Inc
- 16.2.5.1. Overview
- 16.2.5.2. Products
- 16.2.5.3. SWOT Analysis
- 16.2.5.4. Recent Developments
- 16.2.5.5. Financials (Based on Availability)
- 16.2.6 Sonic Bioche
- 16.2.6.1. Overview
- 16.2.6.2. Products
- 16.2.6.3. SWOT Analysis
- 16.2.6.4. Recent Developments
- 16.2.6.5. Financials (Based on Availability)
- 16.2.7 Victoria Group
- 16.2.7.1. Overview
- 16.2.7.2. Products
- 16.2.7.3. SWOT Analysis
- 16.2.7.4. Recent Developments
- 16.2.7.5. Financials (Based on Availability)
- 16.2.8 Bremil Group
- 16.2.8.1. Overview
- 16.2.8.2. Products
- 16.2.8.3. SWOT Analysis
- 16.2.8.4. Recent Developments
- 16.2.8.5. Financials (Based on Availability)
- 16.2.9 Hoya Food
- 16.2.9.1. Overview
- 16.2.9.2. Products
- 16.2.9.3. SWOT Analysis
- 16.2.9.4. Recent Developments
- 16.2.9.5. Financials (Based on Availability)
- 16.2.1 Wilmar International Limited
List of Figures
- Figure 1: Global Non-GMO Textured Soy Protein Industry Revenue Breakdown (Million, %) by Region 2024 & 2032
- Figure 2: North America Non-GMO Textured Soy Protein Industry Revenue (Million), by Country 2024 & 2032
- Figure 3: North America Non-GMO Textured Soy Protein Industry Revenue Share (%), by Country 2024 & 2032
- Figure 4: Europe Non-GMO Textured Soy Protein Industry Revenue (Million), by Country 2024 & 2032
- Figure 5: Europe Non-GMO Textured Soy Protein Industry Revenue Share (%), by Country 2024 & 2032
- Figure 6: Asia Pacific Non-GMO Textured Soy Protein Industry Revenue (Million), by Country 2024 & 2032
- Figure 7: Asia Pacific Non-GMO Textured Soy Protein Industry Revenue Share (%), by Country 2024 & 2032
- Figure 8: South America Non-GMO Textured Soy Protein Industry Revenue (Million), by Country 2024 & 2032
- Figure 9: South America Non-GMO Textured Soy Protein Industry Revenue Share (%), by Country 2024 & 2032
- Figure 10: Middle East & Africa Non-GMO Textured Soy Protein Industry Revenue (Million), by Country 2024 & 2032
- Figure 11: Middle East & Africa Non-GMO Textured Soy Protein Industry Revenue Share (%), by Country 2024 & 2032
- Figure 12: North America Non-GMO Textured Soy Protein Industry Revenue (Million), by Type 2024 & 2032
- Figure 13: North America Non-GMO Textured Soy Protein Industry Revenue Share (%), by Type 2024 & 2032
- Figure 14: North America Non-GMO Textured Soy Protein Industry Revenue (Million), by Application 2024 & 2032
- Figure 15: North America Non-GMO Textured Soy Protein Industry Revenue Share (%), by Application 2024 & 2032
- Figure 16: North America Non-GMO Textured Soy Protein Industry Revenue (Million), by Country 2024 & 2032
- Figure 17: North America Non-GMO Textured Soy Protein Industry Revenue Share (%), by Country 2024 & 2032
- Figure 18: Europe Non-GMO Textured Soy Protein Industry Revenue (Million), by Type 2024 & 2032
- Figure 19: Europe Non-GMO Textured Soy Protein Industry Revenue Share (%), by Type 2024 & 2032
- Figure 20: Europe Non-GMO Textured Soy Protein Industry Revenue (Million), by Application 2024 & 2032
- Figure 21: Europe Non-GMO Textured Soy Protein Industry Revenue Share (%), by Application 2024 & 2032
- Figure 22: Europe Non-GMO Textured Soy Protein Industry Revenue (Million), by Country 2024 & 2032
- Figure 23: Europe Non-GMO Textured Soy Protein Industry Revenue Share (%), by Country 2024 & 2032
- Figure 24: Asia Pacific Non-GMO Textured Soy Protein Industry Revenue (Million), by Type 2024 & 2032
- Figure 25: Asia Pacific Non-GMO Textured Soy Protein Industry Revenue Share (%), by Type 2024 & 2032
- Figure 26: Asia Pacific Non-GMO Textured Soy Protein Industry Revenue (Million), by Application 2024 & 2032
- Figure 27: Asia Pacific Non-GMO Textured Soy Protein Industry Revenue Share (%), by Application 2024 & 2032
- Figure 28: Asia Pacific Non-GMO Textured Soy Protein Industry Revenue (Million), by Country 2024 & 2032
- Figure 29: Asia Pacific Non-GMO Textured Soy Protein Industry Revenue Share (%), by Country 2024 & 2032
- Figure 30: South America Non-GMO Textured Soy Protein Industry Revenue (Million), by Type 2024 & 2032
- Figure 31: South America Non-GMO Textured Soy Protein Industry Revenue Share (%), by Type 2024 & 2032
- Figure 32: South America Non-GMO Textured Soy Protein Industry Revenue (Million), by Application 2024 & 2032
- Figure 33: South America Non-GMO Textured Soy Protein Industry Revenue Share (%), by Application 2024 & 2032
- Figure 34: South America Non-GMO Textured Soy Protein Industry Revenue (Million), by Country 2024 & 2032
- Figure 35: South America Non-GMO Textured Soy Protein Industry Revenue Share (%), by Country 2024 & 2032
- Figure 36: Middle East and Africa Non-GMO Textured Soy Protein Industry Revenue (Million), by Type 2024 & 2032
- Figure 37: Middle East and Africa Non-GMO Textured Soy Protein Industry Revenue Share (%), by Type 2024 & 2032
- Figure 38: Middle East and Africa Non-GMO Textured Soy Protein Industry Revenue (Million), by Application 2024 & 2032
- Figure 39: Middle East and Africa Non-GMO Textured Soy Protein Industry Revenue Share (%), by Application 2024 & 2032
- Figure 40: Middle East and Africa Non-GMO Textured Soy Protein Industry Revenue (Million), by Country 2024 & 2032
- Figure 41: Middle East and Africa Non-GMO Textured Soy Protein Industry Revenue Share (%), by Country 2024 & 2032
List of Tables
- Table 1: Global Non-GMO Textured Soy Protein Industry Revenue Million Forecast, by Region 2019 & 2032
- Table 2: Global Non-GMO Textured Soy Protein Industry Revenue Million Forecast, by Type 2019 & 2032
- Table 3: Global Non-GMO Textured Soy Protein Industry Revenue Million Forecast, by Application 2019 & 2032
- Table 4: Global Non-GMO Textured Soy Protein Industry Revenue Million Forecast, by Region 2019 & 2032
- Table 5: Global Non-GMO Textured Soy Protein Industry Revenue Million Forecast, by Country 2019 & 2032
- Table 6: United States Non-GMO Textured Soy Protein Industry Revenue (Million) Forecast, by Application 2019 & 2032
- Table 7: Canada Non-GMO Textured Soy Protein Industry Revenue (Million) Forecast, by Application 2019 & 2032
- Table 8: Mexico Non-GMO Textured Soy Protein Industry Revenue (Million) Forecast, by Application 2019 & 2032
- Table 9: Rest of North America Non-GMO Textured Soy Protein Industry Revenue (Million) Forecast, by Application 2019 & 2032
- Table 10: Global Non-GMO Textured Soy Protein Industry Revenue Million Forecast, by Country 2019 & 2032
- Table 11: Germany Non-GMO Textured Soy Protein Industry Revenue (Million) Forecast, by Application 2019 & 2032
- Table 12: United Kingdom Non-GMO Textured Soy Protein Industry Revenue (Million) Forecast, by Application 2019 & 2032
- Table 13: France Non-GMO Textured Soy Protein Industry Revenue (Million) Forecast, by Application 2019 & 2032
- Table 14: Italy Non-GMO Textured Soy Protein Industry Revenue (Million) Forecast, by Application 2019 & 2032
- Table 15: Spain Non-GMO Textured Soy Protein Industry Revenue (Million) Forecast, by Application 2019 & 2032
- Table 16: Rest of Europe Non-GMO Textured Soy Protein Industry Revenue (Million) Forecast, by Application 2019 & 2032
- Table 17: Global Non-GMO Textured Soy Protein Industry Revenue Million Forecast, by Country 2019 & 2032
- Table 18: India Non-GMO Textured Soy Protein Industry Revenue (Million) Forecast, by Application 2019 & 2032
- Table 19: China Non-GMO Textured Soy Protein Industry Revenue (Million) Forecast, by Application 2019 & 2032
- Table 20: Japan Non-GMO Textured Soy Protein Industry Revenue (Million) Forecast, by Application 2019 & 2032
- Table 21: Australia Non-GMO Textured Soy Protein Industry Revenue (Million) Forecast, by Application 2019 & 2032
- Table 22: Rest of Asia Pacific Non-GMO Textured Soy Protein Industry Revenue (Million) Forecast, by Application 2019 & 2032
- Table 23: Global Non-GMO Textured Soy Protein Industry Revenue Million Forecast, by Country 2019 & 2032
- Table 24: Brazil Non-GMO Textured Soy Protein Industry Revenue (Million) Forecast, by Application 2019 & 2032
- Table 25: Argentina Non-GMO Textured Soy Protein Industry Revenue (Million) Forecast, by Application 2019 & 2032
- Table 26: Rest of South America Non-GMO Textured Soy Protein Industry Revenue (Million) Forecast, by Application 2019 & 2032
- Table 27: Global Non-GMO Textured Soy Protein Industry Revenue Million Forecast, by Country 2019 & 2032
- Table 28: UAE Non-GMO Textured Soy Protein Industry Revenue (Million) Forecast, by Application 2019 & 2032
- Table 29: South Africa Non-GMO Textured Soy Protein Industry Revenue (Million) Forecast, by Application 2019 & 2032
- Table 30: Saudi Arabia Non-GMO Textured Soy Protein Industry Revenue (Million) Forecast, by Application 2019 & 2032
- Table 31: Rest of MEA Non-GMO Textured Soy Protein Industry Revenue (Million) Forecast, by Application 2019 & 2032
- Table 32: Global Non-GMO Textured Soy Protein Industry Revenue Million Forecast, by Type 2019 & 2032
- Table 33: Global Non-GMO Textured Soy Protein Industry Revenue Million Forecast, by Application 2019 & 2032
- Table 34: Global Non-GMO Textured Soy Protein Industry Revenue Million Forecast, by Country 2019 & 2032
- Table 35: United States Non-GMO Textured Soy Protein Industry Revenue (Million) Forecast, by Application 2019 & 2032
- Table 36: Canada Non-GMO Textured Soy Protein Industry Revenue (Million) Forecast, by Application 2019 & 2032
- Table 37: Mexico Non-GMO Textured Soy Protein Industry Revenue (Million) Forecast, by Application 2019 & 2032
- Table 38: Rest of North America Non-GMO Textured Soy Protein Industry Revenue (Million) Forecast, by Application 2019 & 2032
- Table 39: Global Non-GMO Textured Soy Protein Industry Revenue Million Forecast, by Type 2019 & 2032
- Table 40: Global Non-GMO Textured Soy Protein Industry Revenue Million Forecast, by Application 2019 & 2032
- Table 41: Global Non-GMO Textured Soy Protein Industry Revenue Million Forecast, by Country 2019 & 2032
- Table 42: Germany Non-GMO Textured Soy Protein Industry Revenue (Million) Forecast, by Application 2019 & 2032
- Table 43: United Kingdom Non-GMO Textured Soy Protein Industry Revenue (Million) Forecast, by Application 2019 & 2032
- Table 44: France Non-GMO Textured Soy Protein Industry Revenue (Million) Forecast, by Application 2019 & 2032
- Table 45: Italy Non-GMO Textured Soy Protein Industry Revenue (Million) Forecast, by Application 2019 & 2032
- Table 46: Spain Non-GMO Textured Soy Protein Industry Revenue (Million) Forecast, by Application 2019 & 2032
- Table 47: Rest of Europe Non-GMO Textured Soy Protein Industry Revenue (Million) Forecast, by Application 2019 & 2032
- Table 48: Global Non-GMO Textured Soy Protein Industry Revenue Million Forecast, by Type 2019 & 2032
- Table 49: Global Non-GMO Textured Soy Protein Industry Revenue Million Forecast, by Application 2019 & 2032
- Table 50: Global Non-GMO Textured Soy Protein Industry Revenue Million Forecast, by Country 2019 & 2032
- Table 51: India Non-GMO Textured Soy Protein Industry Revenue (Million) Forecast, by Application 2019 & 2032
- Table 52: China Non-GMO Textured Soy Protein Industry Revenue (Million) Forecast, by Application 2019 & 2032
- Table 53: Japan Non-GMO Textured Soy Protein Industry Revenue (Million) Forecast, by Application 2019 & 2032
- Table 54: Australia Non-GMO Textured Soy Protein Industry Revenue (Million) Forecast, by Application 2019 & 2032
- Table 55: Rest of Asia Pacific Non-GMO Textured Soy Protein Industry Revenue (Million) Forecast, by Application 2019 & 2032
- Table 56: Global Non-GMO Textured Soy Protein Industry Revenue Million Forecast, by Type 2019 & 2032
- Table 57: Global Non-GMO Textured Soy Protein Industry Revenue Million Forecast, by Application 2019 & 2032
- Table 58: Global Non-GMO Textured Soy Protein Industry Revenue Million Forecast, by Country 2019 & 2032
- Table 59: Brazil Non-GMO Textured Soy Protein Industry Revenue (Million) Forecast, by Application 2019 & 2032
- Table 60: Argentina Non-GMO Textured Soy Protein Industry Revenue (Million) Forecast, by Application 2019 & 2032
- Table 61: Rest of South America Non-GMO Textured Soy Protein Industry Revenue (Million) Forecast, by Application 2019 & 2032
- Table 62: Global Non-GMO Textured Soy Protein Industry Revenue Million Forecast, by Type 2019 & 2032
- Table 63: Global Non-GMO Textured Soy Protein Industry Revenue Million Forecast, by Application 2019 & 2032
- Table 64: Global Non-GMO Textured Soy Protein Industry Revenue Million Forecast, by Country 2019 & 2032
- Table 65: South Africa Non-GMO Textured Soy Protein Industry Revenue (Million) Forecast, by Application 2019 & 2032
- Table 66: Saudi Arabia Non-GMO Textured Soy Protein Industry Revenue (Million) Forecast, by Application 2019 & 2032
- Table 67: Rest of Middle East and Africa Non-GMO Textured Soy Protein Industry Revenue (Million) Forecast, by Application 2019 & 2032
Frequently Asked Questions
1. What is the projected Compound Annual Growth Rate (CAGR) of the Non-GMO Textured Soy Protein Industry?
The projected CAGR is approximately 7.54%.
2. Which companies are prominent players in the Non-GMO Textured Soy Protein Industry?
Key companies in the market include Wilmar International Limited, Cargill Incorporated, The Archer-Daniels-Midland Company, Crown Soya Protein Group, DuPont de Nemours Inc, Sonic Bioche, Victoria Group, Bremil Group, Hoya Food.
3. What are the main segments of the Non-GMO Textured Soy Protein Industry?
The market segments include Type, Application.
4. Can you provide details about the market size?
The market size is estimated to be USD XX Million as of 2022.
5. What are some drivers contributing to market growth?
Increasing Demand for Vegan Food & Beverages Driving the Market; Intolerance and Allergies Associated with Animal Protein Products.
6. What are the notable trends driving market growth?
Non-GMO Textured Soy Protein to gain Prominence.
7. Are there any restraints impacting market growth?
High Market Penetration of Animal Protein.
8. Can you provide examples of recent developments in the market?
N/A
9. What pricing options are available for accessing the report?
Pricing options include single-user, multi-user, and enterprise licenses priced at USD 4750, USD 5250, and USD 8750 respectively.
10. Is the market size provided in terms of value or volume?
The market size is provided in terms of value, measured in Million.
11. Are there any specific market keywords associated with the report?
Yes, the market keyword associated with the report is "Non-GMO Textured Soy Protein Industry," which aids in identifying and referencing the specific market segment covered.
12. How do I determine which pricing option suits my needs best?
The pricing options vary based on user requirements and access needs. Individual users may opt for single-user licenses, while businesses requiring broader access may choose multi-user or enterprise licenses for cost-effective access to the report.
13. Are there any additional resources or data provided in the Non-GMO Textured Soy Protein Industry report?
While the report offers comprehensive insights, it's advisable to review the specific contents or supplementary materials provided to ascertain if additional resources or data are available.
14. How can I stay updated on further developments or reports in the Non-GMO Textured Soy Protein Industry?
To stay informed about further developments, trends, and reports in the Non-GMO Textured Soy Protein Industry, consider subscribing to industry newsletters, following relevant companies and organizations, or regularly checking reputable industry news sources and publications.
Methodology
Step 1 - Identification of Relevant Samples Size from Population Database


Step 2 - Approaches for Defining Global Market Size (Value, Volume* & Price*)

Note*: In applicable scenarios
Step 3 - Data Sources
Primary Research
- Web Analytics
- Survey Reports
- Research Institute
- Latest Research Reports
- Opinion Leaders
Secondary Research
- Annual Reports
- White Paper
- Latest Press Release
- Industry Association
- Paid Database
- Investor Presentations

Step 4 - Data Triangulation
Involves using different sources of information in order to increase the validity of a study
These sources are likely to be stakeholders in a program - participants, other researchers, program staff, other community members, and so on.
Then we put all data in single framework & apply various statistical tools to find out the dynamic on the market.
During the analysis stage, feedback from the stakeholder groups would be compared to determine areas of agreement as well as areas of divergence


