

Key Insights
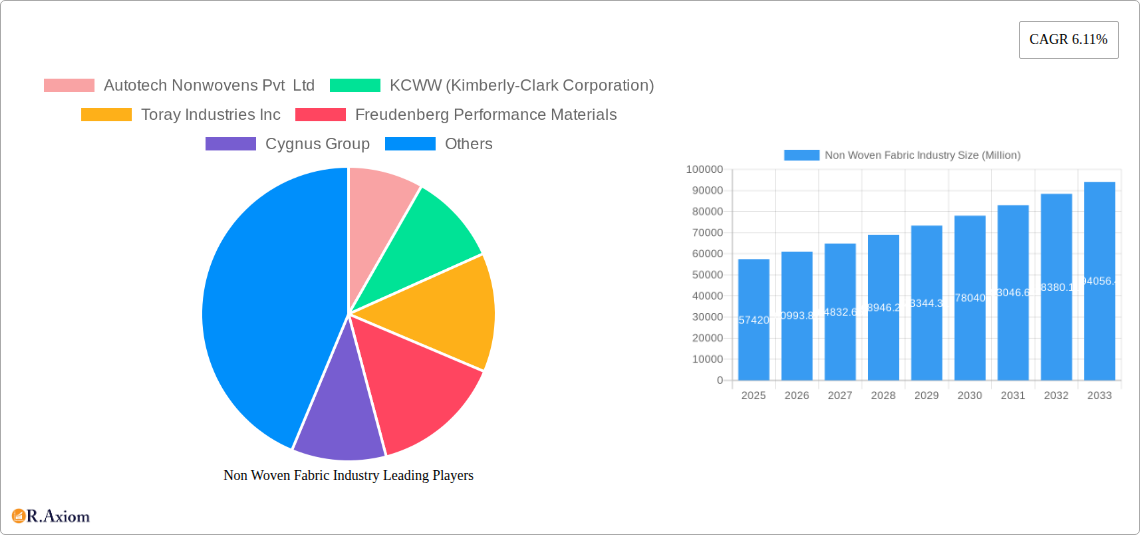
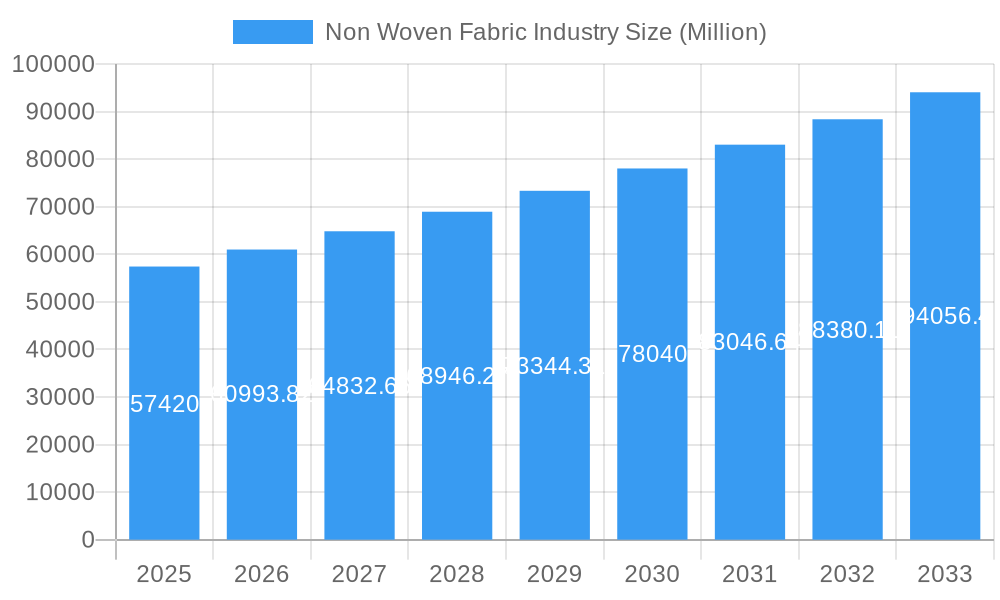
The global non-woven fabric market, valued at $57.42 billion in 2025, is projected to experience robust growth, driven by a compound annual growth rate (CAGR) of 6.11% from 2025 to 2033. This expansion is fueled by several key factors. The increasing demand for hygiene products like wipes and masks, particularly amplified by recent global health concerns, significantly boosts the market. Simultaneously, the construction industry's rising adoption of non-wovens for insulation and filtration applications contributes to market growth. Furthermore, the automotive sector's utilization of non-wovens in interior components and filtration systems further strengthens market demand. Technological advancements in spun-bond, meltblown, and wet-laid technologies are also driving innovation and expanding the applications of non-woven fabrics across diverse sectors. Polypropylene remains the dominant material due to its cost-effectiveness and versatile properties, although the growing interest in sustainable materials like bio-based alternatives is expected to gradually shift market dynamics in the coming years. Regional variations exist, with North America and Asia Pacific expected to remain key markets, driven by strong industrial growth and increasing consumer demand. However, regulatory changes concerning environmental impact and material sourcing could present challenges, influencing material selection and manufacturing processes.
Non Woven Fabric Industry Market Size (In Billion)
The competitive landscape is marked by a mix of large multinational corporations and regional players. Companies like Kimberly-Clark, Toray Industries, and Freudenberg Performance Materials hold significant market share due to their established brand recognition and extensive product portfolios. However, smaller, specialized companies are also contributing significantly, especially in niche applications. The market is witnessing increased mergers and acquisitions, further consolidating the industry. Future growth will hinge on the continued development of innovative materials with enhanced performance characteristics, a focus on sustainability and eco-friendly production methods, and the expansion into new and emerging application areas, including advanced filtration systems and medical textiles. This dynamic market environment requires agile strategies and continuous adaptation to maintain competitiveness.
Non Woven Fabric Industry Company Market Share
Non Woven Fabric Industry: A Comprehensive Market Report (2019-2033)
This comprehensive report provides a detailed analysis of the Non Woven Fabric industry, covering market size, segmentation, growth drivers, challenges, and future outlook. The study period spans from 2019 to 2033, with 2025 as the base and estimated year. The report offers actionable insights for industry stakeholders, investors, and businesses operating within this dynamic sector. The global market value is estimated at xx Million in 2025 and is projected to reach xx Million by 2033, exhibiting a CAGR of xx% during the forecast period (2025-2033).
Non Woven Fabric Industry Market Concentration & Innovation
The nonwoven fabric industry exhibits a moderately concentrated market structure, with several key players holding significant market share. The top five companies, including KCWW (Kimberly-Clark Corporation), Toray Industries Inc, Freudenberg Performance Materials, Ahlstrom-Munksj, and DuPont, collectively account for an estimated xx% of the global market in 2025. However, a significant number of smaller regional players and specialized manufacturers also contribute significantly to the overall market.
Market innovation is driven by several key factors:
- Technological advancements: Continuous improvements in spun-bond, meltblown, wet-laid, and dry-laid technologies are leading to the development of higher-performance, cost-effective nonwovens.
- Material diversification: The industry is witnessing increased use of sustainable and bio-based materials like cotton and other bio-based alternatives alongside traditional materials like polyester, polypropylene, and polyethylene.
- Product application expansion: Nonwovens are finding wider applications across diverse end-user industries, driven by factors like rising demand for hygiene products and increasing construction activities.
- Regulatory landscape: Stringent environmental regulations are pushing manufacturers to adopt more sustainable practices, creating opportunities for eco-friendly nonwoven solutions.
Mergers and acquisitions (M&A) are increasingly prevalent, with deal values in the past five years totaling approximately xx Million. Recent examples include the formation of AJ Nonwovens by Asten Johnson (June 2022), reflecting a trend of consolidation and expansion within the industry. The competitive landscape is characterized by both intense competition and strategic collaborations, leading to ongoing innovation and market evolution. The presence of numerous substitutes for non-woven fabrics, such as woven fabrics and other materials, also necessitates continuous innovation to maintain market share.
Non Woven Fabric Industry Industry Trends & Insights
The nonwoven fabric industry is experiencing a period of significant and sustained growth, propelled by a dynamic interplay of escalating demand and evolving consumer preferences. The persistent need for enhanced hygiene products, including advanced wipes and absorbent diapers, coupled with the critical applications in the healthcare sector – such as surgical gowns, masks, and medical drapes – continues to be a primary growth driver. Concurrently, the robust expansion of the global construction industry, particularly in burgeoning economies, is a substantial contributor. Nonwovens are increasingly indispensable in geotextiles for soil stabilization and drainage, high-performance insulation materials, and durable roofing membranes, all of which are vital for infrastructure development.
The automotive sector is also a key beneficiary, integrating lightweight and effective nonwoven fabrics for a variety of interior components, sophisticated filtration systems, and advanced acoustic insulation solutions, all contributing to enhanced vehicle performance, comfort, and fuel efficiency. This diverse demand landscape fuels the market's expansion. The global nonwoven market showcases a well-established high penetration rate (estimated at around **75%**) in developed regions, while developing economies are demonstrating rapidly increasing adoption rates, signaling substantial untapped potential.
Technological innovation is profoundly reshaping the competitive environment. Advancements in meltblown technology are enabling the production of finer fibers and higher-efficiency filters, crucial for medical and filtration applications. Simultaneously, the burgeoning demand for sustainable solutions is driving significant progress in the development of biodegradable and compostable nonwoven fabrics. These eco-friendly alternatives, derived from renewable resources like polylactic acid (PLA) and cellulose, are meeting consumer calls for reduced environmental impact and aligning with global sustainability initiatives. The overall market trajectory points to substantial growth potential. The Compound Annual Growth Rate (CAGR) of the nonwoven fabric market during the forecast period (2025-2033) is projected to be approximately **8.5%**. This impressive growth is being fueled by the burgeoning demand from diverse end-use sectors, continuous technological advancements in production processes and material science, and a growing global awareness of the environmental benefits of nonwoven materials compared to traditional textiles and plastics. The competitive dynamics are characterized by a blend of intense price competition and a strong emphasis on innovation-driven differentiation, with companies vying to offer superior performance, sustainability, and cost-effectiveness.
Dominant Markets & Segments in Non Woven Fabric Industry
Leading Regions & Countries: The Asia-Pacific region stands out as the dominant force in both the production and consumption of nonwoven fabrics. This leadership is attributed to its robust economic expansion, rapid industrialization, and a vast, growing population that fuels demand across various sectors. China and India, in particular, are pivotal markets within this region, showcasing substantial manufacturing capabilities and consumer bases. North America and Europe also maintain significant market shares, characterized by high per capita consumption rates, driven by advanced economies and strong demand from established industries like healthcare and automotive.
Dominant Segments:
- Technology: The spun-bond technology continues to command the largest market share due to its inherent versatility, cost-effectiveness, and suitability for a wide array of applications. However, meltblown technology is experiencing particularly rapid growth. This surge is directly linked to the escalating global demand for high-performance personal protective equipment (PPE) and advanced filtration media, where its superior barrier properties are critical.
- Material: Polypropylene remains the most extensively utilized material, owing to its attractive cost-performance ratio and excellent inherent properties like strength and water repellency. Nevertheless, polyester and other emerging materials, including a variety of bio-based and recycled options, are steadily gaining traction. This shift is driven by specific application requirements demanding enhanced durability, flame resistance, or biodegradability, as well as the growing imperative to address environmental concerns.
- End-user Industry: While the healthcare sector currently represents one of the most significant consumers of nonwoven fabrics, the construction and automotive industries are poised for substantial growth in the coming years, driven by infrastructure development and evolving vehicle manufacturing trends, respectively. Other key end-user industries, such as agriculture (for crop covers and weed barriers), industrial insulation, and apparel, are exhibiting consistent and steady growth, further diversifying the market's application base.
Key Drivers:
- Economic Growth and Infrastructure Development: The sustained global economic expansion and substantial investments in infrastructure projects, especially in developing nations, directly stimulate the demand for nonwovens. These materials are integral to modern construction techniques and infrastructure maintenance.
- Technological Advancements: Continuous improvements in nonwoven production processes, breakthroughs in material science, and enhancements in manufacturing capabilities are paramount. These advancements lead to increased production efficiency, reduced manufacturing costs, and the development of novel nonwoven materials with superior performance characteristics.
- Government Policies and Regulations: Favorable government policies, stringent environmental regulations, and initiatives promoting the use of sustainable materials and eco-friendly manufacturing practices act as significant catalysts for the nonwoven fabric industry, encouraging innovation and market adoption of greener alternatives.
Non Woven Fabric Industry Product Developments
Recent product innovations include the development of advanced filtration media with enhanced efficiency, antimicrobial nonwovens for hygiene applications, and biodegradable nonwovens made from sustainable materials. These innovations offer improved performance, sustainability, and functionality, broadening the application range of nonwoven fabrics. The competitive advantage lies in creating products with superior properties, cost-effectiveness, and sustainability features, catering to specific end-user needs. This includes offering customized solutions and leveraging advanced technologies to enhance product attributes.
Report Scope & Segmentation Analysis
This report segments the nonwoven fabric market based on technology (spun-bond, wet-laid, dry-laid, meltblown, and others), material (polyester, polypropylene, polyethylene, rayon, and others), and end-user industry (construction, textile, healthcare, automotive, and others). Each segment's market size, growth projections, and competitive dynamics are analyzed in detail. For instance, the spun-bond segment is projected to witness a xx% CAGR, while the healthcare segment is anticipated to show significant growth due to rising healthcare spending and an aging population.
Key Drivers of Non Woven Fabric Industry Growth
The nonwoven fabric industry's growth is fueled by technological advancements resulting in cost-effective production and improved material properties. Expanding applications in diverse sectors, especially healthcare and construction, drive demand. Stringent environmental regulations are accelerating the adoption of sustainable nonwovens, creating significant growth opportunities. Economic growth in developing nations also contributes to increased consumption, driving market expansion further.
Challenges in the Non Woven Fabric Industry Sector
The nonwoven fabric industry navigates several significant challenges that influence its growth and profitability. Fluctuations in the prices of raw materials, such as crude oil derivatives, can directly impact production costs, affecting profitability margins and overall competitiveness. The increasing stringency of environmental regulations globally, coupled with the growing consumer and industry demand for sustainable and circular economy solutions, necessitates substantial and ongoing investments in research and development to innovate greener materials and processes. Intense global competition, particularly from manufacturers in low-cost regions, exerts considerable pricing pressures on market participants. Furthermore, potential supply chain disruptions, whether due to geopolitical events, natural disasters, or logistical bottlenecks, can impact the timely availability of raw materials and finished products, thereby affecting market stability and operational continuity.
Emerging Opportunities in Non Woven Fabric Industry
Emerging opportunities include the growing demand for sustainable and biodegradable nonwovens made from recycled materials or renewable resources. The expansion into new application areas, such as advanced filtration systems and smart textiles, presents high-growth potential. Technological advancements in material science and manufacturing processes open doors for creating high-performance nonwovens with unique properties.
Leading Players in the Non Woven Fabric Industry Market
- Autotech Nonwovens Pvt Ltd
- KCWW (Kimberly-Clark Corporation)
- Toray Industries Inc
- Freudenberg Performance Materials
- Cygnus Group
- TWE Group
- PFNonwovens Czech SRO
- Eximius Incorporation
- Glatfelter
- DuPont
- Ahlstrom-Munksj
- Fitesa
- Johns Manville
- Paramount Tech Fab Industries
- Berry Global Inc
Key Developments in Non Woven Fabric Industry Industry
- June 2022: Asten Johnson significantly bolstered its market presence in North America with the launch of AJ Nonwovens. This strategic initiative was aimed at substantially expanding production capacity and improving delivery speeds in a key strategic market, reinforcing its competitive position.
- August 2022: WINFAB demonstrated its commitment to growth within the geosynthetics sector by investing in a new, state-of-the-art nonwoven geotextile production line. This investment not only expanded its manufacturing capabilities within the U.S. but also signaled confidence in the burgeoning demand for advanced geotextile solutions.
Strategic Outlook for Non Woven Fabric Industry Market
The nonwoven fabric industry is poised for sustained growth, driven by increasing demand across various sectors. Innovation in material science and manufacturing processes will be crucial for maintaining competitiveness. Companies focusing on sustainability and developing eco-friendly solutions will be best positioned to capitalize on emerging opportunities. The market's future growth hinges on addressing sustainability concerns, embracing technological advancements, and adapting to evolving consumer preferences.
Non Woven Fabric Industry Segmentation
-
1. Technology
- 1.1. Spun-bond
- 1.2. Wet-laid
- 1.3. Dry-laid
- 1.4. Other Technologies (Meltblown, and others)
-
2. Material
- 2.1. Polyester
- 2.2. Polypropylene
- 2.3. Polyethylene
- 2.4. Rayon (Viscose)
- 2.5. Other Materials (Cotton and other bio based)
-
3. End-user Industry
- 3.1. Construction
- 3.2. Textile
- 3.3. Healthcare
- 3.4. Automotive
- 3.5. Other En
Non Woven Fabric Industry Segmentation By Geography
-
1. Asia Pacific
- 1.1. China
- 1.2. India
- 1.3. Japan
- 1.4. South Korea
- 1.5. Malaysia
- 1.6. Thailand
- 1.7. Indonesia
- 1.8. Vietnam
- 1.9. Rest of Asia Pacific
-
2. North America
- 2.1. United States
- 2.2. Canada
- 2.3. Mexico
-
3. Europe
- 3.1. Germany
- 3.2. United Kingdom
- 3.3. France
- 3.4. Italy
- 3.5. Spain
- 3.6. Turkey
- 3.7. Russia
- 3.8. NORDIC Countries
- 3.9. Rest of Europe
-
4. South America
- 4.1. Brazil
- 4.2. Argentina
- 4.3. Colombia
- 4.4. Rest of South America
-
5. Middle East and Africa
- 5.1. Saudi Arabia
- 5.2. Nigeria
- 5.3. Qatar
- 5.4. Egypt
- 5.5. United Arab Emirates
- 5.6. South Africa
- 5.7. Rest of Middle East and Africa
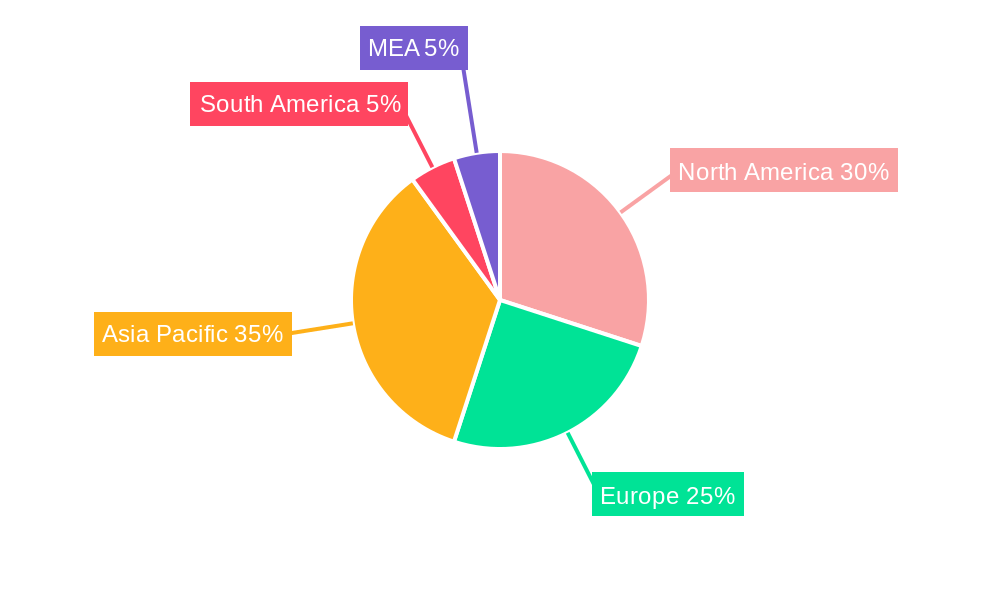
Non Woven Fabric Industry Regional Market Share
Geographic Coverage of Non Woven Fabric Industry
Non Woven Fabric Industry REPORT HIGHLIGHTS
| Aspects | Details |
|---|---|
| Study Period | 2020-2034 |
| Base Year | 2025 |
| Estimated Year | 2026 |
| Forecast Period | 2026-2034 |
| Historical Period | 2020-2025 |
| Growth Rate | CAGR of 6.11% from 2020-2034 |
| Segmentation |
|
Table of Contents
- 1. Introduction
- 1.1. Research Scope
- 1.2. Market Segmentation
- 1.3. Research Objective
- 1.4. Definitions and Assumptions
- 2. Executive Summary
- 2.1. Market Snapshot
- 3. Market Dynamics
- 3.1. Market Drivers
- 3.2. Market Restrains
- 3.3. Market Trends
- 3.4. Market Opportunities
- 4. Market Factor Analysis
- 4.1. Porters Five Forces
- 4.1.1. Bargaining Power of Suppliers
- 4.1.2. Bargaining Power of Buyers
- 4.1.3. Threat of New Entrants
- 4.1.4. Threat of Substitutes
- 4.1.5. Competitive Rivalry
- 4.2. PESTEL analysis
- 4.3. BCG Analysis
- 4.3.1. Stars (High Growth, High Market Share)
- 4.3.2. Cash Cows (Low Growth, High Market Share)
- 4.3.3. Question Mark (High Growth, Low Market Share)
- 4.3.4. Dogs (Low Growth, Low Market Share)
- 4.4. Ansoff Matrix Analysis
- 4.5. Supply Chain Analysis
- 4.6. Regulatory Landscape
- 4.7. Current Market Potential and Opportunity Assessment (TAM–SAM–SOM Framework)
- 4.8. RAX Analyst Note
- 4.1. Porters Five Forces
- 5. Market Analysis, Insights and Forecast 2021-2033
- 5.1. Market Analysis, Insights and Forecast - by Technology
- 5.1.1. Spun-bond
- 5.1.2. Wet-laid
- 5.1.3. Dry-laid
- 5.1.4. Other Technologies (Meltblown, and others)
- 5.2. Market Analysis, Insights and Forecast - by Material
- 5.2.1. Polyester
- 5.2.2. Polypropylene
- 5.2.3. Polyethylene
- 5.2.4. Rayon (Viscose)
- 5.2.5. Other Materials (Cotton and other bio based)
- 5.3. Market Analysis, Insights and Forecast - by End-user Industry
- 5.3.1. Construction
- 5.3.2. Textile
- 5.3.3. Healthcare
- 5.3.4. Automotive
- 5.3.5. Other En
- 5.4. Market Analysis, Insights and Forecast - by Region
- 5.4.1. Asia Pacific
- 5.4.2. North America
- 5.4.3. Europe
- 5.4.4. South America
- 5.4.5. Middle East and Africa
- 5.1. Market Analysis, Insights and Forecast - by Technology
- 6. Global Non Woven Fabric Industry Analysis, Insights and Forecast, 2021-2033
- 6.1. Market Analysis, Insights and Forecast - by Technology
- 6.1.1. Spun-bond
- 6.1.2. Wet-laid
- 6.1.3. Dry-laid
- 6.1.4. Other Technologies (Meltblown, and others)
- 6.2. Market Analysis, Insights and Forecast - by Material
- 6.2.1. Polyester
- 6.2.2. Polypropylene
- 6.2.3. Polyethylene
- 6.2.4. Rayon (Viscose)
- 6.2.5. Other Materials (Cotton and other bio based)
- 6.3. Market Analysis, Insights and Forecast - by End-user Industry
- 6.3.1. Construction
- 6.3.2. Textile
- 6.3.3. Healthcare
- 6.3.4. Automotive
- 6.3.5. Other En
- 6.1. Market Analysis, Insights and Forecast - by Technology
- 7. Asia Pacific Non Woven Fabric Industry Analysis, Insights and Forecast, 2020-2032
- 7.1. Market Analysis, Insights and Forecast - by Technology
- 7.1.1. Spun-bond
- 7.1.2. Wet-laid
- 7.1.3. Dry-laid
- 7.1.4. Other Technologies (Meltblown, and others)
- 7.2. Market Analysis, Insights and Forecast - by Material
- 7.2.1. Polyester
- 7.2.2. Polypropylene
- 7.2.3. Polyethylene
- 7.2.4. Rayon (Viscose)
- 7.2.5. Other Materials (Cotton and other bio based)
- 7.3. Market Analysis, Insights and Forecast - by End-user Industry
- 7.3.1. Construction
- 7.3.2. Textile
- 7.3.3. Healthcare
- 7.3.4. Automotive
- 7.3.5. Other En
- 7.1. Market Analysis, Insights and Forecast - by Technology
- 8. North America Non Woven Fabric Industry Analysis, Insights and Forecast, 2020-2032
- 8.1. Market Analysis, Insights and Forecast - by Technology
- 8.1.1. Spun-bond
- 8.1.2. Wet-laid
- 8.1.3. Dry-laid
- 8.1.4. Other Technologies (Meltblown, and others)
- 8.2. Market Analysis, Insights and Forecast - by Material
- 8.2.1. Polyester
- 8.2.2. Polypropylene
- 8.2.3. Polyethylene
- 8.2.4. Rayon (Viscose)
- 8.2.5. Other Materials (Cotton and other bio based)
- 8.3. Market Analysis, Insights and Forecast - by End-user Industry
- 8.3.1. Construction
- 8.3.2. Textile
- 8.3.3. Healthcare
- 8.3.4. Automotive
- 8.3.5. Other En
- 8.1. Market Analysis, Insights and Forecast - by Technology
- 9. Europe Non Woven Fabric Industry Analysis, Insights and Forecast, 2020-2032
- 9.1. Market Analysis, Insights and Forecast - by Technology
- 9.1.1. Spun-bond
- 9.1.2. Wet-laid
- 9.1.3. Dry-laid
- 9.1.4. Other Technologies (Meltblown, and others)
- 9.2. Market Analysis, Insights and Forecast - by Material
- 9.2.1. Polyester
- 9.2.2. Polypropylene
- 9.2.3. Polyethylene
- 9.2.4. Rayon (Viscose)
- 9.2.5. Other Materials (Cotton and other bio based)
- 9.3. Market Analysis, Insights and Forecast - by End-user Industry
- 9.3.1. Construction
- 9.3.2. Textile
- 9.3.3. Healthcare
- 9.3.4. Automotive
- 9.3.5. Other En
- 9.1. Market Analysis, Insights and Forecast - by Technology
- 10. South America Non Woven Fabric Industry Analysis, Insights and Forecast, 2020-2032
- 10.1. Market Analysis, Insights and Forecast - by Technology
- 10.1.1. Spun-bond
- 10.1.2. Wet-laid
- 10.1.3. Dry-laid
- 10.1.4. Other Technologies (Meltblown, and others)
- 10.2. Market Analysis, Insights and Forecast - by Material
- 10.2.1. Polyester
- 10.2.2. Polypropylene
- 10.2.3. Polyethylene
- 10.2.4. Rayon (Viscose)
- 10.2.5. Other Materials (Cotton and other bio based)
- 10.3. Market Analysis, Insights and Forecast - by End-user Industry
- 10.3.1. Construction
- 10.3.2. Textile
- 10.3.3. Healthcare
- 10.3.4. Automotive
- 10.3.5. Other En
- 10.1. Market Analysis, Insights and Forecast - by Technology
- 11. Middle East and Africa Non Woven Fabric Industry Analysis, Insights and Forecast, 2020-2032
- 11.1. Market Analysis, Insights and Forecast - by Technology
- 11.1.1. Spun-bond
- 11.1.2. Wet-laid
- 11.1.3. Dry-laid
- 11.1.4. Other Technologies (Meltblown, and others)
- 11.2. Market Analysis, Insights and Forecast - by Material
- 11.2.1. Polyester
- 11.2.2. Polypropylene
- 11.2.3. Polyethylene
- 11.2.4. Rayon (Viscose)
- 11.2.5. Other Materials (Cotton and other bio based)
- 11.3. Market Analysis, Insights and Forecast - by End-user Industry
- 11.3.1. Construction
- 11.3.2. Textile
- 11.3.3. Healthcare
- 11.3.4. Automotive
- 11.3.5. Other En
- 11.1. Market Analysis, Insights and Forecast - by Technology
- 12. Competitive Analysis
- 12.1. Company Profiles
- 12.1.1 Autotech Nonwovens Pvt Ltd
- 12.1.1.1. Company Overview
- 12.1.1.2. Products
- 12.1.1.3. Company Financials
- 12.1.1.4. SWOT Analysis
- 12.1.2 KCWW (Kimberly-Clark Corporation)
- 12.1.2.1. Company Overview
- 12.1.2.2. Products
- 12.1.2.3. Company Financials
- 12.1.2.4. SWOT Analysis
- 12.1.3 Toray Industries Inc
- 12.1.3.1. Company Overview
- 12.1.3.2. Products
- 12.1.3.3. Company Financials
- 12.1.3.4. SWOT Analysis
- 12.1.4 Freudenberg Performance Materials
- 12.1.4.1. Company Overview
- 12.1.4.2. Products
- 12.1.4.3. Company Financials
- 12.1.4.4. SWOT Analysis
- 12.1.5 Cygnus Group
- 12.1.5.1. Company Overview
- 12.1.5.2. Products
- 12.1.5.3. Company Financials
- 12.1.5.4. SWOT Analysis
- 12.1.6 TWE Group*List Not Exhaustive
- 12.1.6.1. Company Overview
- 12.1.6.2. Products
- 12.1.6.3. Company Financials
- 12.1.6.4. SWOT Analysis
- 12.1.7 PFNonwovens Czech SRO
- 12.1.7.1. Company Overview
- 12.1.7.2. Products
- 12.1.7.3. Company Financials
- 12.1.7.4. SWOT Analysis
- 12.1.8 Eximius Incorporation
- 12.1.8.1. Company Overview
- 12.1.8.2. Products
- 12.1.8.3. Company Financials
- 12.1.8.4. SWOT Analysis
- 12.1.9 Glatfelter
- 12.1.9.1. Company Overview
- 12.1.9.2. Products
- 12.1.9.3. Company Financials
- 12.1.9.4. SWOT Analysis
- 12.1.10 DuPont
- 12.1.10.1. Company Overview
- 12.1.10.2. Products
- 12.1.10.3. Company Financials
- 12.1.10.4. SWOT Analysis
- 12.1.11 Ahlstrom-Munksj
- 12.1.11.1. Company Overview
- 12.1.11.2. Products
- 12.1.11.3. Company Financials
- 12.1.11.4. SWOT Analysis
- 12.1.12 Fitesa
- 12.1.12.1. Company Overview
- 12.1.12.2. Products
- 12.1.12.3. Company Financials
- 12.1.12.4. SWOT Analysis
- 12.1.13 Johns Manville
- 12.1.13.1. Company Overview
- 12.1.13.2. Products
- 12.1.13.3. Company Financials
- 12.1.13.4. SWOT Analysis
- 12.1.14 Paramount Tech Fab Industries
- 12.1.14.1. Company Overview
- 12.1.14.2. Products
- 12.1.14.3. Company Financials
- 12.1.14.4. SWOT Analysis
- 12.1.15 Berry Global Inc
- 12.1.15.1. Company Overview
- 12.1.15.2. Products
- 12.1.15.3. Company Financials
- 12.1.15.4. SWOT Analysis
- 12.1.1 Autotech Nonwovens Pvt Ltd
- 12.2. Market Entropy
- 12.2.1 Company's Key Areas Served
- 12.2.2 Recent Developments
- 12.3. Company Market Share Analysis 2025
- 12.3.1 Top 5 Companies Market Share Analysis
- 12.3.2 Top 3 Companies Market Share Analysis
- 12.4. List of Potential Customers
- 13. Research Methodology
List of Figures
- Figure 1: Global Non Woven Fabric Industry Revenue Breakdown (Million, %) by Region 2025 & 2033
- Figure 2: Global Non Woven Fabric Industry Volume Breakdown (K Tons, %) by Region 2025 & 2033
- Figure 3: Asia Pacific Non Woven Fabric Industry Revenue (Million), by Technology 2025 & 2033
- Figure 4: Asia Pacific Non Woven Fabric Industry Volume (K Tons), by Technology 2025 & 2033
- Figure 5: Asia Pacific Non Woven Fabric Industry Revenue Share (%), by Technology 2025 & 2033
- Figure 6: Asia Pacific Non Woven Fabric Industry Volume Share (%), by Technology 2025 & 2033
- Figure 7: Asia Pacific Non Woven Fabric Industry Revenue (Million), by Material 2025 & 2033
- Figure 8: Asia Pacific Non Woven Fabric Industry Volume (K Tons), by Material 2025 & 2033
- Figure 9: Asia Pacific Non Woven Fabric Industry Revenue Share (%), by Material 2025 & 2033
- Figure 10: Asia Pacific Non Woven Fabric Industry Volume Share (%), by Material 2025 & 2033
- Figure 11: Asia Pacific Non Woven Fabric Industry Revenue (Million), by End-user Industry 2025 & 2033
- Figure 12: Asia Pacific Non Woven Fabric Industry Volume (K Tons), by End-user Industry 2025 & 2033
- Figure 13: Asia Pacific Non Woven Fabric Industry Revenue Share (%), by End-user Industry 2025 & 2033
- Figure 14: Asia Pacific Non Woven Fabric Industry Volume Share (%), by End-user Industry 2025 & 2033
- Figure 15: Asia Pacific Non Woven Fabric Industry Revenue (Million), by Country 2025 & 2033
- Figure 16: Asia Pacific Non Woven Fabric Industry Volume (K Tons), by Country 2025 & 2033
- Figure 17: Asia Pacific Non Woven Fabric Industry Revenue Share (%), by Country 2025 & 2033
- Figure 18: Asia Pacific Non Woven Fabric Industry Volume Share (%), by Country 2025 & 2033
- Figure 19: North America Non Woven Fabric Industry Revenue (Million), by Technology 2025 & 2033
- Figure 20: North America Non Woven Fabric Industry Volume (K Tons), by Technology 2025 & 2033
- Figure 21: North America Non Woven Fabric Industry Revenue Share (%), by Technology 2025 & 2033
- Figure 22: North America Non Woven Fabric Industry Volume Share (%), by Technology 2025 & 2033
- Figure 23: North America Non Woven Fabric Industry Revenue (Million), by Material 2025 & 2033
- Figure 24: North America Non Woven Fabric Industry Volume (K Tons), by Material 2025 & 2033
- Figure 25: North America Non Woven Fabric Industry Revenue Share (%), by Material 2025 & 2033
- Figure 26: North America Non Woven Fabric Industry Volume Share (%), by Material 2025 & 2033
- Figure 27: North America Non Woven Fabric Industry Revenue (Million), by End-user Industry 2025 & 2033
- Figure 28: North America Non Woven Fabric Industry Volume (K Tons), by End-user Industry 2025 & 2033
- Figure 29: North America Non Woven Fabric Industry Revenue Share (%), by End-user Industry 2025 & 2033
- Figure 30: North America Non Woven Fabric Industry Volume Share (%), by End-user Industry 2025 & 2033
- Figure 31: North America Non Woven Fabric Industry Revenue (Million), by Country 2025 & 2033
- Figure 32: North America Non Woven Fabric Industry Volume (K Tons), by Country 2025 & 2033
- Figure 33: North America Non Woven Fabric Industry Revenue Share (%), by Country 2025 & 2033
- Figure 34: North America Non Woven Fabric Industry Volume Share (%), by Country 2025 & 2033
- Figure 35: Europe Non Woven Fabric Industry Revenue (Million), by Technology 2025 & 2033
- Figure 36: Europe Non Woven Fabric Industry Volume (K Tons), by Technology 2025 & 2033
- Figure 37: Europe Non Woven Fabric Industry Revenue Share (%), by Technology 2025 & 2033
- Figure 38: Europe Non Woven Fabric Industry Volume Share (%), by Technology 2025 & 2033
- Figure 39: Europe Non Woven Fabric Industry Revenue (Million), by Material 2025 & 2033
- Figure 40: Europe Non Woven Fabric Industry Volume (K Tons), by Material 2025 & 2033
- Figure 41: Europe Non Woven Fabric Industry Revenue Share (%), by Material 2025 & 2033
- Figure 42: Europe Non Woven Fabric Industry Volume Share (%), by Material 2025 & 2033
- Figure 43: Europe Non Woven Fabric Industry Revenue (Million), by End-user Industry 2025 & 2033
- Figure 44: Europe Non Woven Fabric Industry Volume (K Tons), by End-user Industry 2025 & 2033
- Figure 45: Europe Non Woven Fabric Industry Revenue Share (%), by End-user Industry 2025 & 2033
- Figure 46: Europe Non Woven Fabric Industry Volume Share (%), by End-user Industry 2025 & 2033
- Figure 47: Europe Non Woven Fabric Industry Revenue (Million), by Country 2025 & 2033
- Figure 48: Europe Non Woven Fabric Industry Volume (K Tons), by Country 2025 & 2033
- Figure 49: Europe Non Woven Fabric Industry Revenue Share (%), by Country 2025 & 2033
- Figure 50: Europe Non Woven Fabric Industry Volume Share (%), by Country 2025 & 2033
- Figure 51: South America Non Woven Fabric Industry Revenue (Million), by Technology 2025 & 2033
- Figure 52: South America Non Woven Fabric Industry Volume (K Tons), by Technology 2025 & 2033
- Figure 53: South America Non Woven Fabric Industry Revenue Share (%), by Technology 2025 & 2033
- Figure 54: South America Non Woven Fabric Industry Volume Share (%), by Technology 2025 & 2033
- Figure 55: South America Non Woven Fabric Industry Revenue (Million), by Material 2025 & 2033
- Figure 56: South America Non Woven Fabric Industry Volume (K Tons), by Material 2025 & 2033
- Figure 57: South America Non Woven Fabric Industry Revenue Share (%), by Material 2025 & 2033
- Figure 58: South America Non Woven Fabric Industry Volume Share (%), by Material 2025 & 2033
- Figure 59: South America Non Woven Fabric Industry Revenue (Million), by End-user Industry 2025 & 2033
- Figure 60: South America Non Woven Fabric Industry Volume (K Tons), by End-user Industry 2025 & 2033
- Figure 61: South America Non Woven Fabric Industry Revenue Share (%), by End-user Industry 2025 & 2033
- Figure 62: South America Non Woven Fabric Industry Volume Share (%), by End-user Industry 2025 & 2033
- Figure 63: South America Non Woven Fabric Industry Revenue (Million), by Country 2025 & 2033
- Figure 64: South America Non Woven Fabric Industry Volume (K Tons), by Country 2025 & 2033
- Figure 65: South America Non Woven Fabric Industry Revenue Share (%), by Country 2025 & 2033
- Figure 66: South America Non Woven Fabric Industry Volume Share (%), by Country 2025 & 2033
- Figure 67: Middle East and Africa Non Woven Fabric Industry Revenue (Million), by Technology 2025 & 2033
- Figure 68: Middle East and Africa Non Woven Fabric Industry Volume (K Tons), by Technology 2025 & 2033
- Figure 69: Middle East and Africa Non Woven Fabric Industry Revenue Share (%), by Technology 2025 & 2033
- Figure 70: Middle East and Africa Non Woven Fabric Industry Volume Share (%), by Technology 2025 & 2033
- Figure 71: Middle East and Africa Non Woven Fabric Industry Revenue (Million), by Material 2025 & 2033
- Figure 72: Middle East and Africa Non Woven Fabric Industry Volume (K Tons), by Material 2025 & 2033
- Figure 73: Middle East and Africa Non Woven Fabric Industry Revenue Share (%), by Material 2025 & 2033
- Figure 74: Middle East and Africa Non Woven Fabric Industry Volume Share (%), by Material 2025 & 2033
- Figure 75: Middle East and Africa Non Woven Fabric Industry Revenue (Million), by End-user Industry 2025 & 2033
- Figure 76: Middle East and Africa Non Woven Fabric Industry Volume (K Tons), by End-user Industry 2025 & 2033
- Figure 77: Middle East and Africa Non Woven Fabric Industry Revenue Share (%), by End-user Industry 2025 & 2033
- Figure 78: Middle East and Africa Non Woven Fabric Industry Volume Share (%), by End-user Industry 2025 & 2033
- Figure 79: Middle East and Africa Non Woven Fabric Industry Revenue (Million), by Country 2025 & 2033
- Figure 80: Middle East and Africa Non Woven Fabric Industry Volume (K Tons), by Country 2025 & 2033
- Figure 81: Middle East and Africa Non Woven Fabric Industry Revenue Share (%), by Country 2025 & 2033
- Figure 82: Middle East and Africa Non Woven Fabric Industry Volume Share (%), by Country 2025 & 2033
List of Tables
- Table 1: Global Non Woven Fabric Industry Revenue Million Forecast, by Technology 2020 & 2033
- Table 2: Global Non Woven Fabric Industry Volume K Tons Forecast, by Technology 2020 & 2033
- Table 3: Global Non Woven Fabric Industry Revenue Million Forecast, by Material 2020 & 2033
- Table 4: Global Non Woven Fabric Industry Volume K Tons Forecast, by Material 2020 & 2033
- Table 5: Global Non Woven Fabric Industry Revenue Million Forecast, by End-user Industry 2020 & 2033
- Table 6: Global Non Woven Fabric Industry Volume K Tons Forecast, by End-user Industry 2020 & 2033
- Table 7: Global Non Woven Fabric Industry Revenue Million Forecast, by Region 2020 & 2033
- Table 8: Global Non Woven Fabric Industry Volume K Tons Forecast, by Region 2020 & 2033
- Table 9: Global Non Woven Fabric Industry Revenue Million Forecast, by Technology 2020 & 2033
- Table 10: Global Non Woven Fabric Industry Volume K Tons Forecast, by Technology 2020 & 2033
- Table 11: Global Non Woven Fabric Industry Revenue Million Forecast, by Material 2020 & 2033
- Table 12: Global Non Woven Fabric Industry Volume K Tons Forecast, by Material 2020 & 2033
- Table 13: Global Non Woven Fabric Industry Revenue Million Forecast, by End-user Industry 2020 & 2033
- Table 14: Global Non Woven Fabric Industry Volume K Tons Forecast, by End-user Industry 2020 & 2033
- Table 15: Global Non Woven Fabric Industry Revenue Million Forecast, by Country 2020 & 2033
- Table 16: Global Non Woven Fabric Industry Volume K Tons Forecast, by Country 2020 & 2033
- Table 17: China Non Woven Fabric Industry Revenue (Million) Forecast, by Application 2020 & 2033
- Table 18: China Non Woven Fabric Industry Volume (K Tons) Forecast, by Application 2020 & 2033
- Table 19: India Non Woven Fabric Industry Revenue (Million) Forecast, by Application 2020 & 2033
- Table 20: India Non Woven Fabric Industry Volume (K Tons) Forecast, by Application 2020 & 2033
- Table 21: Japan Non Woven Fabric Industry Revenue (Million) Forecast, by Application 2020 & 2033
- Table 22: Japan Non Woven Fabric Industry Volume (K Tons) Forecast, by Application 2020 & 2033
- Table 23: South Korea Non Woven Fabric Industry Revenue (Million) Forecast, by Application 2020 & 2033
- Table 24: South Korea Non Woven Fabric Industry Volume (K Tons) Forecast, by Application 2020 & 2033
- Table 25: Malaysia Non Woven Fabric Industry Revenue (Million) Forecast, by Application 2020 & 2033
- Table 26: Malaysia Non Woven Fabric Industry Volume (K Tons) Forecast, by Application 2020 & 2033
- Table 27: Thailand Non Woven Fabric Industry Revenue (Million) Forecast, by Application 2020 & 2033
- Table 28: Thailand Non Woven Fabric Industry Volume (K Tons) Forecast, by Application 2020 & 2033
- Table 29: Indonesia Non Woven Fabric Industry Revenue (Million) Forecast, by Application 2020 & 2033
- Table 30: Indonesia Non Woven Fabric Industry Volume (K Tons) Forecast, by Application 2020 & 2033
- Table 31: Vietnam Non Woven Fabric Industry Revenue (Million) Forecast, by Application 2020 & 2033
- Table 32: Vietnam Non Woven Fabric Industry Volume (K Tons) Forecast, by Application 2020 & 2033
- Table 33: Rest of Asia Pacific Non Woven Fabric Industry Revenue (Million) Forecast, by Application 2020 & 2033
- Table 34: Rest of Asia Pacific Non Woven Fabric Industry Volume (K Tons) Forecast, by Application 2020 & 2033
- Table 35: Global Non Woven Fabric Industry Revenue Million Forecast, by Technology 2020 & 2033
- Table 36: Global Non Woven Fabric Industry Volume K Tons Forecast, by Technology 2020 & 2033
- Table 37: Global Non Woven Fabric Industry Revenue Million Forecast, by Material 2020 & 2033
- Table 38: Global Non Woven Fabric Industry Volume K Tons Forecast, by Material 2020 & 2033
- Table 39: Global Non Woven Fabric Industry Revenue Million Forecast, by End-user Industry 2020 & 2033
- Table 40: Global Non Woven Fabric Industry Volume K Tons Forecast, by End-user Industry 2020 & 2033
- Table 41: Global Non Woven Fabric Industry Revenue Million Forecast, by Country 2020 & 2033
- Table 42: Global Non Woven Fabric Industry Volume K Tons Forecast, by Country 2020 & 2033
- Table 43: United States Non Woven Fabric Industry Revenue (Million) Forecast, by Application 2020 & 2033
- Table 44: United States Non Woven Fabric Industry Volume (K Tons) Forecast, by Application 2020 & 2033
- Table 45: Canada Non Woven Fabric Industry Revenue (Million) Forecast, by Application 2020 & 2033
- Table 46: Canada Non Woven Fabric Industry Volume (K Tons) Forecast, by Application 2020 & 2033
- Table 47: Mexico Non Woven Fabric Industry Revenue (Million) Forecast, by Application 2020 & 2033
- Table 48: Mexico Non Woven Fabric Industry Volume (K Tons) Forecast, by Application 2020 & 2033
- Table 49: Global Non Woven Fabric Industry Revenue Million Forecast, by Technology 2020 & 2033
- Table 50: Global Non Woven Fabric Industry Volume K Tons Forecast, by Technology 2020 & 2033
- Table 51: Global Non Woven Fabric Industry Revenue Million Forecast, by Material 2020 & 2033
- Table 52: Global Non Woven Fabric Industry Volume K Tons Forecast, by Material 2020 & 2033
- Table 53: Global Non Woven Fabric Industry Revenue Million Forecast, by End-user Industry 2020 & 2033
- Table 54: Global Non Woven Fabric Industry Volume K Tons Forecast, by End-user Industry 2020 & 2033
- Table 55: Global Non Woven Fabric Industry Revenue Million Forecast, by Country 2020 & 2033
- Table 56: Global Non Woven Fabric Industry Volume K Tons Forecast, by Country 2020 & 2033
- Table 57: Germany Non Woven Fabric Industry Revenue (Million) Forecast, by Application 2020 & 2033
- Table 58: Germany Non Woven Fabric Industry Volume (K Tons) Forecast, by Application 2020 & 2033
- Table 59: United Kingdom Non Woven Fabric Industry Revenue (Million) Forecast, by Application 2020 & 2033
- Table 60: United Kingdom Non Woven Fabric Industry Volume (K Tons) Forecast, by Application 2020 & 2033
- Table 61: France Non Woven Fabric Industry Revenue (Million) Forecast, by Application 2020 & 2033
- Table 62: France Non Woven Fabric Industry Volume (K Tons) Forecast, by Application 2020 & 2033
- Table 63: Italy Non Woven Fabric Industry Revenue (Million) Forecast, by Application 2020 & 2033
- Table 64: Italy Non Woven Fabric Industry Volume (K Tons) Forecast, by Application 2020 & 2033
- Table 65: Spain Non Woven Fabric Industry Revenue (Million) Forecast, by Application 2020 & 2033
- Table 66: Spain Non Woven Fabric Industry Volume (K Tons) Forecast, by Application 2020 & 2033
- Table 67: Turkey Non Woven Fabric Industry Revenue (Million) Forecast, by Application 2020 & 2033
- Table 68: Turkey Non Woven Fabric Industry Volume (K Tons) Forecast, by Application 2020 & 2033
- Table 69: Russia Non Woven Fabric Industry Revenue (Million) Forecast, by Application 2020 & 2033
- Table 70: Russia Non Woven Fabric Industry Volume (K Tons) Forecast, by Application 2020 & 2033
- Table 71: NORDIC Countries Non Woven Fabric Industry Revenue (Million) Forecast, by Application 2020 & 2033
- Table 72: NORDIC Countries Non Woven Fabric Industry Volume (K Tons) Forecast, by Application 2020 & 2033
- Table 73: Rest of Europe Non Woven Fabric Industry Revenue (Million) Forecast, by Application 2020 & 2033
- Table 74: Rest of Europe Non Woven Fabric Industry Volume (K Tons) Forecast, by Application 2020 & 2033
- Table 75: Global Non Woven Fabric Industry Revenue Million Forecast, by Technology 2020 & 2033
- Table 76: Global Non Woven Fabric Industry Volume K Tons Forecast, by Technology 2020 & 2033
- Table 77: Global Non Woven Fabric Industry Revenue Million Forecast, by Material 2020 & 2033
- Table 78: Global Non Woven Fabric Industry Volume K Tons Forecast, by Material 2020 & 2033
- Table 79: Global Non Woven Fabric Industry Revenue Million Forecast, by End-user Industry 2020 & 2033
- Table 80: Global Non Woven Fabric Industry Volume K Tons Forecast, by End-user Industry 2020 & 2033
- Table 81: Global Non Woven Fabric Industry Revenue Million Forecast, by Country 2020 & 2033
- Table 82: Global Non Woven Fabric Industry Volume K Tons Forecast, by Country 2020 & 2033
- Table 83: Brazil Non Woven Fabric Industry Revenue (Million) Forecast, by Application 2020 & 2033
- Table 84: Brazil Non Woven Fabric Industry Volume (K Tons) Forecast, by Application 2020 & 2033
- Table 85: Argentina Non Woven Fabric Industry Revenue (Million) Forecast, by Application 2020 & 2033
- Table 86: Argentina Non Woven Fabric Industry Volume (K Tons) Forecast, by Application 2020 & 2033
- Table 87: Colombia Non Woven Fabric Industry Revenue (Million) Forecast, by Application 2020 & 2033
- Table 88: Colombia Non Woven Fabric Industry Volume (K Tons) Forecast, by Application 2020 & 2033
- Table 89: Rest of South America Non Woven Fabric Industry Revenue (Million) Forecast, by Application 2020 & 2033
- Table 90: Rest of South America Non Woven Fabric Industry Volume (K Tons) Forecast, by Application 2020 & 2033
- Table 91: Global Non Woven Fabric Industry Revenue Million Forecast, by Technology 2020 & 2033
- Table 92: Global Non Woven Fabric Industry Volume K Tons Forecast, by Technology 2020 & 2033
- Table 93: Global Non Woven Fabric Industry Revenue Million Forecast, by Material 2020 & 2033
- Table 94: Global Non Woven Fabric Industry Volume K Tons Forecast, by Material 2020 & 2033
- Table 95: Global Non Woven Fabric Industry Revenue Million Forecast, by End-user Industry 2020 & 2033
- Table 96: Global Non Woven Fabric Industry Volume K Tons Forecast, by End-user Industry 2020 & 2033
- Table 97: Global Non Woven Fabric Industry Revenue Million Forecast, by Country 2020 & 2033
- Table 98: Global Non Woven Fabric Industry Volume K Tons Forecast, by Country 2020 & 2033
- Table 99: Saudi Arabia Non Woven Fabric Industry Revenue (Million) Forecast, by Application 2020 & 2033
- Table 100: Saudi Arabia Non Woven Fabric Industry Volume (K Tons) Forecast, by Application 2020 & 2033
- Table 101: Nigeria Non Woven Fabric Industry Revenue (Million) Forecast, by Application 2020 & 2033
- Table 102: Nigeria Non Woven Fabric Industry Volume (K Tons) Forecast, by Application 2020 & 2033
- Table 103: Qatar Non Woven Fabric Industry Revenue (Million) Forecast, by Application 2020 & 2033
- Table 104: Qatar Non Woven Fabric Industry Volume (K Tons) Forecast, by Application 2020 & 2033
- Table 105: Egypt Non Woven Fabric Industry Revenue (Million) Forecast, by Application 2020 & 2033
- Table 106: Egypt Non Woven Fabric Industry Volume (K Tons) Forecast, by Application 2020 & 2033
- Table 107: United Arab Emirates Non Woven Fabric Industry Revenue (Million) Forecast, by Application 2020 & 2033
- Table 108: United Arab Emirates Non Woven Fabric Industry Volume (K Tons) Forecast, by Application 2020 & 2033
- Table 109: South Africa Non Woven Fabric Industry Revenue (Million) Forecast, by Application 2020 & 2033
- Table 110: South Africa Non Woven Fabric Industry Volume (K Tons) Forecast, by Application 2020 & 2033
- Table 111: Rest of Middle East and Africa Non Woven Fabric Industry Revenue (Million) Forecast, by Application 2020 & 2033
- Table 112: Rest of Middle East and Africa Non Woven Fabric Industry Volume (K Tons) Forecast, by Application 2020 & 2033
Frequently Asked Questions
1. What is the projected Compound Annual Growth Rate (CAGR) of the Non Woven Fabric Industry?
The projected CAGR is approximately 6.11%.
2. Which companies are prominent players in the Non Woven Fabric Industry?
Key companies in the market include Autotech Nonwovens Pvt Ltd, KCWW (Kimberly-Clark Corporation), Toray Industries Inc, Freudenberg Performance Materials, Cygnus Group, TWE Group*List Not Exhaustive, PFNonwovens Czech SRO, Eximius Incorporation, Glatfelter, DuPont, Ahlstrom-Munksj, Fitesa, Johns Manville, Paramount Tech Fab Industries, Berry Global Inc.
3. What are the main segments of the Non Woven Fabric Industry?
The market segments include Technology, Material, End-user Industry.
4. Can you provide details about the market size?
The market size is estimated to be USD 57.42 Million as of 2022.
5. What are some drivers contributing to market growth?
Increasing Application in the Healthcare Industry; Growing Demand for Electric Vehicles; Other Drivers.
6. What are the notable trends driving market growth?
Increasing Demand from the Healthcare Industry.
7. Are there any restraints impacting market growth?
Low Durability and Strength of Fabric; Other Restraints.
8. Can you provide examples of recent developments in the market?
August 2022: Willacoochee Industrial Fabrics, Inc. (WINFAB), one of the leading manufacturers of geosynthetic and erosion control products in the United States, announced its investment into a new state-of-the-art nonwoven geotextile manufacturing production line in Nashville, GA. The production line was anticipated to begin operation by the second quarter of 2023.
9. What pricing options are available for accessing the report?
Pricing options include single-user, multi-user, and enterprise licenses priced at USD 4750, USD 5250, and USD 8750 respectively.
10. Is the market size provided in terms of value or volume?
The market size is provided in terms of value, measured in Million and volume, measured in K Tons.
11. Are there any specific market keywords associated with the report?
Yes, the market keyword associated with the report is "Non Woven Fabric Industry," which aids in identifying and referencing the specific market segment covered.
12. How do I determine which pricing option suits my needs best?
The pricing options vary based on user requirements and access needs. Individual users may opt for single-user licenses, while businesses requiring broader access may choose multi-user or enterprise licenses for cost-effective access to the report.
13. Are there any additional resources or data provided in the Non Woven Fabric Industry report?
While the report offers comprehensive insights, it's advisable to review the specific contents or supplementary materials provided to ascertain if additional resources or data are available.
14. How can I stay updated on further developments or reports in the Non Woven Fabric Industry?
To stay informed about further developments, trends, and reports in the Non Woven Fabric Industry, consider subscribing to industry newsletters, following relevant companies and organizations, or regularly checking reputable industry news sources and publications.
Methodology
Step 1 - Identification of Relevant Samples Size from Population Database


Step 2 - Approaches for Defining Global Market Size (Value, Volume* & Price*)

Note*: In applicable scenarios
Step 3 - Data Sources
Primary Research
- Web Analytics
- Survey Reports
- Research Institute
- Latest Research Reports
- Opinion Leaders
Secondary Research
- Annual Reports
- White Paper
- Latest Press Release
- Industry Association
- Paid Database
- Investor Presentations

Step 4 - Data Triangulation
Involves using different sources of information in order to increase the validity of a study
These sources are likely to be stakeholders in a program - participants, other researchers, program staff, other community members, and so on.
Then we put all data in single framework & apply various statistical tools to find out the dynamic on the market.
During the analysis stage, feedback from the stakeholder groups would be compared to determine areas of agreement as well as areas of divergence