

Key Insights
The Nordic bike-sharing market is poised for significant expansion, driven by escalating environmental consciousness, urban congestion mitigation efforts, and government endorsements of sustainable transit. This dynamic sector is projected to grow at a Compound Annual Growth Rate (CAGR) of 7.8%, reaching an estimated market size of 280 million by 2024 (base year). The increasing integration of e-bikes within sharing schemes is a primary catalyst, offering users a convenient and efficient mobility solution, especially across the varied landscapes of Nordic nations. Furthermore, the proliferation of dockless bike-sharing systems enhances user flexibility, accelerating market adoption. Key market segments include traditional bikes and e-bikes, docked and dockless sharing models, and country-specific markets such as Sweden, Norway, Finland, and Denmark. Prominent industry players, including Smoove and Oslo City Bike, are instrumental in shaping the market through innovative services and technological advancements, fostering a competitive and evolving landscape.
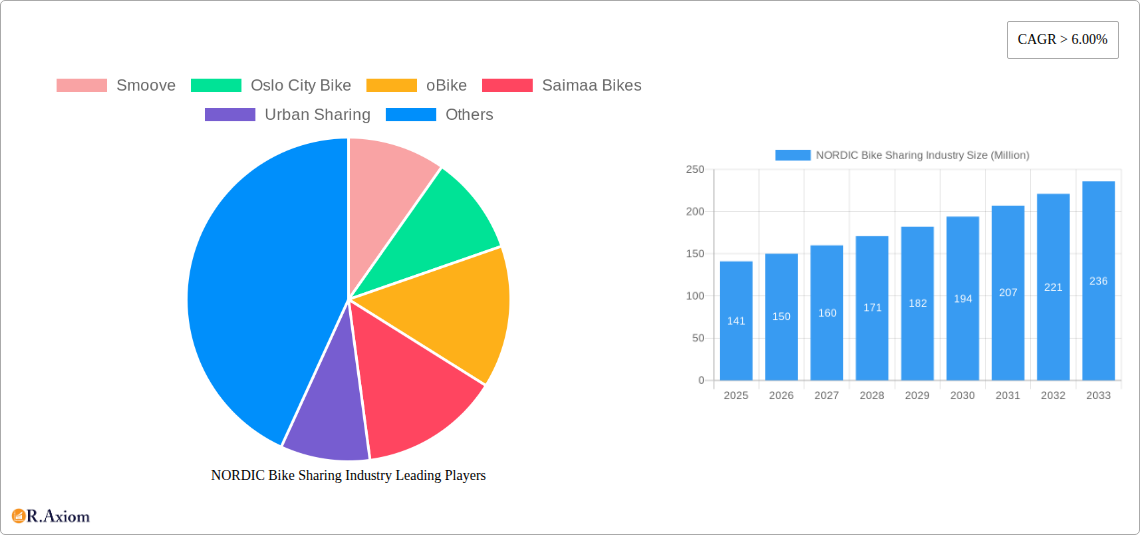
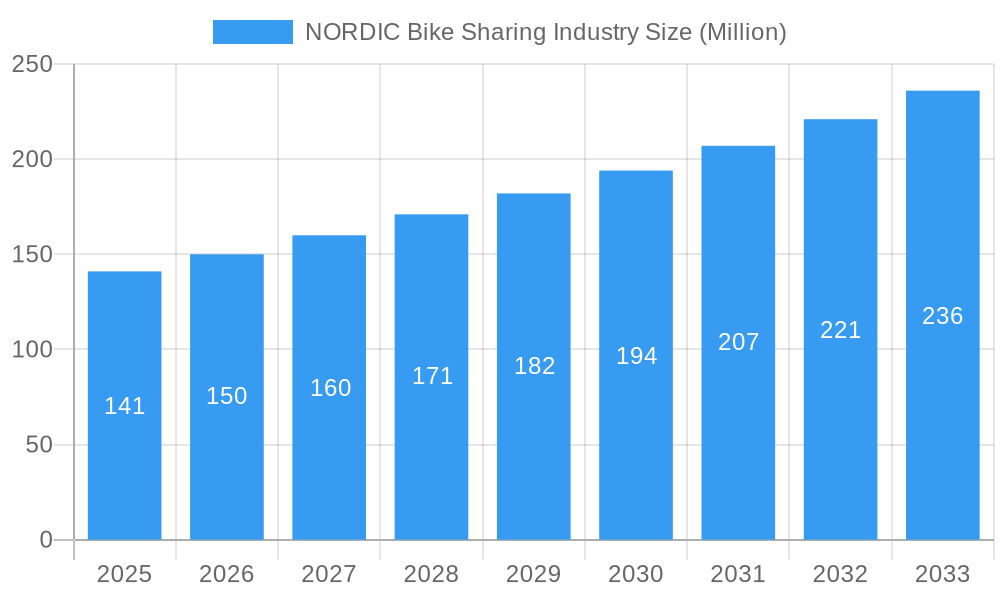
NORDIC Bike Sharing Industry Market Size (In Million)
The Nordic bike-sharing market is projected to reach approximately 280 million by the base year 2024. This growth trajectory is underpinned by strong adoption rates in key markets like Sweden and Norway, attributed to their substantial urban populations and progressive urban planning strategies that prioritize sustainable transportation. Continued advancements in e-bike technology and the development of user-centric digital platforms are crucial for long-term market viability and sustained growth across both major metropolitan areas and smaller towns throughout the Nordic region.
NORDIC Bike Sharing Industry Company Market Share
NORDIC Bike Sharing Industry Market Report: 2019-2033
This comprehensive report provides an in-depth analysis of the Nordic bike-sharing industry, offering crucial insights for stakeholders seeking to navigate this dynamic market. Covering the period from 2019 to 2033, with a base year of 2025 and a forecast period spanning 2025-2033, this report leverages historical data (2019-2024) and advanced forecasting methodologies to deliver actionable intelligence. The report meticulously segments the market by bike type (traditional/regular bikes, e-bikes), sharing system type (docked, dockless), and country (Sweden, Norway, Finland, Denmark, Rest of Nordic Region), providing a granular understanding of market dynamics. Key players like Smoove, Oslo City Bike, oBike, Saimaa Bikes, Urban Sharing, Rekola, Malmo By Bike, Helsinki City bikes, and Bycyklen are analyzed to reveal market concentration and competitive landscapes. The report projects a xx Million market value by 2033, presenting significant growth opportunities for investors and industry participants.
NORDIC Bike Sharing Industry Market Concentration & Innovation
This section analyzes the competitive landscape of the Nordic bike-sharing market, examining market concentration, innovation drivers, regulatory frameworks, and M&A activities. The market is characterized by a mix of large established players and smaller, emerging companies, leading to varying levels of market share concentration across different Nordic countries.
- Market Concentration: The market exhibits moderate concentration, with a few dominant players in major cities and a more fragmented landscape in smaller towns. Smoove and Oslo City Bike hold significant market share in their respective regions, but the overall market is still relatively open to new entrants. We estimate the top 5 players control approximately xx% of the market in 2025.
- Innovation Drivers: Technological advancements, particularly in e-bike technology and smart-locking systems, are significant drivers of innovation. The rise of integrated mobile apps and data-driven operations also contribute. Government incentives for sustainable transportation further accelerate innovation.
- Regulatory Frameworks: Varying regulations across Nordic countries influence market development. Some regions have more stringent regulations regarding permits and operational standards, while others favor a more liberal approach. These differing regulations impact the speed of expansion and the overall market structure.
- Product Substitutes: Competition comes from other forms of micro-mobility such as electric scooters and ride-hailing services, though the unique benefits of bike-sharing, like health and environmental benefits, maintain market demand.
- End-User Trends: Growing environmental awareness and the increasing preference for sustainable transportation fuels demand. Convenience and affordability also make bike-sharing an attractive option for commuters and tourists.
- M&A Activities: While significant M&A activity hasn't been prevalent in recent years, the potential for consolidation exists, particularly as larger players aim to expand their geographic reach and service offerings. The total value of M&A deals in the period 2019-2024 is estimated at xx Million.
NORDIC Bike Sharing Industry Industry Trends & Insights
The Nordic bike-sharing industry is experiencing significant growth, driven by several key factors. The market witnessed a CAGR of xx% from 2019-2024, and this positive trajectory is anticipated to continue with a projected CAGR of xx% between 2025 and 2033. Market penetration is currently at approximately xx% in major urban areas but holds significant potential for expansion in smaller cities and towns.
Technological advancements, such as the integration of GPS tracking and improved battery technology for e-bikes, are playing a crucial role in shaping industry trends. Consumer preferences are shifting towards e-bikes due to their convenience and ability to overcome geographical challenges, influencing the overall market dynamics and prompting companies to adapt and expand their e-bike fleets. Competitive dynamics are characterized by price wars in some areas and strategic partnerships in others, underscoring the dynamism of the market. Government incentives, particularly those supporting the adoption of sustainable transportation options, are boosting growth and fostering industry innovation. The shift towards subscription-based models is also influencing market behaviour, encouraging greater user loyalty. The trend towards integrating bike-sharing with public transit systems is also gaining traction.
Dominant Markets & Segments in NORDIC Bike Sharing Industry
This section identifies the leading regions, countries, and segments within the Nordic bike-sharing market.
By Bike Type:
- E-bikes: E-bikes represent the fastest-growing segment due to their increased convenience and ability to tackle hilly terrain prevalent in some Nordic regions.
- Traditional/Regular Bikes: Traditional bikes retain market share, particularly in flatter urban areas and among price-sensitive users.
By Sharing System Type:
- Dockless systems: Dockless systems are gaining popularity due to their flexibility and convenience, while docked systems maintain relevance due to their established infrastructure and security features.
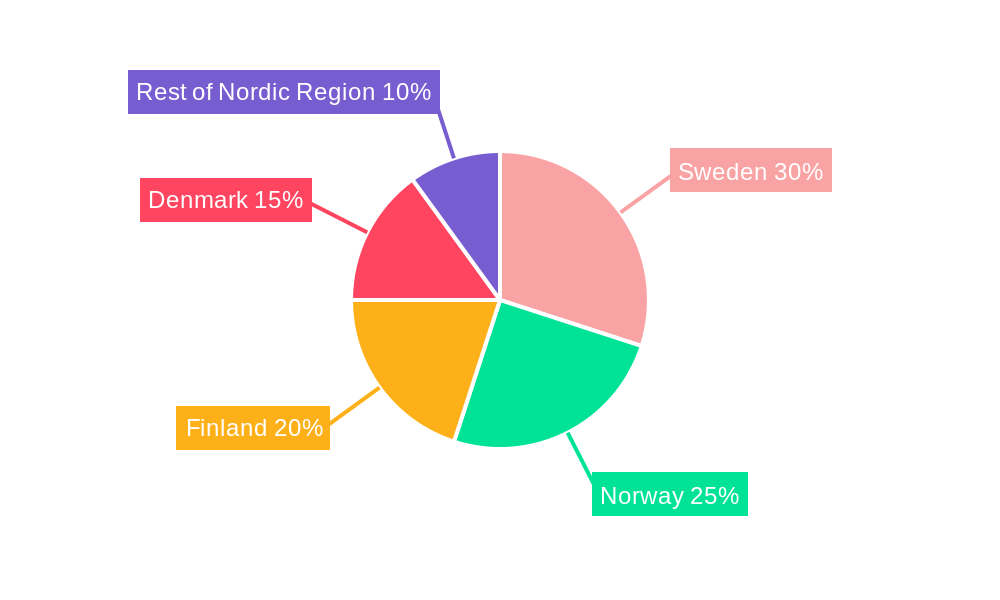
By Country:
- Sweden: Sweden is expected to remain a leading market due to its strong focus on sustainable transportation and robust cycling infrastructure.
- Denmark: Copenhagen's existing cycling infrastructure gives Denmark a strong foothold in this market.
- Norway, Finland: Norway and Finland demonstrate increasing growth in adoption of bike-sharing but lag behind Sweden and Denmark due to factors such as weather conditions and infrastructure limitations.
- Rest of Nordic Region: This segment shows slower but steady growth, reflecting the regional differences in urban planning and technological adoption.
Key Drivers: The dominance of certain segments and countries is attributed to several key factors, including supportive government policies, well-developed cycling infrastructure (particularly in Denmark and Sweden), and the higher acceptance of environmentally friendly transportation modes. Economic conditions also influence adoption rates, with regions experiencing economic growth tending to see faster adoption.
NORDIC Bike Sharing Industry Product Developments
The Nordic bike-sharing industry is witnessing significant product innovation, driven by advancements in e-bike technology, enhanced GPS tracking, improved security features (such as tamper-proof locks and anti-theft measures), and the development of more user-friendly mobile applications. These innovations offer enhanced convenience, safety, and operational efficiency, strengthening the competitiveness of bike-sharing services and attracting a broader user base. The focus on integrating these innovations enhances the overall user experience, attracting new users and increasing customer loyalty.
Report Scope & Segmentation Analysis
This report offers a comprehensive segmentation analysis of the Nordic bike-sharing industry, categorized by bike type (traditional and e-bikes), sharing system type (docked and dockless), and country (Sweden, Norway, Finland, Denmark, and the rest of the Nordic region). Each segment presents unique market size projections, growth rates, and competitive landscapes. Growth projections vary considerably across segments, with e-bikes and dockless systems exhibiting particularly strong potential. Market sizes for each segment are detailed in the full report, providing a detailed snapshot of market opportunity and future market dynamics. Competitive dynamics differ among segments, with some enjoying relatively higher levels of competition than others.
Key Drivers of NORDIC Bike Sharing Industry Growth
Several key factors drive the growth of the Nordic bike-sharing industry. Government initiatives promoting sustainable transportation, coupled with investments in cycling infrastructure (especially in urban areas), are significantly accelerating market expansion. The increasing environmental awareness among consumers is bolstering demand for eco-friendly transportation alternatives. Technological advancements, such as improved battery technology for e-bikes and enhanced mobile app functionalities, are further propelling market growth. Finally, the convenience and affordability of bike-sharing compared to other transportation modes further fuels its increasing popularity.
Challenges in the NORDIC Bike Sharing Industry Sector
Despite the promising growth outlook, the Nordic bike-sharing industry faces several challenges. Regulatory hurdles vary across different Nordic countries, creating complexities for operators seeking to expand across multiple markets. Supply chain disruptions, particularly related to the sourcing of e-bike components, can impact operational efficiency. Intense competition, both from other bike-sharing operators and substitute transportation modes like e-scooters and ride-hailing services, places pressure on pricing and profitability. These factors can combine to reduce overall profit margins and limit the ability of companies to expand operations.
Emerging Opportunities in NORDIC Bike Sharing Industry
The Nordic bike-sharing market presents several promising opportunities. Expansion into smaller cities and towns, currently underserved by existing operators, holds significant potential for growth. Integration with public transport systems and the development of innovative subscription models can improve user experience and enhance market penetration. Further technological advancements, especially in areas such as smart locking systems and battery technology, can lead to enhanced user convenience and efficiency. Finally, focusing on the growing corporate market will create new revenue streams.
Leading Players in the NORDIC Bike Sharing Industry Market
- Smoove
- Oslo City Bike
- oBike
- Saimaa Bikes
- Urban Sharing
- Rekola
- Malmo By Bike
- Helsinki City bikes
- Bycyklen
List Not Exhaustive
Key Developments in NORDIC Bike Sharing Industry Industry
- 2022 Q3: Smoove launched a new e-bike model with enhanced battery technology in Sweden.
- 2023 Q1: Oslo City Bike partnered with a local public transit company to integrate bike-sharing into its network.
- 2024 Q2: The Finnish government announced new incentives for the adoption of e-bikes.
- 2024 Q4: Rekola acquired a smaller competitor in Denmark, expanding its market reach. (Further developments will be detailed in the full report)
Strategic Outlook for NORDIC Bike Sharing Industry Market
The Nordic bike-sharing industry is poised for continued growth, driven by increasing environmental awareness, technological advancements, and supportive government policies. The market's future potential is significant, particularly in the e-bike segment and dockless system adoption. Companies that successfully adapt to evolving consumer preferences, invest in innovative technologies, and navigate regulatory complexities will be well-positioned to capitalize on this promising growth trajectory. Further market consolidation is likely, with larger players potentially acquiring smaller competitors to achieve economies of scale and expand their market reach.
NORDIC Bike Sharing Industry Segmentation
-
1. Bike Type
- 1.1. Traditional/Regular Bike
- 1.2. E-bike
-
2. Sharing System Type
- 2.1. Docked
- 2.2. Dockless
NORDIC Bike Sharing Industry Segmentation By Geography
-
1. North America
- 1.1. United States
- 1.2. Canada
- 1.3. Mexico
-
2. South America
- 2.1. Brazil
- 2.2. Argentina
- 2.3. Rest of South America
-
3. Europe
- 3.1. United Kingdom
- 3.2. Germany
- 3.3. France
- 3.4. Italy
- 3.5. Spain
- 3.6. Russia
- 3.7. Benelux
- 3.8. Nordics
- 3.9. Rest of Europe
-
4. Middle East & Africa
- 4.1. Turkey
- 4.2. Israel
- 4.3. GCC
- 4.4. North Africa
- 4.5. South Africa
- 4.6. Rest of Middle East & Africa
-
5. Asia Pacific
- 5.1. China
- 5.2. India
- 5.3. Japan
- 5.4. South Korea
- 5.5. ASEAN
- 5.6. Oceania
- 5.7. Rest of Asia Pacific
NORDIC Bike Sharing Industry Regional Market Share
Geographic Coverage of NORDIC Bike Sharing Industry
NORDIC Bike Sharing Industry REPORT HIGHLIGHTS
| Aspects | Details |
|---|---|
| Study Period | 2020-2034 |
| Base Year | 2025 |
| Estimated Year | 2026 |
| Forecast Period | 2026-2034 |
| Historical Period | 2020-2025 |
| Growth Rate | CAGR of 7.8% from 2020-2034 |
| Segmentation |
|
Table of Contents
- 1. Introduction
- 1.1. Research Scope
- 1.2. Market Segmentation
- 1.3. Research Objective
- 1.4. Definitions and Assumptions
- 2. Executive Summary
- 2.1. Market Snapshot
- 3. Market Dynamics
- 3.1. Market Drivers
- 3.2. Market Restrains
- 3.3. Market Trends
- 3.4. Market Opportunities
- 4. Market Factor Analysis
- 4.1. Porters Five Forces
- 4.1.1. Bargaining Power of Suppliers
- 4.1.2. Bargaining Power of Buyers
- 4.1.3. Threat of New Entrants
- 4.1.4. Threat of Substitutes
- 4.1.5. Competitive Rivalry
- 4.2. PESTEL analysis
- 4.3. BCG Analysis
- 4.3.1. Stars (High Growth, High Market Share)
- 4.3.2. Cash Cows (Low Growth, High Market Share)
- 4.3.3. Question Mark (High Growth, Low Market Share)
- 4.3.4. Dogs (Low Growth, Low Market Share)
- 4.4. Ansoff Matrix Analysis
- 4.5. Supply Chain Analysis
- 4.6. Regulatory Landscape
- 4.7. Current Market Potential and Opportunity Assessment (TAM–SAM–SOM Framework)
- 4.8. RAX Analyst Note
- 4.1. Porters Five Forces
- 5. Market Analysis, Insights and Forecast 2021-2033
- 5.1. Market Analysis, Insights and Forecast - by Bike Type
- 5.1.1. Traditional/Regular Bike
- 5.1.2. E-bike
- 5.2. Market Analysis, Insights and Forecast - by Sharing System Type
- 5.2.1. Docked
- 5.2.2. Dockless
- 5.3. Market Analysis, Insights and Forecast - by Region
- 5.3.1. North America
- 5.3.2. South America
- 5.3.3. Europe
- 5.3.4. Middle East & Africa
- 5.3.5. Asia Pacific
- 5.1. Market Analysis, Insights and Forecast - by Bike Type
- 6. Global NORDIC Bike Sharing Industry Analysis, Insights and Forecast, 2021-2033
- 6.1. Market Analysis, Insights and Forecast - by Bike Type
- 6.1.1. Traditional/Regular Bike
- 6.1.2. E-bike
- 6.2. Market Analysis, Insights and Forecast - by Sharing System Type
- 6.2.1. Docked
- 6.2.2. Dockless
- 6.1. Market Analysis, Insights and Forecast - by Bike Type
- 7. North America NORDIC Bike Sharing Industry Analysis, Insights and Forecast, 2020-2032
- 7.1. Market Analysis, Insights and Forecast - by Bike Type
- 7.1.1. Traditional/Regular Bike
- 7.1.2. E-bike
- 7.2. Market Analysis, Insights and Forecast - by Sharing System Type
- 7.2.1. Docked
- 7.2.2. Dockless
- 7.1. Market Analysis, Insights and Forecast - by Bike Type
- 8. South America NORDIC Bike Sharing Industry Analysis, Insights and Forecast, 2020-2032
- 8.1. Market Analysis, Insights and Forecast - by Bike Type
- 8.1.1. Traditional/Regular Bike
- 8.1.2. E-bike
- 8.2. Market Analysis, Insights and Forecast - by Sharing System Type
- 8.2.1. Docked
- 8.2.2. Dockless
- 8.1. Market Analysis, Insights and Forecast - by Bike Type
- 9. Europe NORDIC Bike Sharing Industry Analysis, Insights and Forecast, 2020-2032
- 9.1. Market Analysis, Insights and Forecast - by Bike Type
- 9.1.1. Traditional/Regular Bike
- 9.1.2. E-bike
- 9.2. Market Analysis, Insights and Forecast - by Sharing System Type
- 9.2.1. Docked
- 9.2.2. Dockless
- 9.1. Market Analysis, Insights and Forecast - by Bike Type
- 10. Middle East & Africa NORDIC Bike Sharing Industry Analysis, Insights and Forecast, 2020-2032
- 10.1. Market Analysis, Insights and Forecast - by Bike Type
- 10.1.1. Traditional/Regular Bike
- 10.1.2. E-bike
- 10.2. Market Analysis, Insights and Forecast - by Sharing System Type
- 10.2.1. Docked
- 10.2.2. Dockless
- 10.1. Market Analysis, Insights and Forecast - by Bike Type
- 11. Asia Pacific NORDIC Bike Sharing Industry Analysis, Insights and Forecast, 2020-2032
- 11.1. Market Analysis, Insights and Forecast - by Bike Type
- 11.1.1. Traditional/Regular Bike
- 11.1.2. E-bike
- 11.2. Market Analysis, Insights and Forecast - by Sharing System Type
- 11.2.1. Docked
- 11.2.2. Dockless
- 11.1. Market Analysis, Insights and Forecast - by Bike Type
- 12. Competitive Analysis
- 12.1. Company Profiles
- 12.1.1 Smoove
- 12.1.1.1. Company Overview
- 12.1.1.2. Products
- 12.1.1.3. Company Financials
- 12.1.1.4. SWOT Analysis
- 12.1.2 Oslo City Bike
- 12.1.2.1. Company Overview
- 12.1.2.2. Products
- 12.1.2.3. Company Financials
- 12.1.2.4. SWOT Analysis
- 12.1.3 oBike
- 12.1.3.1. Company Overview
- 12.1.3.2. Products
- 12.1.3.3. Company Financials
- 12.1.3.4. SWOT Analysis
- 12.1.4 Saimaa Bikes
- 12.1.4.1. Company Overview
- 12.1.4.2. Products
- 12.1.4.3. Company Financials
- 12.1.4.4. SWOT Analysis
- 12.1.5 Urban Sharing
- 12.1.5.1. Company Overview
- 12.1.5.2. Products
- 12.1.5.3. Company Financials
- 12.1.5.4. SWOT Analysis
- 12.1.6 Rekola
- 12.1.6.1. Company Overview
- 12.1.6.2. Products
- 12.1.6.3. Company Financials
- 12.1.6.4. SWOT Analysis
- 12.1.7 Malmo By Bike
- 12.1.7.1. Company Overview
- 12.1.7.2. Products
- 12.1.7.3. Company Financials
- 12.1.7.4. SWOT Analysis
- 12.1.8 Helsinki City bikes
- 12.1.8.1. Company Overview
- 12.1.8.2. Products
- 12.1.8.3. Company Financials
- 12.1.8.4. SWOT Analysis
- 12.1.9 Bycyklen*List Not Exhaustive
- 12.1.9.1. Company Overview
- 12.1.9.2. Products
- 12.1.9.3. Company Financials
- 12.1.9.4. SWOT Analysis
- 12.1.1 Smoove
- 12.2. Market Entropy
- 12.2.1 Company's Key Areas Served
- 12.2.2 Recent Developments
- 12.3. Company Market Share Analysis 2025
- 12.3.1 Top 5 Companies Market Share Analysis
- 12.3.2 Top 3 Companies Market Share Analysis
- 12.4. List of Potential Customers
- 13. Research Methodology
List of Figures
- Figure 1: Global NORDIC Bike Sharing Industry Revenue Breakdown (million, %) by Region 2025 & 2033
- Figure 2: North America NORDIC Bike Sharing Industry Revenue (million), by Bike Type 2025 & 2033
- Figure 3: North America NORDIC Bike Sharing Industry Revenue Share (%), by Bike Type 2025 & 2033
- Figure 4: North America NORDIC Bike Sharing Industry Revenue (million), by Sharing System Type 2025 & 2033
- Figure 5: North America NORDIC Bike Sharing Industry Revenue Share (%), by Sharing System Type 2025 & 2033
- Figure 6: North America NORDIC Bike Sharing Industry Revenue (million), by Country 2025 & 2033
- Figure 7: North America NORDIC Bike Sharing Industry Revenue Share (%), by Country 2025 & 2033
- Figure 8: South America NORDIC Bike Sharing Industry Revenue (million), by Bike Type 2025 & 2033
- Figure 9: South America NORDIC Bike Sharing Industry Revenue Share (%), by Bike Type 2025 & 2033
- Figure 10: South America NORDIC Bike Sharing Industry Revenue (million), by Sharing System Type 2025 & 2033
- Figure 11: South America NORDIC Bike Sharing Industry Revenue Share (%), by Sharing System Type 2025 & 2033
- Figure 12: South America NORDIC Bike Sharing Industry Revenue (million), by Country 2025 & 2033
- Figure 13: South America NORDIC Bike Sharing Industry Revenue Share (%), by Country 2025 & 2033
- Figure 14: Europe NORDIC Bike Sharing Industry Revenue (million), by Bike Type 2025 & 2033
- Figure 15: Europe NORDIC Bike Sharing Industry Revenue Share (%), by Bike Type 2025 & 2033
- Figure 16: Europe NORDIC Bike Sharing Industry Revenue (million), by Sharing System Type 2025 & 2033
- Figure 17: Europe NORDIC Bike Sharing Industry Revenue Share (%), by Sharing System Type 2025 & 2033
- Figure 18: Europe NORDIC Bike Sharing Industry Revenue (million), by Country 2025 & 2033
- Figure 19: Europe NORDIC Bike Sharing Industry Revenue Share (%), by Country 2025 & 2033
- Figure 20: Middle East & Africa NORDIC Bike Sharing Industry Revenue (million), by Bike Type 2025 & 2033
- Figure 21: Middle East & Africa NORDIC Bike Sharing Industry Revenue Share (%), by Bike Type 2025 & 2033
- Figure 22: Middle East & Africa NORDIC Bike Sharing Industry Revenue (million), by Sharing System Type 2025 & 2033
- Figure 23: Middle East & Africa NORDIC Bike Sharing Industry Revenue Share (%), by Sharing System Type 2025 & 2033
- Figure 24: Middle East & Africa NORDIC Bike Sharing Industry Revenue (million), by Country 2025 & 2033
- Figure 25: Middle East & Africa NORDIC Bike Sharing Industry Revenue Share (%), by Country 2025 & 2033
- Figure 26: Asia Pacific NORDIC Bike Sharing Industry Revenue (million), by Bike Type 2025 & 2033
- Figure 27: Asia Pacific NORDIC Bike Sharing Industry Revenue Share (%), by Bike Type 2025 & 2033
- Figure 28: Asia Pacific NORDIC Bike Sharing Industry Revenue (million), by Sharing System Type 2025 & 2033
- Figure 29: Asia Pacific NORDIC Bike Sharing Industry Revenue Share (%), by Sharing System Type 2025 & 2033
- Figure 30: Asia Pacific NORDIC Bike Sharing Industry Revenue (million), by Country 2025 & 2033
- Figure 31: Asia Pacific NORDIC Bike Sharing Industry Revenue Share (%), by Country 2025 & 2033
List of Tables
- Table 1: Global NORDIC Bike Sharing Industry Revenue million Forecast, by Bike Type 2020 & 2033
- Table 2: Global NORDIC Bike Sharing Industry Revenue million Forecast, by Sharing System Type 2020 & 2033
- Table 3: Global NORDIC Bike Sharing Industry Revenue million Forecast, by Region 2020 & 2033
- Table 4: Global NORDIC Bike Sharing Industry Revenue million Forecast, by Bike Type 2020 & 2033
- Table 5: Global NORDIC Bike Sharing Industry Revenue million Forecast, by Sharing System Type 2020 & 2033
- Table 6: Global NORDIC Bike Sharing Industry Revenue million Forecast, by Country 2020 & 2033
- Table 7: United States NORDIC Bike Sharing Industry Revenue (million) Forecast, by Application 2020 & 2033
- Table 8: Canada NORDIC Bike Sharing Industry Revenue (million) Forecast, by Application 2020 & 2033
- Table 9: Mexico NORDIC Bike Sharing Industry Revenue (million) Forecast, by Application 2020 & 2033
- Table 10: Global NORDIC Bike Sharing Industry Revenue million Forecast, by Bike Type 2020 & 2033
- Table 11: Global NORDIC Bike Sharing Industry Revenue million Forecast, by Sharing System Type 2020 & 2033
- Table 12: Global NORDIC Bike Sharing Industry Revenue million Forecast, by Country 2020 & 2033
- Table 13: Brazil NORDIC Bike Sharing Industry Revenue (million) Forecast, by Application 2020 & 2033
- Table 14: Argentina NORDIC Bike Sharing Industry Revenue (million) Forecast, by Application 2020 & 2033
- Table 15: Rest of South America NORDIC Bike Sharing Industry Revenue (million) Forecast, by Application 2020 & 2033
- Table 16: Global NORDIC Bike Sharing Industry Revenue million Forecast, by Bike Type 2020 & 2033
- Table 17: Global NORDIC Bike Sharing Industry Revenue million Forecast, by Sharing System Type 2020 & 2033
- Table 18: Global NORDIC Bike Sharing Industry Revenue million Forecast, by Country 2020 & 2033
- Table 19: United Kingdom NORDIC Bike Sharing Industry Revenue (million) Forecast, by Application 2020 & 2033
- Table 20: Germany NORDIC Bike Sharing Industry Revenue (million) Forecast, by Application 2020 & 2033
- Table 21: France NORDIC Bike Sharing Industry Revenue (million) Forecast, by Application 2020 & 2033
- Table 22: Italy NORDIC Bike Sharing Industry Revenue (million) Forecast, by Application 2020 & 2033
- Table 23: Spain NORDIC Bike Sharing Industry Revenue (million) Forecast, by Application 2020 & 2033
- Table 24: Russia NORDIC Bike Sharing Industry Revenue (million) Forecast, by Application 2020 & 2033
- Table 25: Benelux NORDIC Bike Sharing Industry Revenue (million) Forecast, by Application 2020 & 2033
- Table 26: Nordics NORDIC Bike Sharing Industry Revenue (million) Forecast, by Application 2020 & 2033
- Table 27: Rest of Europe NORDIC Bike Sharing Industry Revenue (million) Forecast, by Application 2020 & 2033
- Table 28: Global NORDIC Bike Sharing Industry Revenue million Forecast, by Bike Type 2020 & 2033
- Table 29: Global NORDIC Bike Sharing Industry Revenue million Forecast, by Sharing System Type 2020 & 2033
- Table 30: Global NORDIC Bike Sharing Industry Revenue million Forecast, by Country 2020 & 2033
- Table 31: Turkey NORDIC Bike Sharing Industry Revenue (million) Forecast, by Application 2020 & 2033
- Table 32: Israel NORDIC Bike Sharing Industry Revenue (million) Forecast, by Application 2020 & 2033
- Table 33: GCC NORDIC Bike Sharing Industry Revenue (million) Forecast, by Application 2020 & 2033
- Table 34: North Africa NORDIC Bike Sharing Industry Revenue (million) Forecast, by Application 2020 & 2033
- Table 35: South Africa NORDIC Bike Sharing Industry Revenue (million) Forecast, by Application 2020 & 2033
- Table 36: Rest of Middle East & Africa NORDIC Bike Sharing Industry Revenue (million) Forecast, by Application 2020 & 2033
- Table 37: Global NORDIC Bike Sharing Industry Revenue million Forecast, by Bike Type 2020 & 2033
- Table 38: Global NORDIC Bike Sharing Industry Revenue million Forecast, by Sharing System Type 2020 & 2033
- Table 39: Global NORDIC Bike Sharing Industry Revenue million Forecast, by Country 2020 & 2033
- Table 40: China NORDIC Bike Sharing Industry Revenue (million) Forecast, by Application 2020 & 2033
- Table 41: India NORDIC Bike Sharing Industry Revenue (million) Forecast, by Application 2020 & 2033
- Table 42: Japan NORDIC Bike Sharing Industry Revenue (million) Forecast, by Application 2020 & 2033
- Table 43: South Korea NORDIC Bike Sharing Industry Revenue (million) Forecast, by Application 2020 & 2033
- Table 44: ASEAN NORDIC Bike Sharing Industry Revenue (million) Forecast, by Application 2020 & 2033
- Table 45: Oceania NORDIC Bike Sharing Industry Revenue (million) Forecast, by Application 2020 & 2033
- Table 46: Rest of Asia Pacific NORDIC Bike Sharing Industry Revenue (million) Forecast, by Application 2020 & 2033
Frequently Asked Questions
1. What is the projected Compound Annual Growth Rate (CAGR) of the NORDIC Bike Sharing Industry?
The projected CAGR is approximately 7.8%.
2. Which companies are prominent players in the NORDIC Bike Sharing Industry?
Key companies in the market include Smoove, Oslo City Bike, oBike, Saimaa Bikes, Urban Sharing, Rekola, Malmo By Bike, Helsinki City bikes, Bycyklen*List Not Exhaustive.
3. What are the main segments of the NORDIC Bike Sharing Industry?
The market segments include Bike Type, Sharing System Type.
4. Can you provide details about the market size?
The market size is estimated to be USD 280 million as of 2022.
5. What are some drivers contributing to market growth?
Government Policies to promote electric Vehicles Sales.
6. What are the notable trends driving market growth?
E-Bike Rentalis Providing the Growth in Market.
7. Are there any restraints impacting market growth?
High Cost of Capital Expenditure for Electric Vehicle Infrastructure.
8. Can you provide examples of recent developments in the market?
N/A
9. What pricing options are available for accessing the report?
Pricing options include single-user, multi-user, and enterprise licenses priced at USD 3800, USD 4500, and USD 5800 respectively.
10. Is the market size provided in terms of value or volume?
The market size is provided in terms of value, measured in million.
11. Are there any specific market keywords associated with the report?
Yes, the market keyword associated with the report is "NORDIC Bike Sharing Industry," which aids in identifying and referencing the specific market segment covered.
12. How do I determine which pricing option suits my needs best?
The pricing options vary based on user requirements and access needs. Individual users may opt for single-user licenses, while businesses requiring broader access may choose multi-user or enterprise licenses for cost-effective access to the report.
13. Are there any additional resources or data provided in the NORDIC Bike Sharing Industry report?
While the report offers comprehensive insights, it's advisable to review the specific contents or supplementary materials provided to ascertain if additional resources or data are available.
14. How can I stay updated on further developments or reports in the NORDIC Bike Sharing Industry?
To stay informed about further developments, trends, and reports in the NORDIC Bike Sharing Industry, consider subscribing to industry newsletters, following relevant companies and organizations, or regularly checking reputable industry news sources and publications.
Methodology
Step 1 - Identification of Relevant Samples Size from Population Database


Step 2 - Approaches for Defining Global Market Size (Value, Volume* & Price*)

Note*: In applicable scenarios
Step 3 - Data Sources
Primary Research
- Web Analytics
- Survey Reports
- Research Institute
- Latest Research Reports
- Opinion Leaders
Secondary Research
- Annual Reports
- White Paper
- Latest Press Release
- Industry Association
- Paid Database
- Investor Presentations

Step 4 - Data Triangulation
Involves using different sources of information in order to increase the validity of a study
These sources are likely to be stakeholders in a program - participants, other researchers, program staff, other community members, and so on.
Then we put all data in single framework & apply various statistical tools to find out the dynamic on the market.
During the analysis stage, feedback from the stakeholder groups would be compared to determine areas of agreement as well as areas of divergence