

Key Insights
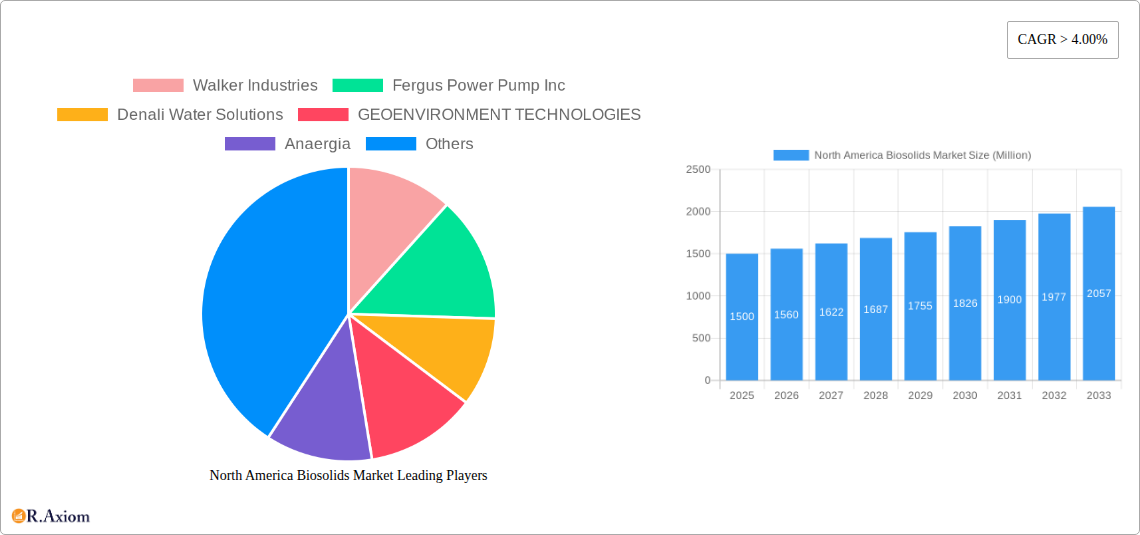
The North American biosolids market, valued at approximately $3.84 billion in 2024, is experiencing robust growth. Projections indicate an expansion at a Compound Annual Growth Rate (CAGR) exceeding 4.5% from 2024 to 2033. This growth is primarily driven by increasingly stringent environmental regulations focused on waste reduction and sustainable resource management. The rising demand for nutrient-rich soil amendments in agriculture, particularly Class A and Class A EQ biosolids, is a significant catalyst. Enhanced awareness of the economic and environmental advantages of biosolids utilization over conventional disposal methods further strengthens market prospects. Diverse application segments, including agriculture, land reclamation, landscaping, and energy production, contribute to the market's resilience. Specific product forms such as cakes, liquids, and pellets cater to varied end-user requirements across these segments. Leading industry participants, including Walker Industries and Fergus Power Pump Inc., are actively shaping market dynamics through production, processing, and distribution.
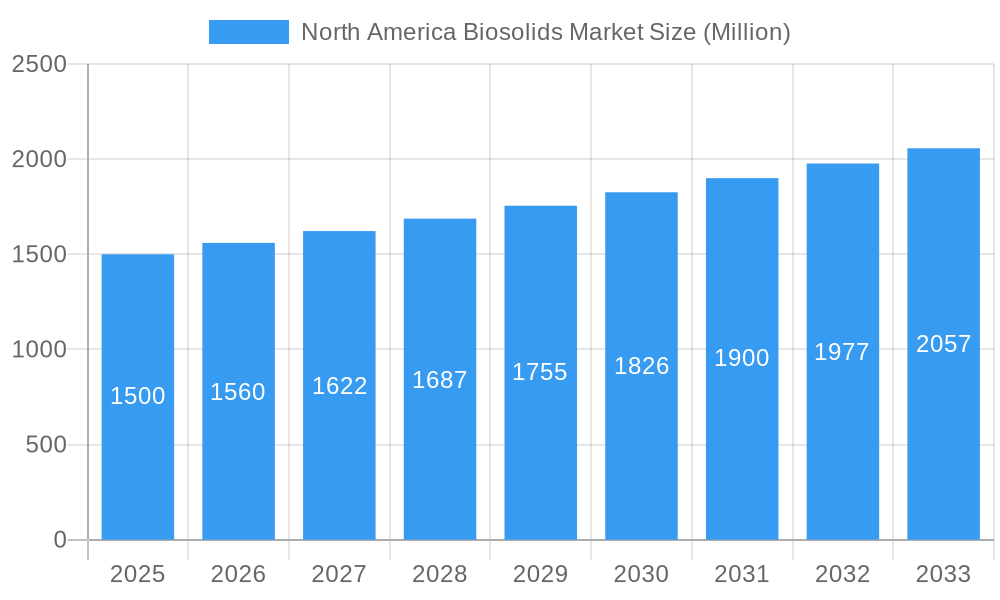
North America Biosolids Market Market Size (In Billion)
Market expansion faces challenges, including rigorous handling and application regulations and potential public perception hurdles. Addressing these through transparent communication and stringent quality control is vital for sustained growth. Market segmentation presents opportunities for specialized enterprises. Companies investing in innovative biosolids processing technologies, especially those enhancing Class A and Class A EQ biosolids' quality and safety, are positioned for a competitive advantage. Regional regulatory landscapes and the adoption of sustainable practices will influence future trajectory, with the United States anticipated to remain the dominant market within North America. Future growth hinges on continuous innovation, effective regulatory adherence, and improved public understanding of biosolids reuse benefits.
North America Biosolids Market Company Market Share
North America Biosolids Market: Strategic Analysis and Forecast (2024-2033)
This comprehensive report delivers an in-depth analysis of the North America biosolids market, offering actionable insights for stakeholders. Covering the period from 2024 to 2033, with 2024 as the base year, this report provides critical intelligence on market dynamics, growth drivers, challenges, and opportunities. The market is segmented by type (Class A, Class A EQ, Class B), form (Cakes, Liquid, Pellet), and application (Agriculture, Reclamation Sites, Lawns and Home Gardens, Energy Production). Key industry players, such as Walker Industries, Fergus Power Pump Inc., and Synagro Technologies, are analyzed, offering a holistic market overview. The total market size in 2024 is estimated at $3.84 billion.
North America Biosolids Market Market Concentration & Innovation
The North America biosolids market exhibits a moderately concentrated landscape, with a few major players holding significant market share. Synagro Technologies and Walker Industries are among the leading players, commanding approximately xx% and xx% of the market, respectively, in 2025. Smaller players, however, are actively innovating to gain market share. Innovation drivers include stricter environmental regulations pushing for sustainable waste management solutions, increasing demand for cost-effective fertilizers from the agricultural sector, and the exploration of biosolids for energy production.
The regulatory framework is constantly evolving, with varying regulations across different states and provinces. This presents both challenges and opportunities for market players. While Class A and Class A EQ biosolids enjoy higher market penetration, Class B biosolids face limitations due to stringent regulations. Product substitutes like chemical fertilizers face growing scrutiny due to their environmental impact, creating a favorable climate for biosolids. Mergers and acquisitions (M&A) are common, with deal values ranging from xx Million to xx Million in recent years, reflecting the market's consolidation and expansion strategies. For example, the acquisition of X company by Y company in 2022 resulted in a xx% increase in market share for Y. End-user trends reveal a growing preference for sustainable and environmentally friendly solutions, especially in the agricultural and reclamation sectors.
North America Biosolids Market Industry Trends & Insights
The North America biosolids market is experiencing robust growth, driven by increasing urbanization leading to higher wastewater generation, stringent environmental regulations promoting sustainable waste management, and the growing adoption of biosolids as a cost-effective fertilizer and soil amendment. The market witnessed a CAGR of xx% during the historical period (2019-2024) and is projected to register a CAGR of xx% during the forecast period (2025-2033). Market penetration for biosolids in agriculture is currently at approximately xx%, while the potential for expansion in energy production remains largely untapped.
Technological advancements in biosolids processing, including anaerobic digestion and advanced treatment technologies, are enhancing the quality and efficiency of biosolids production, making them suitable for a wider range of applications. Consumer preferences are shifting towards environmentally friendly alternatives, creating strong demand for biosolids in agriculture and land reclamation. However, the market faces challenges stemming from fluctuating commodity prices of traditional fertilizers, which affects the cost-competitiveness of biosolids. Competitive dynamics are marked by innovation in processing technologies, strategic partnerships, and expansion into new geographic markets.
Dominant Markets & Segments in North America Biosolids Market
The agricultural application segment is the dominant market segment, driven by the increasing demand for cost-effective and sustainable fertilizers. The Class A and Class A EQ segments hold a significant market share due to their superior quality and wider range of applications.
- Key Drivers for Agricultural Application: Government subsidies for sustainable agriculture, growing awareness of environmental impacts of chemical fertilizers, and increasing demand for food production.
- Key Drivers for Reclamation Sites: Need for cost-effective land rehabilitation, growing environmental concerns, and stringent regulations concerning waste disposal.
The United States is the leading market for biosolids in North America, driven by a larger population base, higher wastewater generation, and established regulatory frameworks for biosolids management. Within the US, the Midwest and Northeast regions are leading due to high agricultural activity and robust environmental regulations. The cake form dominates the market due to ease of transportation and storage. However, the pellet form is gaining traction due to its improved handling and application.
North America Biosolids Market Product Developments
Recent product innovations focus on improving biosolids quality through advanced treatment technologies such as anaerobic digestion and thermal drying. This enhances their usability in agriculture, leading to enhanced crop yields and reduced reliance on chemical fertilizers. New applications of biosolids, including use in energy production (biogas) and construction materials, are being explored. These developments create competitive advantages by offering superior product quality, versatility, and sustainability, meeting growing market demand for environmentally friendly solutions.
Report Scope & Segmentation Analysis
By Type: Class A, Class A EQ (Exceptional Quality), and Class B biosolids exhibit varying market sizes and growth projections, depending on their quality and regulatory compliance requirements. Class A biosolids command a higher price point.
By Form: Cakes, liquid, and pellet forms each present distinct market dynamics, influenced by transportation costs, ease of handling, and application methods. The market size for each form varies significantly.
By Application: Agriculture, reclamation sites, lawns and home gardens, and energy production showcase diverse growth potentials, driven by factors such as government regulations, technological advancements, and consumer preferences. Each application segment presents unique market opportunities.
Key Drivers of North America Biosolids Market Growth
Stringent environmental regulations promoting sustainable waste management practices are a major driver. The increasing demand for cost-effective and environmentally friendly fertilizers in the agricultural sector is another key factor. Technological advancements in biosolids processing are improving the quality and efficiency of production. Government initiatives and subsidies supporting sustainable agriculture are further stimulating market growth.
Challenges in the North America Biosolids Market Sector
Regulatory hurdles and varying regulations across different jurisdictions pose significant challenges. Fluctuations in commodity prices of traditional fertilizers impact the price competitiveness of biosolids. Public perception and concerns regarding the use of biosolids require continuous public education and awareness campaigns. Supply chain limitations, particularly transportation and storage infrastructure, can restrict efficient biosolids distribution.
Emerging Opportunities in North America Biosolids Market
The exploration of biosolids for energy production (biogas) presents a significant opportunity. Technological advancements in biosolids processing and treatment are paving the way for new applications. Growing awareness of the environmental benefits of biosolids is creating increased market acceptance and demand. Expansion into new geographic markets and strategic partnerships with agricultural and industrial players can unlock substantial growth potential.
Leading Players in the North America Biosolids Market Market
- Walker Industries
- Fergus Power Pump Inc
- Denali Water Solutions
- GEOENVIRONMENT TECHNOLOGIES
- Anaergia
- New England Fertilizer Co (NEFCO)
- DC Water
- Recyc Systems Inc
- BCR Environmental
- Burch Hydro
- SYLVIS
- Casella Waste Systems Inc
- Englobe
- Lystek International
- Synagro Technologies
- Merrell Bros Inc
Key Developments in North America Biosolids Market Industry
- Jan 2023: Synagro Technologies announced a new partnership to expand its biosolids processing facilities in California.
- Oct 2022: Lystek International launched a new line of biosolids-based fertilizers.
- Further developments will be included in the full report.
Strategic Outlook for North America Biosolids Market Market
The North America biosolids market is poised for significant growth, driven by stringent environmental regulations, technological advancements, and the increasing adoption of biosolids as a sustainable resource. Expanding applications in energy production and construction, along with strategic partnerships and investments in processing technologies, present substantial growth catalysts. The focus on sustainable waste management and circular economy practices creates a favorable environment for market expansion, leading to a positive outlook for the years to come.
North America Biosolids Market Segmentation
-
1. Type
- 1.1. Class A
- 1.2. Class A EQ (Exceptional Quality)
- 1.3. Class B
-
2. Form
- 2.1. Cakes
- 2.2. Liquid
- 2.3. Pellet
-
3. Application
-
3.1. Agriculture Land Application
- 3.1.1. Fertiliz
- 3.1.2. Fertilizer for Animal Crop Production - Pastures
-
3.2. Non-agricultural Land Application
- 3.2.1. Forest Crops (Land Restoration and Forestry)
- 3.2.2. Land Reclamation (Roads and Urban Wetlands)
- 3.2.3. Reclaiming Mining Sites
- 3.2.4. Landscaping, Recreational Fields, and Domestic Use
-
3.3. Energy Recovery - Energy Production
- 3.3.1. Heat Generation, Incineration, and Gasification
- 3.3.2. Oil and Cement Production
- 3.3.3. Commercial Uses
-
3.1. Agriculture Land Application
-
4. Geography
- 4.1. United States
- 4.2. Canada
- 4.3. Mexico
- 4.4. Rest of North America
North America Biosolids Market Segmentation By Geography
- 1. United States
- 2. Canada
- 3. Mexico
- 4. Rest of North America
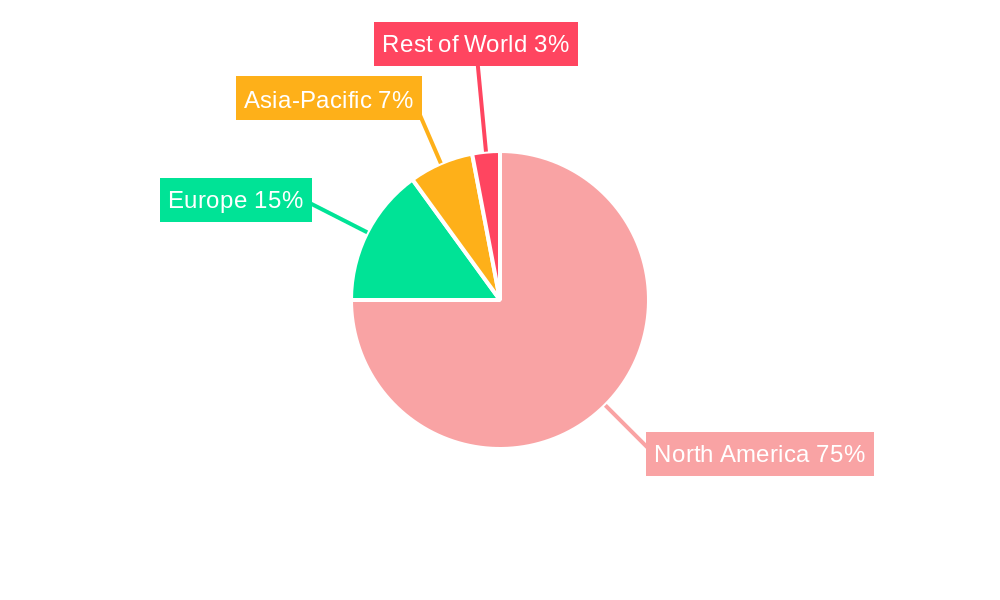
North America Biosolids Market Regional Market Share
Geographic Coverage of North America Biosolids Market
North America Biosolids Market REPORT HIGHLIGHTS
| Aspects | Details |
|---|---|
| Study Period | 2020-2034 |
| Base Year | 2025 |
| Estimated Year | 2026 |
| Forecast Period | 2026-2034 |
| Historical Period | 2020-2025 |
| Growth Rate | CAGR of 4.5% from 2020-2034 |
| Segmentation |
|
Table of Contents
- 1. Introduction
- 1.1. Research Scope
- 1.2. Market Segmentation
- 1.3. Research Objective
- 1.4. Definitions and Assumptions
- 2. Executive Summary
- 2.1. Market Snapshot
- 3. Market Dynamics
- 3.1. Market Drivers
- 3.2. Market Restrains
- 3.3. Market Trends
- 3.4. Market Opportunities
- 4. Market Factor Analysis
- 4.1. Porters Five Forces
- 4.1.1. Bargaining Power of Suppliers
- 4.1.2. Bargaining Power of Buyers
- 4.1.3. Threat of New Entrants
- 4.1.4. Threat of Substitutes
- 4.1.5. Competitive Rivalry
- 4.2. PESTEL analysis
- 4.3. BCG Analysis
- 4.3.1. Stars (High Growth, High Market Share)
- 4.3.2. Cash Cows (Low Growth, High Market Share)
- 4.3.3. Question Mark (High Growth, Low Market Share)
- 4.3.4. Dogs (Low Growth, Low Market Share)
- 4.4. Ansoff Matrix Analysis
- 4.5. Supply Chain Analysis
- 4.6. Regulatory Landscape
- 4.7. Current Market Potential and Opportunity Assessment (TAM–SAM–SOM Framework)
- 4.8. RAX Analyst Note
- 4.1. Porters Five Forces
- 5. Market Analysis, Insights and Forecast 2021-2033
- 5.1. Market Analysis, Insights and Forecast - by Type
- 5.1.1. Class A
- 5.1.2. Class A EQ (Exceptional Quality)
- 5.1.3. Class B
- 5.2. Market Analysis, Insights and Forecast - by Form
- 5.2.1. Cakes
- 5.2.2. Liquid
- 5.2.3. Pellet
- 5.3. Market Analysis, Insights and Forecast - by Application
- 5.3.1. Agriculture Land Application
- 5.3.1.1. Fertiliz
- 5.3.1.2. Fertilizer for Animal Crop Production - Pastures
- 5.3.2. Non-agricultural Land Application
- 5.3.2.1. Forest Crops (Land Restoration and Forestry)
- 5.3.2.2. Land Reclamation (Roads and Urban Wetlands)
- 5.3.2.3. Reclaiming Mining Sites
- 5.3.2.4. Landscaping, Recreational Fields, and Domestic Use
- 5.3.3. Energy Recovery - Energy Production
- 5.3.3.1. Heat Generation, Incineration, and Gasification
- 5.3.3.2. Oil and Cement Production
- 5.3.3.3. Commercial Uses
- 5.3.1. Agriculture Land Application
- 5.4. Market Analysis, Insights and Forecast - by Geography
- 5.4.1. United States
- 5.4.2. Canada
- 5.4.3. Mexico
- 5.4.4. Rest of North America
- 5.5. Market Analysis, Insights and Forecast - by Region
- 5.5.1. United States
- 5.5.2. Canada
- 5.5.3. Mexico
- 5.5.4. Rest of North America
- 5.1. Market Analysis, Insights and Forecast - by Type
- 6. North America Biosolids Market Analysis, Insights and Forecast, 2021-2033
- 6.1. Market Analysis, Insights and Forecast - by Type
- 6.1.1. Class A
- 6.1.2. Class A EQ (Exceptional Quality)
- 6.1.3. Class B
- 6.2. Market Analysis, Insights and Forecast - by Form
- 6.2.1. Cakes
- 6.2.2. Liquid
- 6.2.3. Pellet
- 6.3. Market Analysis, Insights and Forecast - by Application
- 6.3.1. Agriculture Land Application
- 6.3.1.1. Fertiliz
- 6.3.1.2. Fertilizer for Animal Crop Production - Pastures
- 6.3.2. Non-agricultural Land Application
- 6.3.2.1. Forest Crops (Land Restoration and Forestry)
- 6.3.2.2. Land Reclamation (Roads and Urban Wetlands)
- 6.3.2.3. Reclaiming Mining Sites
- 6.3.2.4. Landscaping, Recreational Fields, and Domestic Use
- 6.3.3. Energy Recovery - Energy Production
- 6.3.3.1. Heat Generation, Incineration, and Gasification
- 6.3.3.2. Oil and Cement Production
- 6.3.3.3. Commercial Uses
- 6.3.1. Agriculture Land Application
- 6.4. Market Analysis, Insights and Forecast - by Geography
- 6.4.1. United States
- 6.4.2. Canada
- 6.4.3. Mexico
- 6.4.4. Rest of North America
- 6.1. Market Analysis, Insights and Forecast - by Type
- 7. United States North America Biosolids Market Analysis, Insights and Forecast, 2020-2032
- 7.1. Market Analysis, Insights and Forecast - by Type
- 7.1.1. Class A
- 7.1.2. Class A EQ (Exceptional Quality)
- 7.1.3. Class B
- 7.2. Market Analysis, Insights and Forecast - by Form
- 7.2.1. Cakes
- 7.2.2. Liquid
- 7.2.3. Pellet
- 7.3. Market Analysis, Insights and Forecast - by Application
- 7.3.1. Agriculture Land Application
- 7.3.1.1. Fertiliz
- 7.3.1.2. Fertilizer for Animal Crop Production - Pastures
- 7.3.2. Non-agricultural Land Application
- 7.3.2.1. Forest Crops (Land Restoration and Forestry)
- 7.3.2.2. Land Reclamation (Roads and Urban Wetlands)
- 7.3.2.3. Reclaiming Mining Sites
- 7.3.2.4. Landscaping, Recreational Fields, and Domestic Use
- 7.3.3. Energy Recovery - Energy Production
- 7.3.3.1. Heat Generation, Incineration, and Gasification
- 7.3.3.2. Oil and Cement Production
- 7.3.3.3. Commercial Uses
- 7.3.1. Agriculture Land Application
- 7.4. Market Analysis, Insights and Forecast - by Geography
- 7.4.1. United States
- 7.4.2. Canada
- 7.4.3. Mexico
- 7.4.4. Rest of North America
- 7.1. Market Analysis, Insights and Forecast - by Type
- 8. Canada North America Biosolids Market Analysis, Insights and Forecast, 2020-2032
- 8.1. Market Analysis, Insights and Forecast - by Type
- 8.1.1. Class A
- 8.1.2. Class A EQ (Exceptional Quality)
- 8.1.3. Class B
- 8.2. Market Analysis, Insights and Forecast - by Form
- 8.2.1. Cakes
- 8.2.2. Liquid
- 8.2.3. Pellet
- 8.3. Market Analysis, Insights and Forecast - by Application
- 8.3.1. Agriculture Land Application
- 8.3.1.1. Fertiliz
- 8.3.1.2. Fertilizer for Animal Crop Production - Pastures
- 8.3.2. Non-agricultural Land Application
- 8.3.2.1. Forest Crops (Land Restoration and Forestry)
- 8.3.2.2. Land Reclamation (Roads and Urban Wetlands)
- 8.3.2.3. Reclaiming Mining Sites
- 8.3.2.4. Landscaping, Recreational Fields, and Domestic Use
- 8.3.3. Energy Recovery - Energy Production
- 8.3.3.1. Heat Generation, Incineration, and Gasification
- 8.3.3.2. Oil and Cement Production
- 8.3.3.3. Commercial Uses
- 8.3.1. Agriculture Land Application
- 8.4. Market Analysis, Insights and Forecast - by Geography
- 8.4.1. United States
- 8.4.2. Canada
- 8.4.3. Mexico
- 8.4.4. Rest of North America
- 8.1. Market Analysis, Insights and Forecast - by Type
- 9. Mexico North America Biosolids Market Analysis, Insights and Forecast, 2020-2032
- 9.1. Market Analysis, Insights and Forecast - by Type
- 9.1.1. Class A
- 9.1.2. Class A EQ (Exceptional Quality)
- 9.1.3. Class B
- 9.2. Market Analysis, Insights and Forecast - by Form
- 9.2.1. Cakes
- 9.2.2. Liquid
- 9.2.3. Pellet
- 9.3. Market Analysis, Insights and Forecast - by Application
- 9.3.1. Agriculture Land Application
- 9.3.1.1. Fertiliz
- 9.3.1.2. Fertilizer for Animal Crop Production - Pastures
- 9.3.2. Non-agricultural Land Application
- 9.3.2.1. Forest Crops (Land Restoration and Forestry)
- 9.3.2.2. Land Reclamation (Roads and Urban Wetlands)
- 9.3.2.3. Reclaiming Mining Sites
- 9.3.2.4. Landscaping, Recreational Fields, and Domestic Use
- 9.3.3. Energy Recovery - Energy Production
- 9.3.3.1. Heat Generation, Incineration, and Gasification
- 9.3.3.2. Oil and Cement Production
- 9.3.3.3. Commercial Uses
- 9.3.1. Agriculture Land Application
- 9.4. Market Analysis, Insights and Forecast - by Geography
- 9.4.1. United States
- 9.4.2. Canada
- 9.4.3. Mexico
- 9.4.4. Rest of North America
- 9.1. Market Analysis, Insights and Forecast - by Type
- 10. Rest of North America North America Biosolids Market Analysis, Insights and Forecast, 2020-2032
- 10.1. Market Analysis, Insights and Forecast - by Type
- 10.1.1. Class A
- 10.1.2. Class A EQ (Exceptional Quality)
- 10.1.3. Class B
- 10.2. Market Analysis, Insights and Forecast - by Form
- 10.2.1. Cakes
- 10.2.2. Liquid
- 10.2.3. Pellet
- 10.3. Market Analysis, Insights and Forecast - by Application
- 10.3.1. Agriculture Land Application
- 10.3.1.1. Fertiliz
- 10.3.1.2. Fertilizer for Animal Crop Production - Pastures
- 10.3.2. Non-agricultural Land Application
- 10.3.2.1. Forest Crops (Land Restoration and Forestry)
- 10.3.2.2. Land Reclamation (Roads and Urban Wetlands)
- 10.3.2.3. Reclaiming Mining Sites
- 10.3.2.4. Landscaping, Recreational Fields, and Domestic Use
- 10.3.3. Energy Recovery - Energy Production
- 10.3.3.1. Heat Generation, Incineration, and Gasification
- 10.3.3.2. Oil and Cement Production
- 10.3.3.3. Commercial Uses
- 10.3.1. Agriculture Land Application
- 10.4. Market Analysis, Insights and Forecast - by Geography
- 10.4.1. United States
- 10.4.2. Canada
- 10.4.3. Mexico
- 10.4.4. Rest of North America
- 10.1. Market Analysis, Insights and Forecast - by Type
- 11. Competitive Analysis
- 11.1. Company Profiles
- 11.1.1 Walker Industries
- 11.1.1.1. Company Overview
- 11.1.1.2. Products
- 11.1.1.3. Company Financials
- 11.1.1.4. SWOT Analysis
- 11.1.2 Fergus Power Pump Inc
- 11.1.2.1. Company Overview
- 11.1.2.2. Products
- 11.1.2.3. Company Financials
- 11.1.2.4. SWOT Analysis
- 11.1.3 Denali Water Solutions
- 11.1.3.1. Company Overview
- 11.1.3.2. Products
- 11.1.3.3. Company Financials
- 11.1.3.4. SWOT Analysis
- 11.1.4 GEOENVIRONMENT TECHNOLOGIES
- 11.1.4.1. Company Overview
- 11.1.4.2. Products
- 11.1.4.3. Company Financials
- 11.1.4.4. SWOT Analysis
- 11.1.5 Anaergia
- 11.1.5.1. Company Overview
- 11.1.5.2. Products
- 11.1.5.3. Company Financials
- 11.1.5.4. SWOT Analysis
- 11.1.6 New England Fertilizer Co (NEFCO)
- 11.1.6.1. Company Overview
- 11.1.6.2. Products
- 11.1.6.3. Company Financials
- 11.1.6.4. SWOT Analysis
- 11.1.7 DC Water
- 11.1.7.1. Company Overview
- 11.1.7.2. Products
- 11.1.7.3. Company Financials
- 11.1.7.4. SWOT Analysis
- 11.1.8 Recyc Systems Inc
- 11.1.8.1. Company Overview
- 11.1.8.2. Products
- 11.1.8.3. Company Financials
- 11.1.8.4. SWOT Analysis
- 11.1.9 BCR Environmental
- 11.1.9.1. Company Overview
- 11.1.9.2. Products
- 11.1.9.3. Company Financials
- 11.1.9.4. SWOT Analysis
- 11.1.10 Burch Hydro
- 11.1.10.1. Company Overview
- 11.1.10.2. Products
- 11.1.10.3. Company Financials
- 11.1.10.4. SWOT Analysis
- 11.1.11 SYLVIS
- 11.1.11.1. Company Overview
- 11.1.11.2. Products
- 11.1.11.3. Company Financials
- 11.1.11.4. SWOT Analysis
- 11.1.12 Casella Waste Systems Inc
- 11.1.12.1. Company Overview
- 11.1.12.2. Products
- 11.1.12.3. Company Financials
- 11.1.12.4. SWOT Analysis
- 11.1.13 Englobe
- 11.1.13.1. Company Overview
- 11.1.13.2. Products
- 11.1.13.3. Company Financials
- 11.1.13.4. SWOT Analysis
- 11.1.14 Lystek International
- 11.1.14.1. Company Overview
- 11.1.14.2. Products
- 11.1.14.3. Company Financials
- 11.1.14.4. SWOT Analysis
- 11.1.15 Synagro Technologies
- 11.1.15.1. Company Overview
- 11.1.15.2. Products
- 11.1.15.3. Company Financials
- 11.1.15.4. SWOT Analysis
- 11.1.16 Merrell Bros Inc
- 11.1.16.1. Company Overview
- 11.1.16.2. Products
- 11.1.16.3. Company Financials
- 11.1.16.4. SWOT Analysis
- 11.1.1 Walker Industries
- 11.2. Market Entropy
- 11.2.1 Company's Key Areas Served
- 11.2.2 Recent Developments
- 11.3. Company Market Share Analysis 2025
- 11.3.1 Top 5 Companies Market Share Analysis
- 11.3.2 Top 3 Companies Market Share Analysis
- 11.4. List of Potential Customers
- 12. Research Methodology
List of Figures
- Figure 1: North America Biosolids Market Revenue Breakdown (billion, %) by Product 2025 & 2033
- Figure 2: North America Biosolids Market Share (%) by Company 2025
List of Tables
- Table 1: North America Biosolids Market Revenue billion Forecast, by Type 2020 & 2033
- Table 2: North America Biosolids Market Volume K Tons Forecast, by Type 2020 & 2033
- Table 3: North America Biosolids Market Revenue billion Forecast, by Form 2020 & 2033
- Table 4: North America Biosolids Market Volume K Tons Forecast, by Form 2020 & 2033
- Table 5: North America Biosolids Market Revenue billion Forecast, by Application 2020 & 2033
- Table 6: North America Biosolids Market Volume K Tons Forecast, by Application 2020 & 2033
- Table 7: North America Biosolids Market Revenue billion Forecast, by Geography 2020 & 2033
- Table 8: North America Biosolids Market Volume K Tons Forecast, by Geography 2020 & 2033
- Table 9: North America Biosolids Market Revenue billion Forecast, by Region 2020 & 2033
- Table 10: North America Biosolids Market Volume K Tons Forecast, by Region 2020 & 2033
- Table 11: North America Biosolids Market Revenue billion Forecast, by Type 2020 & 2033
- Table 12: North America Biosolids Market Volume K Tons Forecast, by Type 2020 & 2033
- Table 13: North America Biosolids Market Revenue billion Forecast, by Form 2020 & 2033
- Table 14: North America Biosolids Market Volume K Tons Forecast, by Form 2020 & 2033
- Table 15: North America Biosolids Market Revenue billion Forecast, by Application 2020 & 2033
- Table 16: North America Biosolids Market Volume K Tons Forecast, by Application 2020 & 2033
- Table 17: North America Biosolids Market Revenue billion Forecast, by Geography 2020 & 2033
- Table 18: North America Biosolids Market Volume K Tons Forecast, by Geography 2020 & 2033
- Table 19: North America Biosolids Market Revenue billion Forecast, by Country 2020 & 2033
- Table 20: North America Biosolids Market Volume K Tons Forecast, by Country 2020 & 2033
- Table 21: North America Biosolids Market Revenue billion Forecast, by Type 2020 & 2033
- Table 22: North America Biosolids Market Volume K Tons Forecast, by Type 2020 & 2033
- Table 23: North America Biosolids Market Revenue billion Forecast, by Form 2020 & 2033
- Table 24: North America Biosolids Market Volume K Tons Forecast, by Form 2020 & 2033
- Table 25: North America Biosolids Market Revenue billion Forecast, by Application 2020 & 2033
- Table 26: North America Biosolids Market Volume K Tons Forecast, by Application 2020 & 2033
- Table 27: North America Biosolids Market Revenue billion Forecast, by Geography 2020 & 2033
- Table 28: North America Biosolids Market Volume K Tons Forecast, by Geography 2020 & 2033
- Table 29: North America Biosolids Market Revenue billion Forecast, by Country 2020 & 2033
- Table 30: North America Biosolids Market Volume K Tons Forecast, by Country 2020 & 2033
- Table 31: North America Biosolids Market Revenue billion Forecast, by Type 2020 & 2033
- Table 32: North America Biosolids Market Volume K Tons Forecast, by Type 2020 & 2033
- Table 33: North America Biosolids Market Revenue billion Forecast, by Form 2020 & 2033
- Table 34: North America Biosolids Market Volume K Tons Forecast, by Form 2020 & 2033
- Table 35: North America Biosolids Market Revenue billion Forecast, by Application 2020 & 2033
- Table 36: North America Biosolids Market Volume K Tons Forecast, by Application 2020 & 2033
- Table 37: North America Biosolids Market Revenue billion Forecast, by Geography 2020 & 2033
- Table 38: North America Biosolids Market Volume K Tons Forecast, by Geography 2020 & 2033
- Table 39: North America Biosolids Market Revenue billion Forecast, by Country 2020 & 2033
- Table 40: North America Biosolids Market Volume K Tons Forecast, by Country 2020 & 2033
- Table 41: North America Biosolids Market Revenue billion Forecast, by Type 2020 & 2033
- Table 42: North America Biosolids Market Volume K Tons Forecast, by Type 2020 & 2033
- Table 43: North America Biosolids Market Revenue billion Forecast, by Form 2020 & 2033
- Table 44: North America Biosolids Market Volume K Tons Forecast, by Form 2020 & 2033
- Table 45: North America Biosolids Market Revenue billion Forecast, by Application 2020 & 2033
- Table 46: North America Biosolids Market Volume K Tons Forecast, by Application 2020 & 2033
- Table 47: North America Biosolids Market Revenue billion Forecast, by Geography 2020 & 2033
- Table 48: North America Biosolids Market Volume K Tons Forecast, by Geography 2020 & 2033
- Table 49: North America Biosolids Market Revenue billion Forecast, by Country 2020 & 2033
- Table 50: North America Biosolids Market Volume K Tons Forecast, by Country 2020 & 2033
Frequently Asked Questions
1. What is the projected Compound Annual Growth Rate (CAGR) of the North America Biosolids Market?
The projected CAGR is approximately 4.5%.
2. Which companies are prominent players in the North America Biosolids Market?
Key companies in the market include Walker Industries, Fergus Power Pump Inc, Denali Water Solutions, GEOENVIRONMENT TECHNOLOGIES, Anaergia, New England Fertilizer Co (NEFCO), DC Water, Recyc Systems Inc, BCR Environmental, Burch Hydro, SYLVIS, Casella Waste Systems Inc, Englobe, Lystek International, Synagro Technologies, Merrell Bros Inc.
3. What are the main segments of the North America Biosolids Market?
The market segments include Type, Form, Application, Geography.
4. Can you provide details about the market size?
The market size is estimated to be USD 3.84 billion as of 2022.
5. What are some drivers contributing to market growth?
; Growing Use as a Replacement For Hazardous Chemical Fertilizers; Stringent Government Emission Laws; Growing Awareness About Organic Food.
6. What are the notable trends driving market growth?
Agriculture Land Application to Dominate the Market.
7. Are there any restraints impacting market growth?
; Lack of Proper Knowledge and Awareness on Biosolids; Impact of COVID-19 Pandemic; Other Restraints.
8. Can you provide examples of recent developments in the market?
N/A
9. What pricing options are available for accessing the report?
Pricing options include single-user, multi-user, and enterprise licenses priced at USD 4750, USD 5250, and USD 8750 respectively.
10. Is the market size provided in terms of value or volume?
The market size is provided in terms of value, measured in billion and volume, measured in K Tons.
11. Are there any specific market keywords associated with the report?
Yes, the market keyword associated with the report is "North America Biosolids Market," which aids in identifying and referencing the specific market segment covered.
12. How do I determine which pricing option suits my needs best?
The pricing options vary based on user requirements and access needs. Individual users may opt for single-user licenses, while businesses requiring broader access may choose multi-user or enterprise licenses for cost-effective access to the report.
13. Are there any additional resources or data provided in the North America Biosolids Market report?
While the report offers comprehensive insights, it's advisable to review the specific contents or supplementary materials provided to ascertain if additional resources or data are available.
14. How can I stay updated on further developments or reports in the North America Biosolids Market?
To stay informed about further developments, trends, and reports in the North America Biosolids Market, consider subscribing to industry newsletters, following relevant companies and organizations, or regularly checking reputable industry news sources and publications.
Methodology
Step 1 - Identification of Relevant Samples Size from Population Database


Step 2 - Approaches for Defining Global Market Size (Value, Volume* & Price*)

Note*: In applicable scenarios
Step 3 - Data Sources
Primary Research
- Web Analytics
- Survey Reports
- Research Institute
- Latest Research Reports
- Opinion Leaders
Secondary Research
- Annual Reports
- White Paper
- Latest Press Release
- Industry Association
- Paid Database
- Investor Presentations

Step 4 - Data Triangulation
Involves using different sources of information in order to increase the validity of a study
These sources are likely to be stakeholders in a program - participants, other researchers, program staff, other community members, and so on.
Then we put all data in single framework & apply various statistical tools to find out the dynamic on the market.
During the analysis stage, feedback from the stakeholder groups would be compared to determine areas of agreement as well as areas of divergence