

Key Insights
The North American surfactants market is poised for significant expansion, projected to reach $46.5 billion by 2025, with a compound annual growth rate (CAGR) of 6.2% from 2025 to 2033. This robust growth is underpinned by surging demand across key end-use industries. The personal care sector, propelled by rising disposable incomes and increased consumer focus on health and wellness, is a primary growth driver, fueling demand for surfactants in a wide array of cosmetics, hair care, and hygiene products. The household cleaning segment also demonstrates strong performance, driven by the persistent consumer preference for efficient and convenient cleaning solutions. Industrial and institutional cleaning, including critical applications in healthcare and commercial facilities, further contributes to substantial market opportunities. The growing emphasis on environmentally conscious and effective cleaning agents is accelerating innovation and the adoption of bio-based surfactants, injecting dynamism into the market. Emerging applications in food processing and agricultural chemicals are also contributing to market expansion.
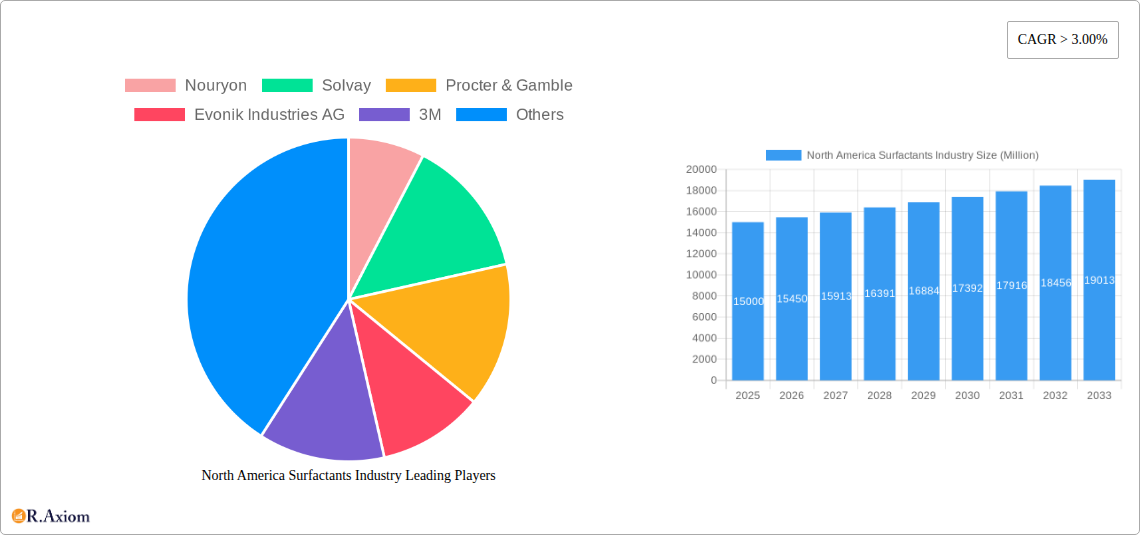
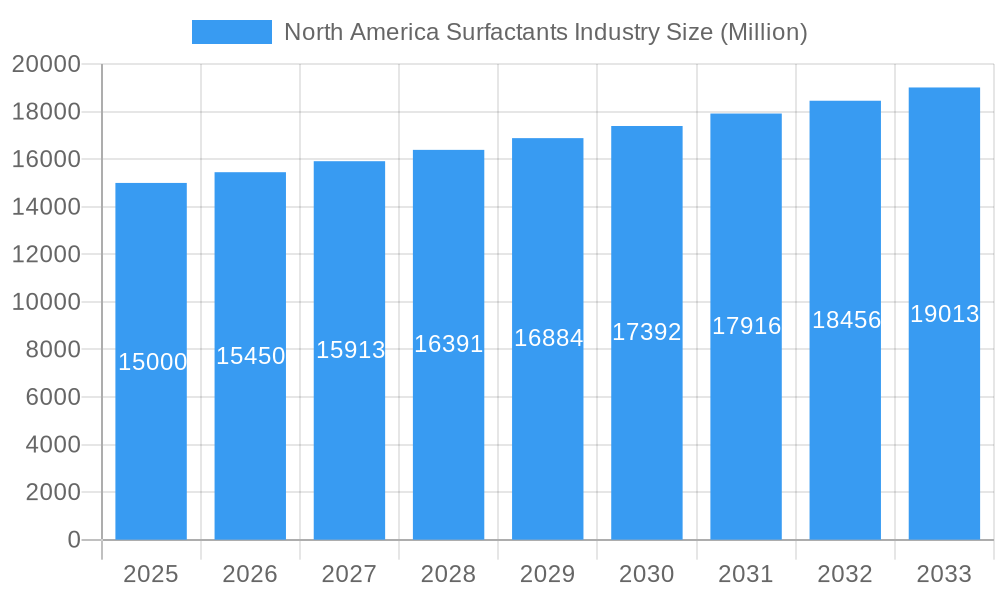
North America Surfactants Industry Market Size (In Billion)
While the market exhibits strong growth potential, certain challenges exist. Increased regulatory oversight regarding the environmental impact of specific surfactant types, alongside price volatility in raw materials, presents potential headwinds. However, continuous investment in research and development, particularly in sustainable and biodegradable alternatives, is effectively addressing these concerns. The market's segmentation across various surfactant types (anionic, cationic, non-ionic, amphoteric, silicone), origins (synthetic, bio-based), and diverse applications offers multifaceted growth avenues for industry participants. Leading companies, including Nouryon, Solvay, Procter & Gamble, and BASF, are actively pursuing product innovation and strategic expansion to leverage these opportunities. As a dominant force in the global market, the North American region is anticipated to retain its leading position throughout the forecast period, driven by the aforementioned growth catalysts.
North America Surfactants Industry Company Market Share
North America Surfactants Industry: A Comprehensive Market Report (2019-2033)
This detailed report provides a comprehensive analysis of the North America surfactants industry, covering market size, segmentation, growth drivers, challenges, and key players. The report utilizes data from the historical period (2019-2024), base year (2025), and forecasts the market until 2033. This in-depth analysis is crucial for industry stakeholders, investors, and strategic decision-makers seeking actionable insights into this dynamic market.
North America Surfactants Industry Market Concentration & Innovation
The North America surfactants market exhibits a moderately concentrated landscape, with several multinational corporations holding significant market share. Key players include Nouryon, Solvay, Procter & Gamble, Evonik Industries AG, 3M, Croda International Plc, Ashland, BASF SE, Huntsman International LLC, Sasol, Dow, Godrej Industries Limited, GALAXY, MITSUI CHEMICALS AMERICA INC, CLARIANT, Henkel Corporation, Kao Corporation, Stepan Company, and Innospec. The market share of the top five players is estimated at xx%, indicating a competitive but not overly dominated market. Innovation is driven by the demand for sustainable and high-performance surfactants, leading to significant R&D investments in bio-based surfactants and specialized formulations. Regulatory frameworks, particularly concerning environmental regulations and safety standards, heavily influence product development and market dynamics. The presence of substitute products, such as natural cleaning agents, is creating competitive pressure, while end-user trends towards eco-friendly and specialized cleaning solutions are shaping market demand. M&A activity has been moderate, with recent examples including Huntsman Corporation's divestment of its Textile Effects segment in August 2022. The value of this deal was xx Million. This activity reflects consolidation efforts and strategic shifts within the industry.
- Market Concentration: Top 5 players hold xx% market share (estimated).
- Innovation Drivers: Sustainability, high-performance formulations, regulatory compliance.
- M&A Activity: Moderate activity, exemplified by Huntsman's divestment of Textile Effects (August 2022, xx Million).
- Regulatory Frameworks: Significant influence on product development and market entry.
- End-user Trends: Growing demand for eco-friendly and specialized surfactants.
North America Surfactants Industry Industry Trends & Insights
The North America surfactants market is projected to witness robust growth during the forecast period (2025-2033), with a Compound Annual Growth Rate (CAGR) of xx%. This growth is primarily fueled by increasing demand from key application segments, such as household cleaning, personal care, and industrial applications. Technological advancements in surfactant formulations, including the development of bio-based and high-performance surfactants, are further driving market expansion. Consumer preferences are shifting towards sustainable and eco-friendly products, pushing manufacturers to innovate and develop more environmentally responsible options. The market is also experiencing intensified competition, with companies focusing on product differentiation, brand building, and strategic partnerships to gain a competitive edge. Market penetration of bio-based surfactants is increasing, currently at approximately xx% and projected to reach xx% by 2033. This reflects growing consumer awareness and regulatory pressures promoting sustainability.
Dominant Markets & Segments in North America Surfactants Industry
The United States dominates the North America surfactants market, driven by its large population, robust economy, and significant consumption of surfactants across various applications. Within segments:
- Type: Anionic surfactants hold the largest market share due to their wide applicability and cost-effectiveness. However, non-ionic and bio-based surfactants are witnessing faster growth rates due to increasing demand for environmentally friendly options.
- Origin: Synthetic surfactants currently dominate, but bio-based surfactants are gaining traction due to sustainability concerns.
- Application: Household soap and detergents represent the largest application segment, followed by personal care and industrial & institutional cleaning. Growth in specialized industrial applications, such as oilfield chemicals, is also notable.
Key Drivers:
- Strong economic growth in the US.
- Developed infrastructure supporting manufacturing and distribution.
- Growing consumer spending on household and personal care products.
North America Surfactants Industry Product Developments
Recent product innovations focus on enhanced performance, biodegradability, and sustainability. Companies are developing specialized surfactants tailored to specific applications, such as high-efficiency cleaning agents and environmentally friendly personal care products. These advancements reflect technological trends towards more sustainable and efficient solutions, addressing growing consumer demand for environmentally conscious products and tighter regulatory frameworks. This focus on tailored solutions contributes to stronger market fit and competitive advantages.
Report Scope & Segmentation Analysis
This report segments the North America surfactants market based on type (anionic, cationic, non-ionic, amphoteric, silicone, others), origin (synthetic, bio-based), and application (household soap & detergent, personal care, lubricants & fuel additives, industrial & institutional cleaning, food processing, oilfield chemicals, agricultural chemicals, textile processing, emulsion polymerization, others). Each segment is analyzed in detail, providing market size, growth projections, and competitive dynamics. Growth projections vary by segment, with bio-based surfactants and specialized industrial applications exhibiting the highest growth potential. Competitive dynamics are shaped by factors such as product innovation, brand reputation, and pricing strategies.
Key Drivers of North America Surfactants Industry Growth
The North America surfactants industry's growth is primarily driven by increasing demand from various end-use sectors, particularly household care, personal care, and industrial cleaning. The growing adoption of sustainable practices and increasing awareness of environmental concerns fuel demand for bio-based surfactants. Technological advancements in surfactant formulations, enabling the creation of more efficient and effective products, also contribute to the industry's growth. Favorable economic conditions in North America further boost market expansion.
Challenges in the North America Surfactants Industry Sector
The industry faces challenges such as fluctuating raw material prices, stringent environmental regulations, and intense competition. Supply chain disruptions can impact production and profitability, and meeting increasingly stringent safety and environmental standards requires substantial investments in R&D and infrastructure. The emergence of alternative cleaning solutions also poses a competitive threat, requiring innovation and adaptation to maintain market share. The total estimated impact of these challenges on market growth is approximately xx Million annually.
Emerging Opportunities in North America Surfactants Industry
Emerging opportunities include the growing demand for sustainable and bio-based surfactants, increasing application in specialized industries (e.g., oilfield chemicals, advanced materials), and the potential for personalized cleaning solutions. The rising focus on hygiene and sanitation, especially post-pandemic, is also presenting significant opportunities for growth in the disinfectant and antimicrobial surfactant markets. Expanding into new markets and developing innovative formulations catering to specific needs will likely yield significant returns.
Leading Players in the North America Surfactants Industry Market
- Nouryon
- Solvay
- Procter & Gamble
- Evonik Industries AG
- 3M
- Croda International Plc
- Ashland
- BASF SE
- Huntsman International LLC
- Sasol
- Dow
- Godrej Industries Limited
- GALAXY
- MITSUI CHEMICALS AMERICA INC
- CLARIANT
- Henkel Corporation
- Kao Corporation
- Stepan Company
- Innospec
Key Developments in North America Surfactants Industry Industry
- August 2022: Huntsman Corporation announced a binding agreement to sell its Textile Effects segment to Archroma.
- January 2023: Nouryon introduced Triameen Y12D, an antibacterial active, in the US market.
Strategic Outlook for North America Surfactants Industry Market
The North America surfactants market presents significant growth potential, driven by increasing demand from various sectors, innovation in sustainable and high-performance formulations, and favorable economic conditions. Strategic players should focus on R&D to develop environmentally friendly and specialized products, expand into high-growth application segments, and explore strategic partnerships to secure market share. The increasing emphasis on sustainability and regulatory pressures will continue to shape the market, offering opportunities for companies that can successfully adapt and innovate.
North America Surfactants Industry Segmentation
-
1. Type
- 1.1. Anionic Surfactant
- 1.2. Cationic Surfactant
- 1.3. Non-ionic Surfactant
- 1.4. Amphoteric Surfactant
- 1.5. Silicone Surfactant
- 1.6. Other Types
-
2. Origin
- 2.1. Synthetic Surfactant
- 2.2. Bio-based Surfactant
-
3. Application
- 3.1. Household Soap and Detergent
- 3.2. Personal Care
- 3.3. Lubricants and Fuel Additives
- 3.4. Industry & Institutional Cleaning
- 3.5. Food Processing
- 3.6. Oilfield Chemicals
- 3.7. Agricultural Chemicals
- 3.8. Textile Processing
- 3.9. Emulsion Polymerization
- 3.10. Other Applications
-
4. Geography
- 4.1. United States
- 4.2. Canada
- 4.3. Mexico
- 4.4. Rest of North America
North America Surfactants Industry Segmentation By Geography
- 1. United States
- 2. Canada
- 3. Mexico
- 4. Rest of North America
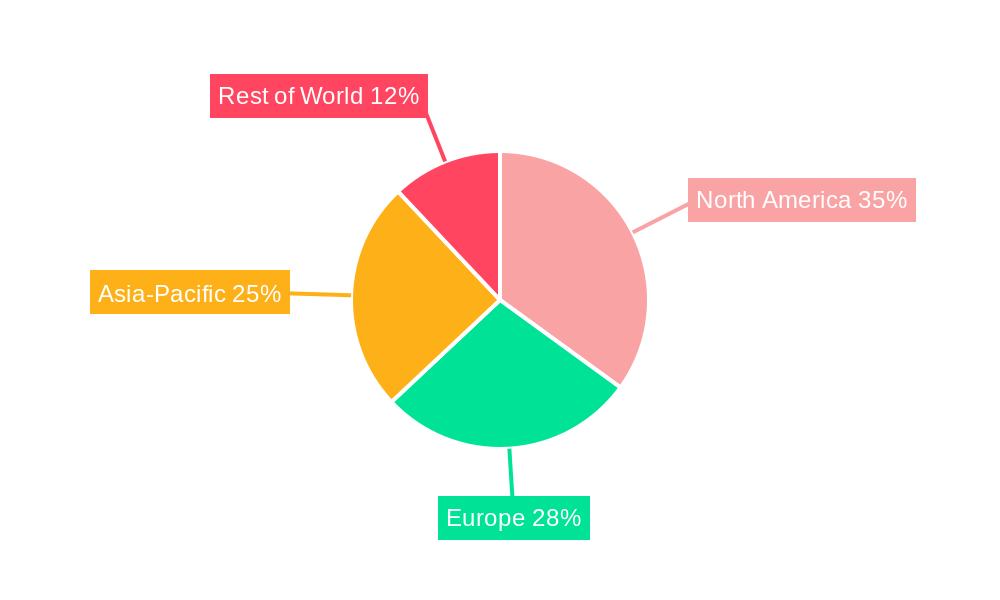
North America Surfactants Industry Regional Market Share
Geographic Coverage of North America Surfactants Industry
North America Surfactants Industry REPORT HIGHLIGHTS
| Aspects | Details |
|---|---|
| Study Period | 2020-2034 |
| Base Year | 2025 |
| Estimated Year | 2026 |
| Forecast Period | 2026-2034 |
| Historical Period | 2020-2025 |
| Growth Rate | CAGR of 6.2% from 2020-2034 |
| Segmentation |
|
Table of Contents
- 1. Introduction
- 1.1. Research Scope
- 1.2. Market Segmentation
- 1.3. Research Objective
- 1.4. Definitions and Assumptions
- 2. Executive Summary
- 2.1. Market Snapshot
- 3. Market Dynamics
- 3.1. Market Drivers
- 3.2. Market Restrains
- 3.3. Market Trends
- 3.4. Market Opportunities
- 4. Market Factor Analysis
- 4.1. Porters Five Forces
- 4.1.1. Bargaining Power of Suppliers
- 4.1.2. Bargaining Power of Buyers
- 4.1.3. Threat of New Entrants
- 4.1.4. Threat of Substitutes
- 4.1.5. Competitive Rivalry
- 4.2. PESTEL analysis
- 4.3. BCG Analysis
- 4.3.1. Stars (High Growth, High Market Share)
- 4.3.2. Cash Cows (Low Growth, High Market Share)
- 4.3.3. Question Mark (High Growth, Low Market Share)
- 4.3.4. Dogs (Low Growth, Low Market Share)
- 4.4. Ansoff Matrix Analysis
- 4.5. Supply Chain Analysis
- 4.6. Regulatory Landscape
- 4.7. Current Market Potential and Opportunity Assessment (TAM–SAM–SOM Framework)
- 4.8. RAX Analyst Note
- 4.1. Porters Five Forces
- 5. Market Analysis, Insights and Forecast 2021-2033
- 5.1. Market Analysis, Insights and Forecast - by Type
- 5.1.1. Anionic Surfactant
- 5.1.2. Cationic Surfactant
- 5.1.3. Non-ionic Surfactant
- 5.1.4. Amphoteric Surfactant
- 5.1.5. Silicone Surfactant
- 5.1.6. Other Types
- 5.2. Market Analysis, Insights and Forecast - by Origin
- 5.2.1. Synthetic Surfactant
- 5.2.2. Bio-based Surfactant
- 5.3. Market Analysis, Insights and Forecast - by Application
- 5.3.1. Household Soap and Detergent
- 5.3.2. Personal Care
- 5.3.3. Lubricants and Fuel Additives
- 5.3.4. Industry & Institutional Cleaning
- 5.3.5. Food Processing
- 5.3.6. Oilfield Chemicals
- 5.3.7. Agricultural Chemicals
- 5.3.8. Textile Processing
- 5.3.9. Emulsion Polymerization
- 5.3.10. Other Applications
- 5.4. Market Analysis, Insights and Forecast - by Geography
- 5.4.1. United States
- 5.4.2. Canada
- 5.4.3. Mexico
- 5.4.4. Rest of North America
- 5.5. Market Analysis, Insights and Forecast - by Region
- 5.5.1. United States
- 5.5.2. Canada
- 5.5.3. Mexico
- 5.5.4. Rest of North America
- 5.1. Market Analysis, Insights and Forecast - by Type
- 6. North America Surfactants Industry Analysis, Insights and Forecast, 2021-2033
- 6.1. Market Analysis, Insights and Forecast - by Type
- 6.1.1. Anionic Surfactant
- 6.1.2. Cationic Surfactant
- 6.1.3. Non-ionic Surfactant
- 6.1.4. Amphoteric Surfactant
- 6.1.5. Silicone Surfactant
- 6.1.6. Other Types
- 6.2. Market Analysis, Insights and Forecast - by Origin
- 6.2.1. Synthetic Surfactant
- 6.2.2. Bio-based Surfactant
- 6.3. Market Analysis, Insights and Forecast - by Application
- 6.3.1. Household Soap and Detergent
- 6.3.2. Personal Care
- 6.3.3. Lubricants and Fuel Additives
- 6.3.4. Industry & Institutional Cleaning
- 6.3.5. Food Processing
- 6.3.6. Oilfield Chemicals
- 6.3.7. Agricultural Chemicals
- 6.3.8. Textile Processing
- 6.3.9. Emulsion Polymerization
- 6.3.10. Other Applications
- 6.4. Market Analysis, Insights and Forecast - by Geography
- 6.4.1. United States
- 6.4.2. Canada
- 6.4.3. Mexico
- 6.4.4. Rest of North America
- 6.1. Market Analysis, Insights and Forecast - by Type
- 7. United States North America Surfactants Industry Analysis, Insights and Forecast, 2020-2032
- 7.1. Market Analysis, Insights and Forecast - by Type
- 7.1.1. Anionic Surfactant
- 7.1.2. Cationic Surfactant
- 7.1.3. Non-ionic Surfactant
- 7.1.4. Amphoteric Surfactant
- 7.1.5. Silicone Surfactant
- 7.1.6. Other Types
- 7.2. Market Analysis, Insights and Forecast - by Origin
- 7.2.1. Synthetic Surfactant
- 7.2.2. Bio-based Surfactant
- 7.3. Market Analysis, Insights and Forecast - by Application
- 7.3.1. Household Soap and Detergent
- 7.3.2. Personal Care
- 7.3.3. Lubricants and Fuel Additives
- 7.3.4. Industry & Institutional Cleaning
- 7.3.5. Food Processing
- 7.3.6. Oilfield Chemicals
- 7.3.7. Agricultural Chemicals
- 7.3.8. Textile Processing
- 7.3.9. Emulsion Polymerization
- 7.3.10. Other Applications
- 7.4. Market Analysis, Insights and Forecast - by Geography
- 7.4.1. United States
- 7.4.2. Canada
- 7.4.3. Mexico
- 7.4.4. Rest of North America
- 7.1. Market Analysis, Insights and Forecast - by Type
- 8. Canada North America Surfactants Industry Analysis, Insights and Forecast, 2020-2032
- 8.1. Market Analysis, Insights and Forecast - by Type
- 8.1.1. Anionic Surfactant
- 8.1.2. Cationic Surfactant
- 8.1.3. Non-ionic Surfactant
- 8.1.4. Amphoteric Surfactant
- 8.1.5. Silicone Surfactant
- 8.1.6. Other Types
- 8.2. Market Analysis, Insights and Forecast - by Origin
- 8.2.1. Synthetic Surfactant
- 8.2.2. Bio-based Surfactant
- 8.3. Market Analysis, Insights and Forecast - by Application
- 8.3.1. Household Soap and Detergent
- 8.3.2. Personal Care
- 8.3.3. Lubricants and Fuel Additives
- 8.3.4. Industry & Institutional Cleaning
- 8.3.5. Food Processing
- 8.3.6. Oilfield Chemicals
- 8.3.7. Agricultural Chemicals
- 8.3.8. Textile Processing
- 8.3.9. Emulsion Polymerization
- 8.3.10. Other Applications
- 8.4. Market Analysis, Insights and Forecast - by Geography
- 8.4.1. United States
- 8.4.2. Canada
- 8.4.3. Mexico
- 8.4.4. Rest of North America
- 8.1. Market Analysis, Insights and Forecast - by Type
- 9. Mexico North America Surfactants Industry Analysis, Insights and Forecast, 2020-2032
- 9.1. Market Analysis, Insights and Forecast - by Type
- 9.1.1. Anionic Surfactant
- 9.1.2. Cationic Surfactant
- 9.1.3. Non-ionic Surfactant
- 9.1.4. Amphoteric Surfactant
- 9.1.5. Silicone Surfactant
- 9.1.6. Other Types
- 9.2. Market Analysis, Insights and Forecast - by Origin
- 9.2.1. Synthetic Surfactant
- 9.2.2. Bio-based Surfactant
- 9.3. Market Analysis, Insights and Forecast - by Application
- 9.3.1. Household Soap and Detergent
- 9.3.2. Personal Care
- 9.3.3. Lubricants and Fuel Additives
- 9.3.4. Industry & Institutional Cleaning
- 9.3.5. Food Processing
- 9.3.6. Oilfield Chemicals
- 9.3.7. Agricultural Chemicals
- 9.3.8. Textile Processing
- 9.3.9. Emulsion Polymerization
- 9.3.10. Other Applications
- 9.4. Market Analysis, Insights and Forecast - by Geography
- 9.4.1. United States
- 9.4.2. Canada
- 9.4.3. Mexico
- 9.4.4. Rest of North America
- 9.1. Market Analysis, Insights and Forecast - by Type
- 10. Rest of North America North America Surfactants Industry Analysis, Insights and Forecast, 2020-2032
- 10.1. Market Analysis, Insights and Forecast - by Type
- 10.1.1. Anionic Surfactant
- 10.1.2. Cationic Surfactant
- 10.1.3. Non-ionic Surfactant
- 10.1.4. Amphoteric Surfactant
- 10.1.5. Silicone Surfactant
- 10.1.6. Other Types
- 10.2. Market Analysis, Insights and Forecast - by Origin
- 10.2.1. Synthetic Surfactant
- 10.2.2. Bio-based Surfactant
- 10.3. Market Analysis, Insights and Forecast - by Application
- 10.3.1. Household Soap and Detergent
- 10.3.2. Personal Care
- 10.3.3. Lubricants and Fuel Additives
- 10.3.4. Industry & Institutional Cleaning
- 10.3.5. Food Processing
- 10.3.6. Oilfield Chemicals
- 10.3.7. Agricultural Chemicals
- 10.3.8. Textile Processing
- 10.3.9. Emulsion Polymerization
- 10.3.10. Other Applications
- 10.4. Market Analysis, Insights and Forecast - by Geography
- 10.4.1. United States
- 10.4.2. Canada
- 10.4.3. Mexico
- 10.4.4. Rest of North America
- 10.1. Market Analysis, Insights and Forecast - by Type
- 11. Competitive Analysis
- 11.1. Company Profiles
- 11.1.1 Nouryon
- 11.1.1.1. Company Overview
- 11.1.1.2. Products
- 11.1.1.3. Company Financials
- 11.1.1.4. SWOT Analysis
- 11.1.2 Solvay
- 11.1.2.1. Company Overview
- 11.1.2.2. Products
- 11.1.2.3. Company Financials
- 11.1.2.4. SWOT Analysis
- 11.1.3 Procter & Gamble
- 11.1.3.1. Company Overview
- 11.1.3.2. Products
- 11.1.3.3. Company Financials
- 11.1.3.4. SWOT Analysis
- 11.1.4 Evonik Industries AG
- 11.1.4.1. Company Overview
- 11.1.4.2. Products
- 11.1.4.3. Company Financials
- 11.1.4.4. SWOT Analysis
- 11.1.5 3M
- 11.1.5.1. Company Overview
- 11.1.5.2. Products
- 11.1.5.3. Company Financials
- 11.1.5.4. SWOT Analysis
- 11.1.6 Croda International Plc
- 11.1.6.1. Company Overview
- 11.1.6.2. Products
- 11.1.6.3. Company Financials
- 11.1.6.4. SWOT Analysis
- 11.1.7 Ashland
- 11.1.7.1. Company Overview
- 11.1.7.2. Products
- 11.1.7.3. Company Financials
- 11.1.7.4. SWOT Analysis
- 11.1.8 BASF SE
- 11.1.8.1. Company Overview
- 11.1.8.2. Products
- 11.1.8.3. Company Financials
- 11.1.8.4. SWOT Analysis
- 11.1.9 Huntsman International LLC
- 11.1.9.1. Company Overview
- 11.1.9.2. Products
- 11.1.9.3. Company Financials
- 11.1.9.4. SWOT Analysis
- 11.1.10 Sasol
- 11.1.10.1. Company Overview
- 11.1.10.2. Products
- 11.1.10.3. Company Financials
- 11.1.10.4. SWOT Analysis
- 11.1.11 Dow
- 11.1.11.1. Company Overview
- 11.1.11.2. Products
- 11.1.11.3. Company Financials
- 11.1.11.4. SWOT Analysis
- 11.1.12 Godrej Industries Limited
- 11.1.12.1. Company Overview
- 11.1.12.2. Products
- 11.1.12.3. Company Financials
- 11.1.12.4. SWOT Analysis
- 11.1.13 GALAXY
- 11.1.13.1. Company Overview
- 11.1.13.2. Products
- 11.1.13.3. Company Financials
- 11.1.13.4. SWOT Analysis
- 11.1.14 MITSUI CHEMICALS AMERICA INC
- 11.1.14.1. Company Overview
- 11.1.14.2. Products
- 11.1.14.3. Company Financials
- 11.1.14.4. SWOT Analysis
- 11.1.15 CLARIANT
- 11.1.15.1. Company Overview
- 11.1.15.2. Products
- 11.1.15.3. Company Financials
- 11.1.15.4. SWOT Analysis
- 11.1.16 Henkel Corporation
- 11.1.16.1. Company Overview
- 11.1.16.2. Products
- 11.1.16.3. Company Financials
- 11.1.16.4. SWOT Analysis
- 11.1.17 Kao Corporation
- 11.1.17.1. Company Overview
- 11.1.17.2. Products
- 11.1.17.3. Company Financials
- 11.1.17.4. SWOT Analysis
- 11.1.18 Stepan Company*List Not Exhaustive
- 11.1.18.1. Company Overview
- 11.1.18.2. Products
- 11.1.18.3. Company Financials
- 11.1.18.4. SWOT Analysis
- 11.1.19 Innospec
- 11.1.19.1. Company Overview
- 11.1.19.2. Products
- 11.1.19.3. Company Financials
- 11.1.19.4. SWOT Analysis
- 11.1.1 Nouryon
- 11.2. Market Entropy
- 11.2.1 Company's Key Areas Served
- 11.2.2 Recent Developments
- 11.3. Company Market Share Analysis 2025
- 11.3.1 Top 5 Companies Market Share Analysis
- 11.3.2 Top 3 Companies Market Share Analysis
- 11.4. List of Potential Customers
- 12. Research Methodology
List of Figures
- Figure 1: North America Surfactants Industry Revenue Breakdown (billion, %) by Product 2025 & 2033
- Figure 2: North America Surfactants Industry Share (%) by Company 2025
List of Tables
- Table 1: North America Surfactants Industry Revenue billion Forecast, by Type 2020 & 2033
- Table 2: North America Surfactants Industry Revenue billion Forecast, by Origin 2020 & 2033
- Table 3: North America Surfactants Industry Revenue billion Forecast, by Application 2020 & 2033
- Table 4: North America Surfactants Industry Revenue billion Forecast, by Geography 2020 & 2033
- Table 5: North America Surfactants Industry Revenue billion Forecast, by Region 2020 & 2033
- Table 6: North America Surfactants Industry Revenue billion Forecast, by Type 2020 & 2033
- Table 7: North America Surfactants Industry Revenue billion Forecast, by Origin 2020 & 2033
- Table 8: North America Surfactants Industry Revenue billion Forecast, by Application 2020 & 2033
- Table 9: North America Surfactants Industry Revenue billion Forecast, by Geography 2020 & 2033
- Table 10: North America Surfactants Industry Revenue billion Forecast, by Country 2020 & 2033
- Table 11: North America Surfactants Industry Revenue billion Forecast, by Type 2020 & 2033
- Table 12: North America Surfactants Industry Revenue billion Forecast, by Origin 2020 & 2033
- Table 13: North America Surfactants Industry Revenue billion Forecast, by Application 2020 & 2033
- Table 14: North America Surfactants Industry Revenue billion Forecast, by Geography 2020 & 2033
- Table 15: North America Surfactants Industry Revenue billion Forecast, by Country 2020 & 2033
- Table 16: North America Surfactants Industry Revenue billion Forecast, by Type 2020 & 2033
- Table 17: North America Surfactants Industry Revenue billion Forecast, by Origin 2020 & 2033
- Table 18: North America Surfactants Industry Revenue billion Forecast, by Application 2020 & 2033
- Table 19: North America Surfactants Industry Revenue billion Forecast, by Geography 2020 & 2033
- Table 20: North America Surfactants Industry Revenue billion Forecast, by Country 2020 & 2033
- Table 21: North America Surfactants Industry Revenue billion Forecast, by Type 2020 & 2033
- Table 22: North America Surfactants Industry Revenue billion Forecast, by Origin 2020 & 2033
- Table 23: North America Surfactants Industry Revenue billion Forecast, by Application 2020 & 2033
- Table 24: North America Surfactants Industry Revenue billion Forecast, by Geography 2020 & 2033
- Table 25: North America Surfactants Industry Revenue billion Forecast, by Country 2020 & 2033
Frequently Asked Questions
1. What is the projected Compound Annual Growth Rate (CAGR) of the North America Surfactants Industry?
The projected CAGR is approximately 6.2%.
2. Which companies are prominent players in the North America Surfactants Industry?
Key companies in the market include Nouryon, Solvay, Procter & Gamble, Evonik Industries AG, 3M, Croda International Plc, Ashland, BASF SE, Huntsman International LLC, Sasol, Dow, Godrej Industries Limited, GALAXY, MITSUI CHEMICALS AMERICA INC, CLARIANT, Henkel Corporation, Kao Corporation, Stepan Company*List Not Exhaustive, Innospec.
3. What are the main segments of the North America Surfactants Industry?
The market segments include Type, Origin, Application, Geography.
4. Can you provide details about the market size?
The market size is estimated to be USD 46.5 billion as of 2022.
5. What are some drivers contributing to market growth?
Increasing Demand for Bio-surfactants; Other Drivers.
6. What are the notable trends driving market growth?
Increasing Demand for Household Soaps and Detergents.
7. Are there any restraints impacting market growth?
Environmental Concerns Related to Synthetic Surfactants; Other Restraints.
8. Can you provide examples of recent developments in the market?
January 2023: Nouryon introduced Triameen Y12D (an antibacterial active) in the United States market. It enables users to create high-efficiency disinfectants for a number of applications, such as residential, institutional, and industrial applications.
9. What pricing options are available for accessing the report?
Pricing options include single-user, multi-user, and enterprise licenses priced at USD 3800, USD 4500, and USD 5800 respectively.
10. Is the market size provided in terms of value or volume?
The market size is provided in terms of value, measured in billion.
11. Are there any specific market keywords associated with the report?
Yes, the market keyword associated with the report is "North America Surfactants Industry," which aids in identifying and referencing the specific market segment covered.
12. How do I determine which pricing option suits my needs best?
The pricing options vary based on user requirements and access needs. Individual users may opt for single-user licenses, while businesses requiring broader access may choose multi-user or enterprise licenses for cost-effective access to the report.
13. Are there any additional resources or data provided in the North America Surfactants Industry report?
While the report offers comprehensive insights, it's advisable to review the specific contents or supplementary materials provided to ascertain if additional resources or data are available.
14. How can I stay updated on further developments or reports in the North America Surfactants Industry?
To stay informed about further developments, trends, and reports in the North America Surfactants Industry, consider subscribing to industry newsletters, following relevant companies and organizations, or regularly checking reputable industry news sources and publications.
Methodology
Step 1 - Identification of Relevant Samples Size from Population Database


Step 2 - Approaches for Defining Global Market Size (Value, Volume* & Price*)

Note*: In applicable scenarios
Step 3 - Data Sources
Primary Research
- Web Analytics
- Survey Reports
- Research Institute
- Latest Research Reports
- Opinion Leaders
Secondary Research
- Annual Reports
- White Paper
- Latest Press Release
- Industry Association
- Paid Database
- Investor Presentations

Step 4 - Data Triangulation
Involves using different sources of information in order to increase the validity of a study
These sources are likely to be stakeholders in a program - participants, other researchers, program staff, other community members, and so on.
Then we put all data in single framework & apply various statistical tools to find out the dynamic on the market.
During the analysis stage, feedback from the stakeholder groups would be compared to determine areas of agreement as well as areas of divergence