Key Insights
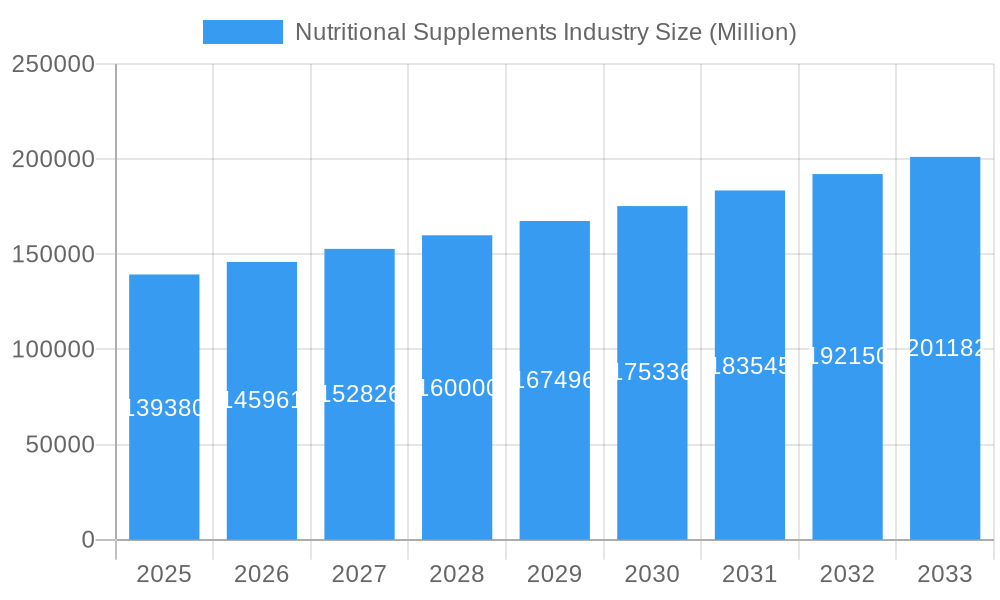
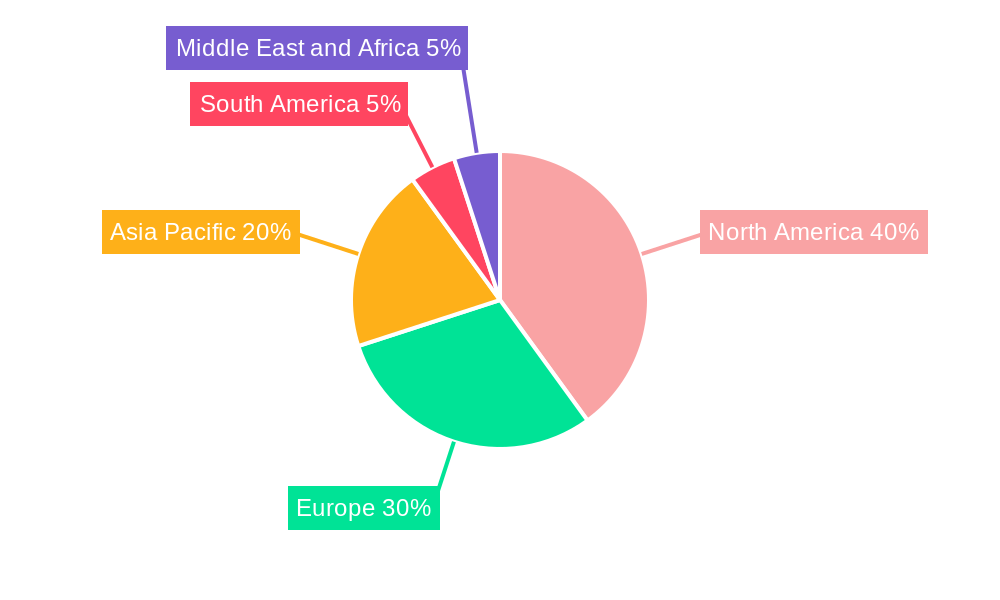
The global nutritional supplements market, valued at $139.38 billion in 2025, is projected to experience robust growth, exhibiting a compound annual growth rate (CAGR) of 4.50% from 2025 to 2033. This expansion is driven by several key factors. Increasing health consciousness among consumers, coupled with rising prevalence of chronic diseases like diabetes and cardiovascular conditions, fuels demand for supplements addressing specific health needs. The growing popularity of wellness and preventative healthcare further contributes to market growth. Convenient formats like gummies and powders, along with readily available online retail channels, enhance accessibility and broaden the consumer base. Furthermore, strategic collaborations between supplement manufacturers and healthcare professionals are building trust and credibility within the market. The market segmentation reveals significant opportunities across various product types (vitamins & minerals, herbal supplements, probiotics, etc.), forms (tablets, capsules, powders), and health applications (bone & joint health, energy & weight management, immunity). North America and Europe currently hold substantial market shares, but the Asia-Pacific region is anticipated to show significant growth due to rising disposable incomes and expanding awareness of health and wellness.
Nutritional Supplements Industry Market Size (In Billion)
While the market enjoys favorable growth prospects, several challenges exist. Stringent regulatory frameworks and fluctuating raw material costs can impact profitability. Moreover, concerns regarding product efficacy and safety remain, demanding transparency and rigorous quality control measures from manufacturers. Competition is fierce, with established players like Abbott Nutrition and Pfizer vying for market share alongside emerging brands. Successfully navigating these challenges requires a focus on innovation, product differentiation, strong branding, and effective marketing strategies that emphasize transparency and build consumer trust. This involves developing targeted products addressing specific health concerns with scientifically-backed formulations and marketing these products through appropriate channels to reach the relevant consumer segments. Companies that can effectively leverage digital marketing and e-commerce platforms will gain a significant competitive advantage.
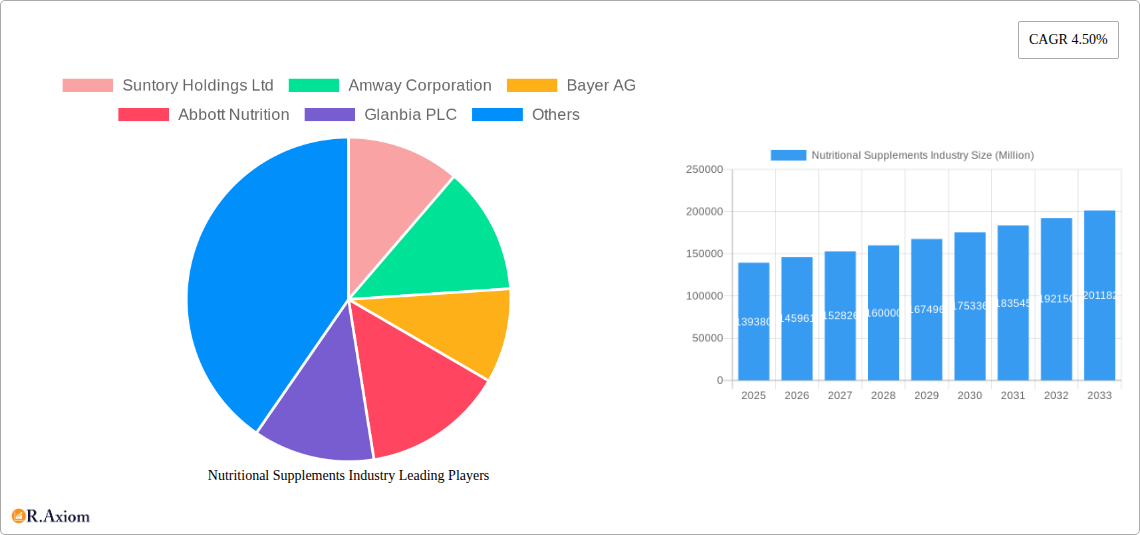
Nutritional Supplements Industry Company Market Share
Nutritional Supplements Industry: A Comprehensive Market Report (2019-2033)
This in-depth report provides a comprehensive analysis of the global nutritional supplements market, covering the period from 2019 to 2033. It delves into market dynamics, competitive landscapes, and future growth prospects, offering valuable insights for industry stakeholders, investors, and researchers. The report leverages extensive data and analysis to forecast market trends and identify key opportunities within this dynamic sector. The global nutritional supplements market is projected to reach xx Million by 2033, exhibiting a CAGR of xx% during the forecast period (2025-2033).
Nutritional Supplements Industry Market Concentration & Innovation
The nutritional supplements industry is characterized by a blend of large multinational corporations and smaller niche players. Market concentration is moderate, with several key players holding significant market share. For instance, companies like Suntory Holdings Ltd, Amway Corporation, Bayer AG, Abbott Nutrition, Glanbia PLC, Haleon Plc, Herbalife Nutrition, Otsuka Holdings Co Ltd, The Bountiful Company, and Pfizer Inc. collectively account for a substantial portion of global revenue. However, the market also features a large number of smaller companies specializing in specific segments or regions.
- Market Share: The top 5 companies hold an estimated xx% of the global market share in 2025. Precise figures are dependent on internal company data not publicly available.
- M&A Activity: The industry witnesses consistent M&A activity, with larger companies acquiring smaller firms to expand their product portfolios and geographic reach. The total value of M&A deals in the sector during the historical period (2019-2024) is estimated at xx Million. This trend is expected to continue, driven by the consolidation of the industry and the need for scale.
- Innovation: Innovation is a key driver in the industry, with continuous development of new formulations, delivery systems, and functional ingredients. This is spurred by increasing consumer demand for specialized supplements catering to specific health needs and lifestyle preferences.
- Regulatory Frameworks: Regulatory frameworks vary across different regions, significantly impacting product development and market access. Stricter regulations in some regions lead to higher compliance costs and slower product launches.
- Product Substitutes: The industry faces competition from alternative health and wellness products, including functional foods, dietary changes, and other natural remedies.
- End-User Trends: Increasing health awareness, rising disposable incomes, and the aging global population are driving growth in the supplements market.
Nutritional Supplements Industry Industry Trends & Insights
The nutritional supplements market is experiencing robust growth, driven by several key factors. Rising health consciousness among consumers, coupled with a growing understanding of the role of nutrition in overall well-being, is a primary catalyst. The increasing prevalence of chronic diseases, including cardiovascular disease and diabetes, also contributes to demand for supplements addressing specific health concerns. Technological advancements in formulation and delivery systems are enhancing product efficacy and appeal, attracting a wider consumer base. The rising popularity of online retail channels is broadening market access and driving sales growth. The market is also influenced by shifting consumer preferences towards natural and organic products, sustainable sourcing practices, and personalized nutrition solutions. The CAGR for the nutritional supplements market during the study period (2019-2024) was xx%, indicating a healthy growth trajectory. Market penetration rates vary significantly across different segments and regions, with developed markets exhibiting higher penetration compared to developing economies. Competitive dynamics are intense, characterized by both price competition and product differentiation.
Dominant Markets & Segments in Nutritional Supplements Industry
The North American region currently dominates the global nutritional supplements market, driven by high consumer awareness and spending on health and wellness products. However, Asia-Pacific is projected to witness significant growth during the forecast period, propelled by rising disposable incomes and a burgeoning middle class.
Key Drivers:
- Economic policies: Government initiatives promoting health and wellness influence consumer behavior and market growth.
- Infrastructure: Development of robust retail infrastructure, particularly in emerging markets, facilitates market expansion.
Dominant Segments:
- Type: Vitamins & minerals continue to be the largest segment, followed by herbal supplements and protein & amino acids. The prebiotics & probiotics segment is demonstrating strong growth due to increasing awareness of gut health.
- Form: Capsules and tablets remain the most prevalent forms, but gummies and powders are gaining popularity due to their convenient consumption and enhanced palatability.
- Health Application: General health supplements hold the largest market share, followed by energy & weight management and bone & joint health. The demand for specialized supplements catering to specific health concerns is growing.
- Distribution Channel: Pharmacies and drug stores continue to be the primary distribution channel, but online retail channels are rapidly expanding their reach and capturing a significant market share.
Nutritional Supplements Industry Product Developments
Recent product innovations showcase a trend towards personalized nutrition, with supplements tailored to individual genetic profiles and health needs. Technological advancements are leading to the development of more bioavailable and efficacious formulations. Furthermore, the focus on natural ingredients and sustainable sourcing practices is attracting environmentally conscious consumers. These innovations contribute to enhanced product differentiation and competitive advantage in a crowded market.
Report Scope & Segmentation Analysis
This report segments the nutritional supplements market by various parameters, including type (Vitamins & Minerals, Herbal Supplements, Proteins and Amino Acids, Fatty-acids, Prebiotics & Probiotics, Other Types), form (Tablets, Capsules, Powders, Gummies, Softgels, Liquids, Other Forms), health application (General Health, Bone & Joint Health, Energy & Weight Management, Gastrointestinal Health, Immunity, Cardiac Health, Diabetes, Skin/Hair/Nails, Other Health Applications), and distribution channel (Pharmacies and Drug Stores, Supermarkets/Hypermarkets, Online Retail Channels, Other Distribution Channels). Each segment is analyzed in detail, including growth projections, market size, and competitive dynamics. The detailed breakdown allows for focused analysis to assess potential opportunities within specific niche areas.
Key Drivers of Nutritional Supplements Industry Growth
Several factors drive the growth of the nutritional supplements industry: The increasing prevalence of chronic diseases necessitates targeted supplementation, the growing awareness of preventative health measures fuels demand, rising disposable incomes enable consumers to invest in their health, and technological advancements lead to innovative products with better efficacy and bioavailability. Government regulations and consumer advocacy groups also shape the industry's trajectory.
Challenges in the Nutritional Supplements Industry Sector
Challenges faced by the nutritional supplements industry include stringent regulations and compliance costs, the need for robust quality control and safety standards, and the potential for counterfeiting. Supply chain disruptions can impact production and availability. Intense competition and price pressures necessitate continuous innovation and product differentiation to maintain market share. These factors influence the overall market's profitability and sustainability.
Emerging Opportunities in Nutritional Supplements Industry
Emerging opportunities include the development of personalized nutrition solutions tailored to individual genetic profiles and lifestyle factors. The growth of the functional food segment offers synergistic opportunities for cross-promotion and product development. Increased investment in research and development is driving innovation and creating new product categories, further expanding the market potential.
Leading Players in the Nutritional Supplements Industry Market
- Suntory Holdings Ltd
- Amway Corporation
- Bayer AG
- Abbott Nutrition
- Glanbia PLC
- Haleon Plc
- Herbalife Nutrition
- Otsuka Holdings Co Ltd
- The Bountiful Company
- Pfizer Inc
Key Developments in Nutritional Supplements Industry Industry
- September 2022: Abbott launched a new Ensure formulation with HMB, enhancing muscle and bone strength.
- August 2022: Optimum Nutrition (Glanbia) launched its Gold Standard Protein Shake in chocolate and vanilla flavors.
- March 2022: PharmaNutrics launched five dietary supplements in the US targeting fatigue, stress, and musculoskeletal health.
Strategic Outlook for Nutritional Supplements Industry Market
The nutritional supplements market is poised for continued growth, driven by evolving consumer preferences, technological innovations, and a rising focus on preventive healthcare. Opportunities exist in personalized nutrition, functional foods, and sustainable sourcing practices. Companies that prioritize product innovation, quality control, and strategic partnerships are best positioned to succeed in this dynamic market.
Nutritional Supplements Industry Segmentation
-
1. Type
- 1.1. Vitamins & Minerals
- 1.2. Herbal Supplements
- 1.3. Proteins and Amino Acids
- 1.4. Fatty-acids
- 1.5. Prebiotics & Probiotics
- 1.6. Other Types
-
2. Form
- 2.1. Tablets
- 2.2. Capsules
- 2.3. Powders
- 2.4. Gummies
- 2.5. Softgels
- 2.6. Liquids
- 2.7. Other Forms
-
3. Health Application
- 3.1. General Health
- 3.2. Bone & Joint Health
- 3.3. Energy & Weight Management
- 3.4. Gastrointestinal Health
- 3.5. Immunity
- 3.6. Cardiac Health
- 3.7. Diabetes
- 3.8. Skin/Hair/Nails
- 3.9. Other Health Applications
-
4. Distribution Channel
- 4.1. Pharmacies and Drug Stores
- 4.2. Supermarkets/Hypermarkets
- 4.3. Online Retail Channels
- 4.4. Other Distribution Channels
Nutritional Supplements Industry Segmentation By Geography
-
1. North America
- 1.1. United States
- 1.2. Canada
- 1.3. Mexico
- 1.4. Rest of North America
-
2. Europe
- 2.1. Spain
- 2.2. United Kingdom
- 2.3. Germany
- 2.4. France
- 2.5. Italy
- 2.6. Russia
- 2.7. Rest of Europe
-
3. Asia Pacific
- 3.1. China
- 3.2. Japan
- 3.3. India
- 3.4. Australia
- 3.5. Rest of Asia Pacific
-
4. South America
- 4.1. Brazil
- 4.2. Argentina
- 4.3. Rest of South America
-
5. Middle East and Africa
- 5.1. South Africa
- 5.2. Saudi Arabia
- 5.3. Rest of Middle East and Africa
Nutritional Supplements Industry Regional Market Share
Geographic Coverage of Nutritional Supplements Industry
Nutritional Supplements Industry REPORT HIGHLIGHTS
| Aspects | Details |
|---|---|
| Study Period | 2020-2034 |
| Base Year | 2025 |
| Estimated Year | 2026 |
| Forecast Period | 2026-2034 |
| Historical Period | 2020-2025 |
| Growth Rate | CAGR of 4.50% from 2020-2034 |
| Segmentation |
|
Table of Contents
- 1. Introduction
- 1.1. Research Scope
- 1.2. Market Segmentation
- 1.3. Research Objective
- 1.4. Definitions and Assumptions
- 2. Executive Summary
- 2.1. Market Snapshot
- 3. Market Dynamics
- 3.1. Market Drivers
- 3.2. Market Restrains
- 3.3. Market Trends
- 3.4. Market Opportunities
- 4. Market Factor Analysis
- 4.1. Porters Five Forces
- 4.1.1. Bargaining Power of Suppliers
- 4.1.2. Bargaining Power of Buyers
- 4.1.3. Threat of New Entrants
- 4.1.4. Threat of Substitutes
- 4.1.5. Competitive Rivalry
- 4.2. PESTEL analysis
- 4.3. BCG Analysis
- 4.3.1. Stars (High Growth, High Market Share)
- 4.3.2. Cash Cows (Low Growth, High Market Share)
- 4.3.3. Question Mark (High Growth, Low Market Share)
- 4.3.4. Dogs (Low Growth, Low Market Share)
- 4.4. Ansoff Matrix Analysis
- 4.5. Supply Chain Analysis
- 4.6. Regulatory Landscape
- 4.7. Current Market Potential and Opportunity Assessment (TAM–SAM–SOM Framework)
- 4.8. RAX Analyst Note
- 4.1. Porters Five Forces
- 5. Market Analysis, Insights and Forecast 2021-2033
- 5.1. Market Analysis, Insights and Forecast - by Type
- 5.1.1. Vitamins & Minerals
- 5.1.2. Herbal Supplements
- 5.1.3. Proteins and Amino Acids
- 5.1.4. Fatty-acids
- 5.1.5. Prebiotics & Probiotics
- 5.1.6. Other Types
- 5.2. Market Analysis, Insights and Forecast - by Form
- 5.2.1. Tablets
- 5.2.2. Capsules
- 5.2.3. Powders
- 5.2.4. Gummies
- 5.2.5. Softgels
- 5.2.6. Liquids
- 5.2.7. Other Forms
- 5.3. Market Analysis, Insights and Forecast - by Health Application
- 5.3.1. General Health
- 5.3.2. Bone & Joint Health
- 5.3.3. Energy & Weight Management
- 5.3.4. Gastrointestinal Health
- 5.3.5. Immunity
- 5.3.6. Cardiac Health
- 5.3.7. Diabetes
- 5.3.8. Skin/Hair/Nails
- 5.3.9. Other Health Applications
- 5.4. Market Analysis, Insights and Forecast - by Distribution Channel
- 5.4.1. Pharmacies and Drug Stores
- 5.4.2. Supermarkets/Hypermarkets
- 5.4.3. Online Retail Channels
- 5.4.4. Other Distribution Channels
- 5.5. Market Analysis, Insights and Forecast - by Region
- 5.5.1. North America
- 5.5.2. Europe
- 5.5.3. Asia Pacific
- 5.5.4. South America
- 5.5.5. Middle East and Africa
- 5.1. Market Analysis, Insights and Forecast - by Type
- 6. Global Nutritional Supplements Industry Analysis, Insights and Forecast, 2021-2033
- 6.1. Market Analysis, Insights and Forecast - by Type
- 6.1.1. Vitamins & Minerals
- 6.1.2. Herbal Supplements
- 6.1.3. Proteins and Amino Acids
- 6.1.4. Fatty-acids
- 6.1.5. Prebiotics & Probiotics
- 6.1.6. Other Types
- 6.2. Market Analysis, Insights and Forecast - by Form
- 6.2.1. Tablets
- 6.2.2. Capsules
- 6.2.3. Powders
- 6.2.4. Gummies
- 6.2.5. Softgels
- 6.2.6. Liquids
- 6.2.7. Other Forms
- 6.3. Market Analysis, Insights and Forecast - by Health Application
- 6.3.1. General Health
- 6.3.2. Bone & Joint Health
- 6.3.3. Energy & Weight Management
- 6.3.4. Gastrointestinal Health
- 6.3.5. Immunity
- 6.3.6. Cardiac Health
- 6.3.7. Diabetes
- 6.3.8. Skin/Hair/Nails
- 6.3.9. Other Health Applications
- 6.4. Market Analysis, Insights and Forecast - by Distribution Channel
- 6.4.1. Pharmacies and Drug Stores
- 6.4.2. Supermarkets/Hypermarkets
- 6.4.3. Online Retail Channels
- 6.4.4. Other Distribution Channels
- 6.1. Market Analysis, Insights and Forecast - by Type
- 7. North America Nutritional Supplements Industry Analysis, Insights and Forecast, 2020-2032
- 7.1. Market Analysis, Insights and Forecast - by Type
- 7.1.1. Vitamins & Minerals
- 7.1.2. Herbal Supplements
- 7.1.3. Proteins and Amino Acids
- 7.1.4. Fatty-acids
- 7.1.5. Prebiotics & Probiotics
- 7.1.6. Other Types
- 7.2. Market Analysis, Insights and Forecast - by Form
- 7.2.1. Tablets
- 7.2.2. Capsules
- 7.2.3. Powders
- 7.2.4. Gummies
- 7.2.5. Softgels
- 7.2.6. Liquids
- 7.2.7. Other Forms
- 7.3. Market Analysis, Insights and Forecast - by Health Application
- 7.3.1. General Health
- 7.3.2. Bone & Joint Health
- 7.3.3. Energy & Weight Management
- 7.3.4. Gastrointestinal Health
- 7.3.5. Immunity
- 7.3.6. Cardiac Health
- 7.3.7. Diabetes
- 7.3.8. Skin/Hair/Nails
- 7.3.9. Other Health Applications
- 7.4. Market Analysis, Insights and Forecast - by Distribution Channel
- 7.4.1. Pharmacies and Drug Stores
- 7.4.2. Supermarkets/Hypermarkets
- 7.4.3. Online Retail Channels
- 7.4.4. Other Distribution Channels
- 7.1. Market Analysis, Insights and Forecast - by Type
- 8. Europe Nutritional Supplements Industry Analysis, Insights and Forecast, 2020-2032
- 8.1. Market Analysis, Insights and Forecast - by Type
- 8.1.1. Vitamins & Minerals
- 8.1.2. Herbal Supplements
- 8.1.3. Proteins and Amino Acids
- 8.1.4. Fatty-acids
- 8.1.5. Prebiotics & Probiotics
- 8.1.6. Other Types
- 8.2. Market Analysis, Insights and Forecast - by Form
- 8.2.1. Tablets
- 8.2.2. Capsules
- 8.2.3. Powders
- 8.2.4. Gummies
- 8.2.5. Softgels
- 8.2.6. Liquids
- 8.2.7. Other Forms
- 8.3. Market Analysis, Insights and Forecast - by Health Application
- 8.3.1. General Health
- 8.3.2. Bone & Joint Health
- 8.3.3. Energy & Weight Management
- 8.3.4. Gastrointestinal Health
- 8.3.5. Immunity
- 8.3.6. Cardiac Health
- 8.3.7. Diabetes
- 8.3.8. Skin/Hair/Nails
- 8.3.9. Other Health Applications
- 8.4. Market Analysis, Insights and Forecast - by Distribution Channel
- 8.4.1. Pharmacies and Drug Stores
- 8.4.2. Supermarkets/Hypermarkets
- 8.4.3. Online Retail Channels
- 8.4.4. Other Distribution Channels
- 8.1. Market Analysis, Insights and Forecast - by Type
- 9. Asia Pacific Nutritional Supplements Industry Analysis, Insights and Forecast, 2020-2032
- 9.1. Market Analysis, Insights and Forecast - by Type
- 9.1.1. Vitamins & Minerals
- 9.1.2. Herbal Supplements
- 9.1.3. Proteins and Amino Acids
- 9.1.4. Fatty-acids
- 9.1.5. Prebiotics & Probiotics
- 9.1.6. Other Types
- 9.2. Market Analysis, Insights and Forecast - by Form
- 9.2.1. Tablets
- 9.2.2. Capsules
- 9.2.3. Powders
- 9.2.4. Gummies
- 9.2.5. Softgels
- 9.2.6. Liquids
- 9.2.7. Other Forms
- 9.3. Market Analysis, Insights and Forecast - by Health Application
- 9.3.1. General Health
- 9.3.2. Bone & Joint Health
- 9.3.3. Energy & Weight Management
- 9.3.4. Gastrointestinal Health
- 9.3.5. Immunity
- 9.3.6. Cardiac Health
- 9.3.7. Diabetes
- 9.3.8. Skin/Hair/Nails
- 9.3.9. Other Health Applications
- 9.4. Market Analysis, Insights and Forecast - by Distribution Channel
- 9.4.1. Pharmacies and Drug Stores
- 9.4.2. Supermarkets/Hypermarkets
- 9.4.3. Online Retail Channels
- 9.4.4. Other Distribution Channels
- 9.1. Market Analysis, Insights and Forecast - by Type
- 10. South America Nutritional Supplements Industry Analysis, Insights and Forecast, 2020-2032
- 10.1. Market Analysis, Insights and Forecast - by Type
- 10.1.1. Vitamins & Minerals
- 10.1.2. Herbal Supplements
- 10.1.3. Proteins and Amino Acids
- 10.1.4. Fatty-acids
- 10.1.5. Prebiotics & Probiotics
- 10.1.6. Other Types
- 10.2. Market Analysis, Insights and Forecast - by Form
- 10.2.1. Tablets
- 10.2.2. Capsules
- 10.2.3. Powders
- 10.2.4. Gummies
- 10.2.5. Softgels
- 10.2.6. Liquids
- 10.2.7. Other Forms
- 10.3. Market Analysis, Insights and Forecast - by Health Application
- 10.3.1. General Health
- 10.3.2. Bone & Joint Health
- 10.3.3. Energy & Weight Management
- 10.3.4. Gastrointestinal Health
- 10.3.5. Immunity
- 10.3.6. Cardiac Health
- 10.3.7. Diabetes
- 10.3.8. Skin/Hair/Nails
- 10.3.9. Other Health Applications
- 10.4. Market Analysis, Insights and Forecast - by Distribution Channel
- 10.4.1. Pharmacies and Drug Stores
- 10.4.2. Supermarkets/Hypermarkets
- 10.4.3. Online Retail Channels
- 10.4.4. Other Distribution Channels
- 10.1. Market Analysis, Insights and Forecast - by Type
- 11. Middle East and Africa Nutritional Supplements Industry Analysis, Insights and Forecast, 2020-2032
- 11.1. Market Analysis, Insights and Forecast - by Type
- 11.1.1. Vitamins & Minerals
- 11.1.2. Herbal Supplements
- 11.1.3. Proteins and Amino Acids
- 11.1.4. Fatty-acids
- 11.1.5. Prebiotics & Probiotics
- 11.1.6. Other Types
- 11.2. Market Analysis, Insights and Forecast - by Form
- 11.2.1. Tablets
- 11.2.2. Capsules
- 11.2.3. Powders
- 11.2.4. Gummies
- 11.2.5. Softgels
- 11.2.6. Liquids
- 11.2.7. Other Forms
- 11.3. Market Analysis, Insights and Forecast - by Health Application
- 11.3.1. General Health
- 11.3.2. Bone & Joint Health
- 11.3.3. Energy & Weight Management
- 11.3.4. Gastrointestinal Health
- 11.3.5. Immunity
- 11.3.6. Cardiac Health
- 11.3.7. Diabetes
- 11.3.8. Skin/Hair/Nails
- 11.3.9. Other Health Applications
- 11.4. Market Analysis, Insights and Forecast - by Distribution Channel
- 11.4.1. Pharmacies and Drug Stores
- 11.4.2. Supermarkets/Hypermarkets
- 11.4.3. Online Retail Channels
- 11.4.4. Other Distribution Channels
- 11.1. Market Analysis, Insights and Forecast - by Type
- 12. Competitive Analysis
- 12.1. Company Profiles
- 12.1.1 Suntory Holdings Ltd
- 12.1.1.1. Company Overview
- 12.1.1.2. Products
- 12.1.1.3. Company Financials
- 12.1.1.4. SWOT Analysis
- 12.1.2 Amway Corporation
- 12.1.2.1. Company Overview
- 12.1.2.2. Products
- 12.1.2.3. Company Financials
- 12.1.2.4. SWOT Analysis
- 12.1.3 Bayer AG
- 12.1.3.1. Company Overview
- 12.1.3.2. Products
- 12.1.3.3. Company Financials
- 12.1.3.4. SWOT Analysis
- 12.1.4 Abbott Nutrition
- 12.1.4.1. Company Overview
- 12.1.4.2. Products
- 12.1.4.3. Company Financials
- 12.1.4.4. SWOT Analysis
- 12.1.5 Glanbia PLC
- 12.1.5.1. Company Overview
- 12.1.5.2. Products
- 12.1.5.3. Company Financials
- 12.1.5.4. SWOT Analysis
- 12.1.6 Haleon Plc
- 12.1.6.1. Company Overview
- 12.1.6.2. Products
- 12.1.6.3. Company Financials
- 12.1.6.4. SWOT Analysis
- 12.1.7 Herbalife Nutrition
- 12.1.7.1. Company Overview
- 12.1.7.2. Products
- 12.1.7.3. Company Financials
- 12.1.7.4. SWOT Analysis
- 12.1.8 Otsuka Holdings Co Ltd
- 12.1.8.1. Company Overview
- 12.1.8.2. Products
- 12.1.8.3. Company Financials
- 12.1.8.4. SWOT Analysis
- 12.1.9 The Bountiful Company*List Not Exhaustive
- 12.1.9.1. Company Overview
- 12.1.9.2. Products
- 12.1.9.3. Company Financials
- 12.1.9.4. SWOT Analysis
- 12.1.10 Pfizer Inc
- 12.1.10.1. Company Overview
- 12.1.10.2. Products
- 12.1.10.3. Company Financials
- 12.1.10.4. SWOT Analysis
- 12.1.1 Suntory Holdings Ltd
- 12.2. Market Entropy
- 12.2.1 Company's Key Areas Served
- 12.2.2 Recent Developments
- 12.3. Company Market Share Analysis 2025
- 12.3.1 Top 5 Companies Market Share Analysis
- 12.3.2 Top 3 Companies Market Share Analysis
- 12.4. List of Potential Customers
- 13. Research Methodology
List of Figures
- Figure 1: Global Nutritional Supplements Industry Revenue Breakdown (Million, %) by Region 2025 & 2033
- Figure 2: North America Nutritional Supplements Industry Revenue (Million), by Type 2025 & 2033
- Figure 3: North America Nutritional Supplements Industry Revenue Share (%), by Type 2025 & 2033
- Figure 4: North America Nutritional Supplements Industry Revenue (Million), by Form 2025 & 2033
- Figure 5: North America Nutritional Supplements Industry Revenue Share (%), by Form 2025 & 2033
- Figure 6: North America Nutritional Supplements Industry Revenue (Million), by Health Application 2025 & 2033
- Figure 7: North America Nutritional Supplements Industry Revenue Share (%), by Health Application 2025 & 2033
- Figure 8: North America Nutritional Supplements Industry Revenue (Million), by Distribution Channel 2025 & 2033
- Figure 9: North America Nutritional Supplements Industry Revenue Share (%), by Distribution Channel 2025 & 2033
- Figure 10: North America Nutritional Supplements Industry Revenue (Million), by Country 2025 & 2033
- Figure 11: North America Nutritional Supplements Industry Revenue Share (%), by Country 2025 & 2033
- Figure 12: Europe Nutritional Supplements Industry Revenue (Million), by Type 2025 & 2033
- Figure 13: Europe Nutritional Supplements Industry Revenue Share (%), by Type 2025 & 2033
- Figure 14: Europe Nutritional Supplements Industry Revenue (Million), by Form 2025 & 2033
- Figure 15: Europe Nutritional Supplements Industry Revenue Share (%), by Form 2025 & 2033
- Figure 16: Europe Nutritional Supplements Industry Revenue (Million), by Health Application 2025 & 2033
- Figure 17: Europe Nutritional Supplements Industry Revenue Share (%), by Health Application 2025 & 2033
- Figure 18: Europe Nutritional Supplements Industry Revenue (Million), by Distribution Channel 2025 & 2033
- Figure 19: Europe Nutritional Supplements Industry Revenue Share (%), by Distribution Channel 2025 & 2033
- Figure 20: Europe Nutritional Supplements Industry Revenue (Million), by Country 2025 & 2033
- Figure 21: Europe Nutritional Supplements Industry Revenue Share (%), by Country 2025 & 2033
- Figure 22: Asia Pacific Nutritional Supplements Industry Revenue (Million), by Type 2025 & 2033
- Figure 23: Asia Pacific Nutritional Supplements Industry Revenue Share (%), by Type 2025 & 2033
- Figure 24: Asia Pacific Nutritional Supplements Industry Revenue (Million), by Form 2025 & 2033
- Figure 25: Asia Pacific Nutritional Supplements Industry Revenue Share (%), by Form 2025 & 2033
- Figure 26: Asia Pacific Nutritional Supplements Industry Revenue (Million), by Health Application 2025 & 2033
- Figure 27: Asia Pacific Nutritional Supplements Industry Revenue Share (%), by Health Application 2025 & 2033
- Figure 28: Asia Pacific Nutritional Supplements Industry Revenue (Million), by Distribution Channel 2025 & 2033
- Figure 29: Asia Pacific Nutritional Supplements Industry Revenue Share (%), by Distribution Channel 2025 & 2033
- Figure 30: Asia Pacific Nutritional Supplements Industry Revenue (Million), by Country 2025 & 2033
- Figure 31: Asia Pacific Nutritional Supplements Industry Revenue Share (%), by Country 2025 & 2033
- Figure 32: South America Nutritional Supplements Industry Revenue (Million), by Type 2025 & 2033
- Figure 33: South America Nutritional Supplements Industry Revenue Share (%), by Type 2025 & 2033
- Figure 34: South America Nutritional Supplements Industry Revenue (Million), by Form 2025 & 2033
- Figure 35: South America Nutritional Supplements Industry Revenue Share (%), by Form 2025 & 2033
- Figure 36: South America Nutritional Supplements Industry Revenue (Million), by Health Application 2025 & 2033
- Figure 37: South America Nutritional Supplements Industry Revenue Share (%), by Health Application 2025 & 2033
- Figure 38: South America Nutritional Supplements Industry Revenue (Million), by Distribution Channel 2025 & 2033
- Figure 39: South America Nutritional Supplements Industry Revenue Share (%), by Distribution Channel 2025 & 2033
- Figure 40: South America Nutritional Supplements Industry Revenue (Million), by Country 2025 & 2033
- Figure 41: South America Nutritional Supplements Industry Revenue Share (%), by Country 2025 & 2033
- Figure 42: Middle East and Africa Nutritional Supplements Industry Revenue (Million), by Type 2025 & 2033
- Figure 43: Middle East and Africa Nutritional Supplements Industry Revenue Share (%), by Type 2025 & 2033
- Figure 44: Middle East and Africa Nutritional Supplements Industry Revenue (Million), by Form 2025 & 2033
- Figure 45: Middle East and Africa Nutritional Supplements Industry Revenue Share (%), by Form 2025 & 2033
- Figure 46: Middle East and Africa Nutritional Supplements Industry Revenue (Million), by Health Application 2025 & 2033
- Figure 47: Middle East and Africa Nutritional Supplements Industry Revenue Share (%), by Health Application 2025 & 2033
- Figure 48: Middle East and Africa Nutritional Supplements Industry Revenue (Million), by Distribution Channel 2025 & 2033
- Figure 49: Middle East and Africa Nutritional Supplements Industry Revenue Share (%), by Distribution Channel 2025 & 2033
- Figure 50: Middle East and Africa Nutritional Supplements Industry Revenue (Million), by Country 2025 & 2033
- Figure 51: Middle East and Africa Nutritional Supplements Industry Revenue Share (%), by Country 2025 & 2033
List of Tables
- Table 1: Global Nutritional Supplements Industry Revenue Million Forecast, by Type 2020 & 2033
- Table 2: Global Nutritional Supplements Industry Revenue Million Forecast, by Form 2020 & 2033
- Table 3: Global Nutritional Supplements Industry Revenue Million Forecast, by Health Application 2020 & 2033
- Table 4: Global Nutritional Supplements Industry Revenue Million Forecast, by Distribution Channel 2020 & 2033
- Table 5: Global Nutritional Supplements Industry Revenue Million Forecast, by Region 2020 & 2033
- Table 6: Global Nutritional Supplements Industry Revenue Million Forecast, by Type 2020 & 2033
- Table 7: Global Nutritional Supplements Industry Revenue Million Forecast, by Form 2020 & 2033
- Table 8: Global Nutritional Supplements Industry Revenue Million Forecast, by Health Application 2020 & 2033
- Table 9: Global Nutritional Supplements Industry Revenue Million Forecast, by Distribution Channel 2020 & 2033
- Table 10: Global Nutritional Supplements Industry Revenue Million Forecast, by Country 2020 & 2033
- Table 11: United States Nutritional Supplements Industry Revenue (Million) Forecast, by Application 2020 & 2033
- Table 12: Canada Nutritional Supplements Industry Revenue (Million) Forecast, by Application 2020 & 2033
- Table 13: Mexico Nutritional Supplements Industry Revenue (Million) Forecast, by Application 2020 & 2033
- Table 14: Rest of North America Nutritional Supplements Industry Revenue (Million) Forecast, by Application 2020 & 2033
- Table 15: Global Nutritional Supplements Industry Revenue Million Forecast, by Type 2020 & 2033
- Table 16: Global Nutritional Supplements Industry Revenue Million Forecast, by Form 2020 & 2033
- Table 17: Global Nutritional Supplements Industry Revenue Million Forecast, by Health Application 2020 & 2033
- Table 18: Global Nutritional Supplements Industry Revenue Million Forecast, by Distribution Channel 2020 & 2033
- Table 19: Global Nutritional Supplements Industry Revenue Million Forecast, by Country 2020 & 2033
- Table 20: Spain Nutritional Supplements Industry Revenue (Million) Forecast, by Application 2020 & 2033
- Table 21: United Kingdom Nutritional Supplements Industry Revenue (Million) Forecast, by Application 2020 & 2033
- Table 22: Germany Nutritional Supplements Industry Revenue (Million) Forecast, by Application 2020 & 2033
- Table 23: France Nutritional Supplements Industry Revenue (Million) Forecast, by Application 2020 & 2033
- Table 24: Italy Nutritional Supplements Industry Revenue (Million) Forecast, by Application 2020 & 2033
- Table 25: Russia Nutritional Supplements Industry Revenue (Million) Forecast, by Application 2020 & 2033
- Table 26: Rest of Europe Nutritional Supplements Industry Revenue (Million) Forecast, by Application 2020 & 2033
- Table 27: Global Nutritional Supplements Industry Revenue Million Forecast, by Type 2020 & 2033
- Table 28: Global Nutritional Supplements Industry Revenue Million Forecast, by Form 2020 & 2033
- Table 29: Global Nutritional Supplements Industry Revenue Million Forecast, by Health Application 2020 & 2033
- Table 30: Global Nutritional Supplements Industry Revenue Million Forecast, by Distribution Channel 2020 & 2033
- Table 31: Global Nutritional Supplements Industry Revenue Million Forecast, by Country 2020 & 2033
- Table 32: China Nutritional Supplements Industry Revenue (Million) Forecast, by Application 2020 & 2033
- Table 33: Japan Nutritional Supplements Industry Revenue (Million) Forecast, by Application 2020 & 2033
- Table 34: India Nutritional Supplements Industry Revenue (Million) Forecast, by Application 2020 & 2033
- Table 35: Australia Nutritional Supplements Industry Revenue (Million) Forecast, by Application 2020 & 2033
- Table 36: Rest of Asia Pacific Nutritional Supplements Industry Revenue (Million) Forecast, by Application 2020 & 2033
- Table 37: Global Nutritional Supplements Industry Revenue Million Forecast, by Type 2020 & 2033
- Table 38: Global Nutritional Supplements Industry Revenue Million Forecast, by Form 2020 & 2033
- Table 39: Global Nutritional Supplements Industry Revenue Million Forecast, by Health Application 2020 & 2033
- Table 40: Global Nutritional Supplements Industry Revenue Million Forecast, by Distribution Channel 2020 & 2033
- Table 41: Global Nutritional Supplements Industry Revenue Million Forecast, by Country 2020 & 2033
- Table 42: Brazil Nutritional Supplements Industry Revenue (Million) Forecast, by Application 2020 & 2033
- Table 43: Argentina Nutritional Supplements Industry Revenue (Million) Forecast, by Application 2020 & 2033
- Table 44: Rest of South America Nutritional Supplements Industry Revenue (Million) Forecast, by Application 2020 & 2033
- Table 45: Global Nutritional Supplements Industry Revenue Million Forecast, by Type 2020 & 2033
- Table 46: Global Nutritional Supplements Industry Revenue Million Forecast, by Form 2020 & 2033
- Table 47: Global Nutritional Supplements Industry Revenue Million Forecast, by Health Application 2020 & 2033
- Table 48: Global Nutritional Supplements Industry Revenue Million Forecast, by Distribution Channel 2020 & 2033
- Table 49: Global Nutritional Supplements Industry Revenue Million Forecast, by Country 2020 & 2033
- Table 50: South Africa Nutritional Supplements Industry Revenue (Million) Forecast, by Application 2020 & 2033
- Table 51: Saudi Arabia Nutritional Supplements Industry Revenue (Million) Forecast, by Application 2020 & 2033
- Table 52: Rest of Middle East and Africa Nutritional Supplements Industry Revenue (Million) Forecast, by Application 2020 & 2033
Frequently Asked Questions
1. What is the projected Compound Annual Growth Rate (CAGR) of the Nutritional Supplements Industry?
The projected CAGR is approximately 4.50%.
2. Which companies are prominent players in the Nutritional Supplements Industry?
Key companies in the market include Suntory Holdings Ltd, Amway Corporation, Bayer AG, Abbott Nutrition, Glanbia PLC, Haleon Plc, Herbalife Nutrition, Otsuka Holdings Co Ltd, The Bountiful Company*List Not Exhaustive, Pfizer Inc.
3. What are the main segments of the Nutritional Supplements Industry?
The market segments include Type, Form, Health Application, Distribution Channel.
4. Can you provide details about the market size?
The market size is estimated to be USD 139.38 Million as of 2022.
5. What are some drivers contributing to market growth?
Popularity of Convenient and On the Go Snacking Options; Product Differentiation Playing a Key Role in Market Expansion.
6. What are the notable trends driving market growth?
Escalating Consumer Investment In Preventive Healthcare Products.
7. Are there any restraints impacting market growth?
Associated Health Risks; Easy Availability of Healthy Substitutes.
8. Can you provide examples of recent developments in the market?
September 2022: Abbott launched a brand-new Ensure formulation with HMB. As a science-based nutritional supplement, the new Ensure contains 32 essential nutrients such as protein, calcium, and vitamin D to help improve muscle and bone strength. It contains HMB or hydroxy-methyl butyrate, a new ingredient that helps counteract muscle loss and increases the strength and power of the body.
9. What pricing options are available for accessing the report?
Pricing options include single-user, multi-user, and enterprise licenses priced at USD 4750, USD 5250, and USD 8750 respectively.
10. Is the market size provided in terms of value or volume?
The market size is provided in terms of value, measured in Million.
11. Are there any specific market keywords associated with the report?
Yes, the market keyword associated with the report is "Nutritional Supplements Industry," which aids in identifying and referencing the specific market segment covered.
12. How do I determine which pricing option suits my needs best?
The pricing options vary based on user requirements and access needs. Individual users may opt for single-user licenses, while businesses requiring broader access may choose multi-user or enterprise licenses for cost-effective access to the report.
13. Are there any additional resources or data provided in the Nutritional Supplements Industry report?
While the report offers comprehensive insights, it's advisable to review the specific contents or supplementary materials provided to ascertain if additional resources or data are available.
14. How can I stay updated on further developments or reports in the Nutritional Supplements Industry?
To stay informed about further developments, trends, and reports in the Nutritional Supplements Industry, consider subscribing to industry newsletters, following relevant companies and organizations, or regularly checking reputable industry news sources and publications.
Methodology
Step 1 - Identification of Relevant Samples Size from Population Database


Step 2 - Approaches for Defining Global Market Size (Value, Volume* & Price*)

Note*: In applicable scenarios
Step 3 - Data Sources
Primary Research
- Web Analytics
- Survey Reports
- Research Institute
- Latest Research Reports
- Opinion Leaders
Secondary Research
- Annual Reports
- White Paper
- Latest Press Release
- Industry Association
- Paid Database
- Investor Presentations

Step 4 - Data Triangulation
Involves using different sources of information in order to increase the validity of a study
These sources are likely to be stakeholders in a program - participants, other researchers, program staff, other community members, and so on.
Then we put all data in single framework & apply various statistical tools to find out the dynamic on the market.
During the analysis stage, feedback from the stakeholder groups would be compared to determine areas of agreement as well as areas of divergence

