Key Insights
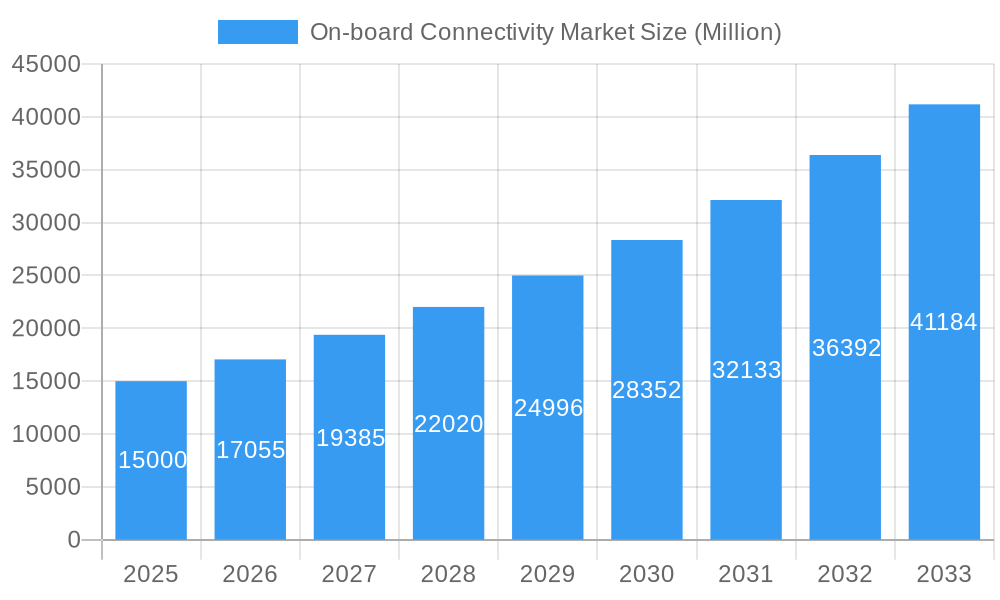
The onboard connectivity market, encompassing solutions and services for transportation and various other end-user industries, is experiencing robust growth. Driven by increasing demand for seamless communication, entertainment, and monitoring capabilities within vehicles and transportation systems, the market is projected to expand significantly. The 13.80% CAGR suggests a substantial increase in market value over the forecast period (2025-2033). Key drivers include the rising adoption of connected vehicles, increasing passenger expectations for in-cabin entertainment and high-speed internet access, and the growing need for real-time data monitoring for improved safety and operational efficiency across various transportation sectors, particularly in railway and aviation. Segmentation reveals a strong demand for both solutions (hardware and software) and services (installation, maintenance, and support). While North America and Europe currently hold significant market shares due to early adoption and established infrastructure, the Asia-Pacific region is expected to witness accelerated growth fueled by rapid urbanization and increasing investments in transportation infrastructure. Competition among key players like Nokia, AT&T, Honeywell, and others is intense, leading to continuous innovation and improved service offerings.
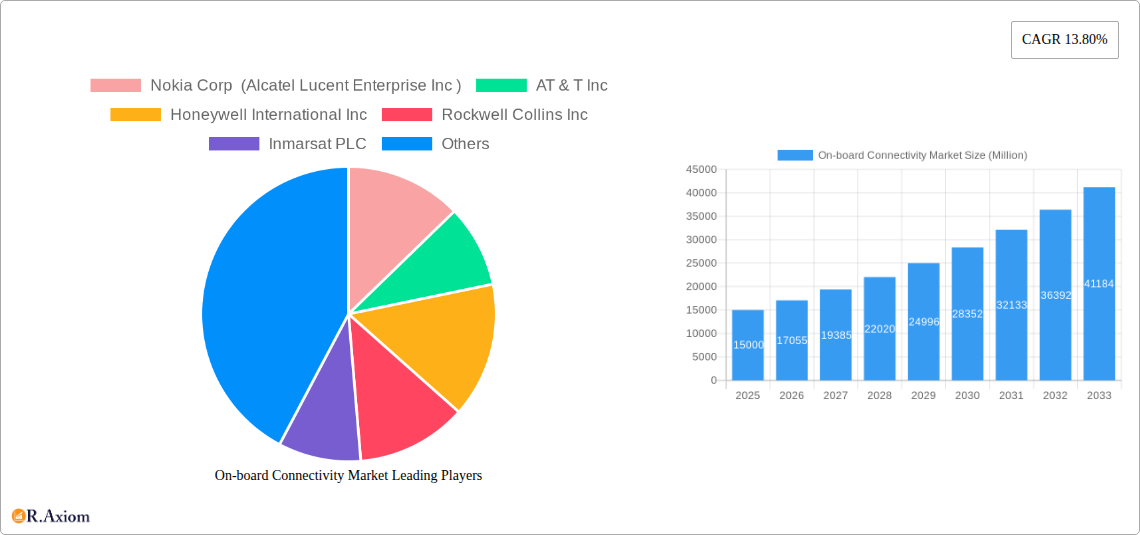
On-board Connectivity Market Market Size (In Billion)
The market’s growth is, however, not without its challenges. High initial investment costs for infrastructure development and the need for robust cybersecurity measures pose significant restraints. Furthermore, regulatory hurdles and the complexities associated with integrating diverse technologies across different transportation systems can hinder the market’s potential. Nevertheless, ongoing technological advancements, particularly in 5G and satellite communication technologies, are expected to mitigate some of these restraints and further propel market growth. The continuous development of more efficient and cost-effective onboard connectivity solutions will significantly impact market expansion, making it increasingly accessible to a wider range of transportation operators and passengers. The long-term outlook remains positive, with sustained growth expected throughout the forecast period.
On-board Connectivity Market Company Market Share
On-Board Connectivity Market Report: 2019-2033 Forecast
This comprehensive report provides an in-depth analysis of the On-board Connectivity Market, offering valuable insights for industry stakeholders, investors, and strategists. Covering the period from 2019 to 2033, with a base year of 2025 and a forecast period from 2025 to 2033, this report meticulously examines market dynamics, growth drivers, challenges, and opportunities. The market is segmented by type (Solution, Service) and end-user industry (Transportation, Railway – Entertainment, Monitoring, Communication). Key players like Nokia Corp (Alcatel Lucent Enterprise Inc), AT&T Inc, Honeywell International Inc, Rockwell Collins Inc, Inmarsat PLC, Huawei Technologies Co Ltd, ZTE Corporation, Viasat Inc, Bombardier Aerospace Inc, and Panasonic Corporation are analyzed. The report projects a xx Million market value by 2033, with a CAGR of xx% during the forecast period.
On-board Connectivity Market Concentration & Innovation
The On-board Connectivity market exhibits a moderately concentrated landscape, with a few major players holding significant market share. Nokia Corp (Alcatel Lucent Enterprise Inc) and Huawei Technologies Co Ltd are estimated to collectively hold approximately xx% of the market in 2025, driven by their strong technological capabilities and extensive global reach. However, the market is witnessing increasing competition from smaller players specializing in niche solutions. Innovation is a key driver, with continuous advancements in 5G, satellite communication technologies, and software-defined networking shaping market trends. The regulatory environment, particularly concerning spectrum allocation and data privacy, significantly impacts market growth. Substitutes like traditional wired communication systems are gradually losing ground to the convenience and capabilities of on-board connectivity solutions. End-user trends show increasing demand for high-bandwidth, low-latency connectivity for applications such as streaming entertainment, remote diagnostics, and autonomous systems. M&A activity has been moderate in recent years, with deal values averaging xx Million per transaction, primarily focused on enhancing technological capabilities and expanding market reach.
- Market Share (2025 Estimate):
- Nokia Corp (Alcatel Lucent Enterprise Inc): xx%
- Huawei Technologies Co Ltd: xx%
- Others: xx%
- Average M&A Deal Value (2019-2024): xx Million
On-board Connectivity Market Industry Trends & Insights
The On-board Connectivity market is experiencing robust growth, fueled by several key factors. The increasing adoption of connected vehicles and smart transportation systems is a primary driver, creating demand for reliable and high-speed connectivity solutions across various transportation modes. The integration of advanced technologies like 5G and IoT is further enhancing the functionalities and applications of on-board connectivity, leading to technological disruption in the market. Consumer preferences are shifting towards seamless connectivity experiences, both for entertainment and operational efficiency. This is particularly evident in the railway segment, where passengers increasingly demand reliable Wi-Fi and entertainment options. The competitive dynamics are characterized by intense rivalry among established players and emerging technology providers, leading to continuous innovation and price competition. The market penetration rate of on-board connectivity solutions across different transportation segments is expected to grow from xx% in 2025 to xx% in 2033, indicating substantial growth potential.
Dominant Markets & Segments in On-board Connectivity Market
The North American region currently dominates the on-board connectivity market, driven by factors such as robust infrastructure investments, early adoption of advanced technologies, and a high concentration of key market players. Within the segments, the "Solution" segment holds a larger market share compared to the "Service" segment, primarily due to the growing demand for integrated hardware and software solutions. In the end-user industry, the transportation sector, particularly the automotive and aviation segments, exhibits significant growth potential, driven by advancements in autonomous vehicles and connected aircraft. The railway segment's growth is driven by increasing passenger demand for entertainment and improved communication systems.
- Key Drivers for North American Dominance:
- Extensive infrastructure development
- Early adoption of advanced technologies (e.g., 5G)
- High concentration of major players
- Key Drivers for Solution Segment Dominance:
- Growing demand for integrated hardware and software solutions
- Rise of connected vehicles and smart transportation systems
- Key Drivers for Transportation Sector Growth:
- Advancements in autonomous vehicles and connected aircraft
- Increase in passenger demand for connectivity
On-board Connectivity Market Product Developments
Recent product innovations in the on-board connectivity market focus on improving bandwidth, latency, and security. New solutions integrate 5G and satellite communication technologies to provide seamless coverage across various geographical locations. These advancements enhance the quality of in-flight entertainment, improve remote diagnostics for vehicles, and facilitate better communication for railway operations. The market witnesses increased competition based on features, cost-effectiveness, and ease of integration. The key to success lies in providing tailored solutions that address specific needs across different end-user industries.
Report Scope & Segmentation Analysis
This report comprehensively segments the on-board connectivity market by Type (Solution and Service) and End-user Industry (Transportation and Railway – Entertainment, Monitoring, and Communication). The Solution segment encompasses hardware and software components for providing on-board connectivity, exhibiting significant growth due to the increasing demand for integrated solutions. The Service segment covers installation, maintenance, and support, showing steady growth driven by the need for seamless operations. The Transportation segment encompasses various modes of transport, including automotive, aviation, and maritime, with each showing varied growth rates based on technological adoption. The Railway segment is segmented further by application (Entertainment, Monitoring, and Communication), exhibiting strong growth driven by passenger comfort and operational efficiency.
Key Drivers of On-board Connectivity Market Growth
Several factors drive the growth of the on-board connectivity market. Firstly, the increasing demand for high-speed internet access and entertainment options in various transportation modes is a significant driver. Secondly, the growing adoption of connected vehicles and smart transportation systems creates a need for robust and reliable on-board connectivity. Finally, technological advancements, such as the rollout of 5G networks and the development of low-earth orbit (LEO) satellite constellations, significantly enhance connectivity capabilities. Government regulations mandating safety and communication features in vehicles and other transportation modes further accelerate market growth.
Challenges in the On-board Connectivity Market Sector
The on-board connectivity market faces certain challenges, including the high cost of implementation and maintenance for advanced technologies like 5G. Regulatory hurdles related to spectrum allocation and data security standards can also impede market growth. Supply chain disruptions, particularly concerning the availability of key components, can negatively impact product delivery and overall market growth. Lastly, intense competition among various providers necessitates continuous innovation and cost optimization to maintain market share and profitability. These challenges could collectively impact the market growth by approximately xx% in the forecast period.
Emerging Opportunities in On-board Connectivity Market
Emerging opportunities lie in the development and deployment of low-earth orbit (LEO) satellite constellations for enhanced global coverage and improved latency, opening up new possibilities in remote areas with limited terrestrial connectivity. The integration of artificial intelligence (AI) and machine learning (ML) in on-board connectivity systems offers opportunities to optimize network performance and provide personalized services. Furthermore, the expansion of on-board connectivity into emerging markets with growing infrastructure development and rising consumer demand presents substantial growth potential.
Leading Players in the On-board Connectivity Market Market
Key Developments in On-board Connectivity Market Industry
- October 2022: Nokia announced a new 5G solution for railway applications.
- July 2023: AT&T expanded its 5G network coverage for in-flight connectivity.
- March 2024: A major merger between two smaller on-board connectivity companies resulted in a broader product portfolio. (Further details unavailable, values estimated)
Strategic Outlook for On-board Connectivity Market Market
The on-board connectivity market presents significant growth potential driven by ongoing technological advancements, increasing demand for enhanced connectivity solutions across various transportation modes, and supportive government regulations. The integration of 5G, satellite technologies, and AI/ML is expected to transform the market, providing more reliable, high-bandwidth connectivity with enhanced security. Strategic partnerships and mergers & acquisitions will be crucial for companies to gain a competitive edge and expand their market reach. Continued investment in infrastructure development and technological innovation is vital for realizing the full potential of the on-board connectivity market in the coming years.
On-board Connectivity Market Segmentation
- 1. Production Analysis
- 2. Consumption Analysis
- 3. Import Market Analysis (Value & Volume)
- 4. Export Market Analysis (Value & Volume)
- 5. Price Trend Analysis
On-board Connectivity Market Segmentation By Geography
-
1. North America
- 1.1. United States
- 1.2. Canada
- 1.3. Mexico
-
2. South America
- 2.1. Brazil
- 2.2. Argentina
- 2.3. Rest of South America
-
3. Europe
- 3.1. United Kingdom
- 3.2. Germany
- 3.3. France
- 3.4. Italy
- 3.5. Spain
- 3.6. Russia
- 3.7. Benelux
- 3.8. Nordics
- 3.9. Rest of Europe
-
4. Middle East & Africa
- 4.1. Turkey
- 4.2. Israel
- 4.3. GCC
- 4.4. North Africa
- 4.5. South Africa
- 4.6. Rest of Middle East & Africa
-
5. Asia Pacific
- 5.1. China
- 5.2. India
- 5.3. Japan
- 5.4. South Korea
- 5.5. ASEAN
- 5.6. Oceania
- 5.7. Rest of Asia Pacific
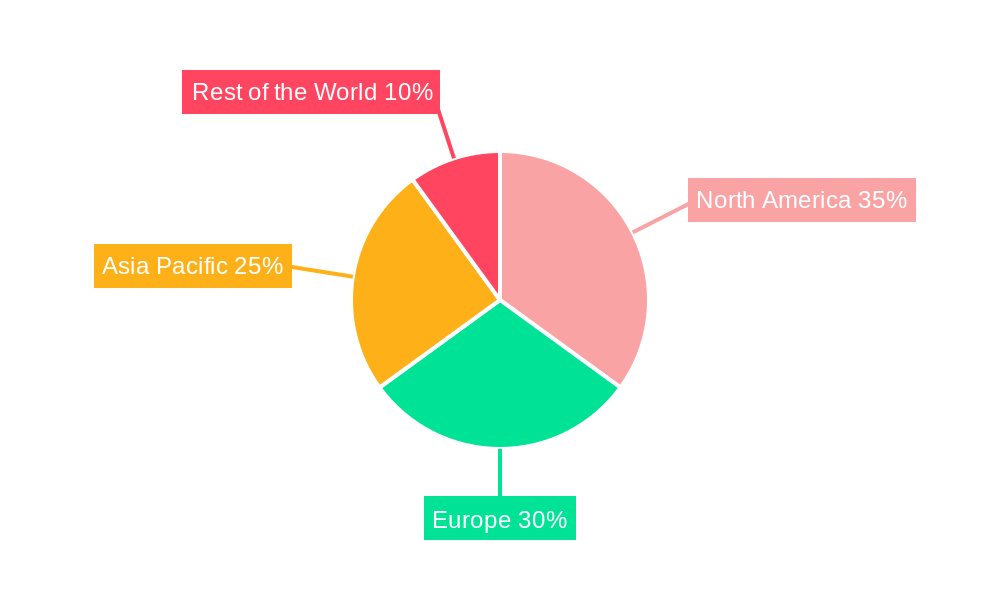
On-board Connectivity Market Regional Market Share
Geographic Coverage of On-board Connectivity Market
On-board Connectivity Market REPORT HIGHLIGHTS
| Aspects | Details |
|---|---|
| Study Period | 2020-2034 |
| Base Year | 2025 |
| Estimated Year | 2026 |
| Forecast Period | 2026-2034 |
| Historical Period | 2020-2025 |
| Growth Rate | CAGR of 13.5% from 2020-2034 |
| Segmentation |
|
Table of Contents
- 1. Introduction
- 1.1. Research Scope
- 1.2. Market Segmentation
- 1.3. Research Objective
- 1.4. Definitions and Assumptions
- 2. Executive Summary
- 2.1. Market Snapshot
- 3. Market Dynamics
- 3.1. Market Drivers
- 3.2. Market Restrains
- 3.3. Market Trends
- 3.4. Market Opportunities
- 4. Market Factor Analysis
- 4.1. Porters Five Forces
- 4.1.1. Bargaining Power of Suppliers
- 4.1.2. Bargaining Power of Buyers
- 4.1.3. Threat of New Entrants
- 4.1.4. Threat of Substitutes
- 4.1.5. Competitive Rivalry
- 4.2. PESTEL analysis
- 4.3. BCG Analysis
- 4.3.1. Stars (High Growth, High Market Share)
- 4.3.2. Cash Cows (Low Growth, High Market Share)
- 4.3.3. Question Mark (High Growth, Low Market Share)
- 4.3.4. Dogs (Low Growth, Low Market Share)
- 4.4. Ansoff Matrix Analysis
- 4.5. Supply Chain Analysis
- 4.6. Regulatory Landscape
- 4.7. Current Market Potential and Opportunity Assessment (TAM–SAM–SOM Framework)
- 4.8. RAX Analyst Note
- 4.1. Porters Five Forces
- 5. Market Analysis, Insights and Forecast 2021-2033
- 5.1. Market Analysis, Insights and Forecast - by Production Analysis
- 5.2. Market Analysis, Insights and Forecast - by Consumption Analysis
- 5.3. Market Analysis, Insights and Forecast - by Import Market Analysis (Value & Volume)
- 5.4. Market Analysis, Insights and Forecast - by Export Market Analysis (Value & Volume)
- 5.5. Market Analysis, Insights and Forecast - by Price Trend Analysis
- 5.6. Market Analysis, Insights and Forecast - by Region
- 5.6.1. North America
- 5.6.2. South America
- 5.6.3. Europe
- 5.6.4. Middle East & Africa
- 5.6.5. Asia Pacific
- 6. Global On-board Connectivity Market Analysis, Insights and Forecast, 2021-2033
- 6.1. Market Analysis, Insights and Forecast - by Production Analysis
- 6.2. Market Analysis, Insights and Forecast - by Consumption Analysis
- 6.3. Market Analysis, Insights and Forecast - by Import Market Analysis (Value & Volume)
- 6.4. Market Analysis, Insights and Forecast - by Export Market Analysis (Value & Volume)
- 6.5. Market Analysis, Insights and Forecast - by Price Trend Analysis
- 7. North America On-board Connectivity Market Analysis, Insights and Forecast, 2020-2032
- 7.1. Market Analysis, Insights and Forecast - by Production Analysis
- 7.2. Market Analysis, Insights and Forecast - by Consumption Analysis
- 7.3. Market Analysis, Insights and Forecast - by Import Market Analysis (Value & Volume)
- 7.4. Market Analysis, Insights and Forecast - by Export Market Analysis (Value & Volume)
- 7.5. Market Analysis, Insights and Forecast - by Price Trend Analysis
- 8. South America On-board Connectivity Market Analysis, Insights and Forecast, 2020-2032
- 8.1. Market Analysis, Insights and Forecast - by Production Analysis
- 8.2. Market Analysis, Insights and Forecast - by Consumption Analysis
- 8.3. Market Analysis, Insights and Forecast - by Import Market Analysis (Value & Volume)
- 8.4. Market Analysis, Insights and Forecast - by Export Market Analysis (Value & Volume)
- 8.5. Market Analysis, Insights and Forecast - by Price Trend Analysis
- 9. Europe On-board Connectivity Market Analysis, Insights and Forecast, 2020-2032
- 9.1. Market Analysis, Insights and Forecast - by Production Analysis
- 9.2. Market Analysis, Insights and Forecast - by Consumption Analysis
- 9.3. Market Analysis, Insights and Forecast - by Import Market Analysis (Value & Volume)
- 9.4. Market Analysis, Insights and Forecast - by Export Market Analysis (Value & Volume)
- 9.5. Market Analysis, Insights and Forecast - by Price Trend Analysis
- 10. Middle East & Africa On-board Connectivity Market Analysis, Insights and Forecast, 2020-2032
- 10.1. Market Analysis, Insights and Forecast - by Production Analysis
- 10.2. Market Analysis, Insights and Forecast - by Consumption Analysis
- 10.3. Market Analysis, Insights and Forecast - by Import Market Analysis (Value & Volume)
- 10.4. Market Analysis, Insights and Forecast - by Export Market Analysis (Value & Volume)
- 10.5. Market Analysis, Insights and Forecast - by Price Trend Analysis
- 11. Asia Pacific On-board Connectivity Market Analysis, Insights and Forecast, 2020-2032
- 11.1. Market Analysis, Insights and Forecast - by Production Analysis
- 11.2. Market Analysis, Insights and Forecast - by Consumption Analysis
- 11.3. Market Analysis, Insights and Forecast - by Import Market Analysis (Value & Volume)
- 11.4. Market Analysis, Insights and Forecast - by Export Market Analysis (Value & Volume)
- 11.5. Market Analysis, Insights and Forecast - by Price Trend Analysis
- 12. Competitive Analysis
- 12.1. Company Profiles
- 12.1.1 Nokia Corp (Alcatel Lucent Enterprise Inc )
- 12.1.1.1. Company Overview
- 12.1.1.2. Products
- 12.1.1.3. Company Financials
- 12.1.1.4. SWOT Analysis
- 12.1.2 AT & T Inc
- 12.1.2.1. Company Overview
- 12.1.2.2. Products
- 12.1.2.3. Company Financials
- 12.1.2.4. SWOT Analysis
- 12.1.3 Honeywell International Inc
- 12.1.3.1. Company Overview
- 12.1.3.2. Products
- 12.1.3.3. Company Financials
- 12.1.3.4. SWOT Analysis
- 12.1.4 Rockwell Collins Inc
- 12.1.4.1. Company Overview
- 12.1.4.2. Products
- 12.1.4.3. Company Financials
- 12.1.4.4. SWOT Analysis
- 12.1.5 Inmarsat PLC
- 12.1.5.1. Company Overview
- 12.1.5.2. Products
- 12.1.5.3. Company Financials
- 12.1.5.4. SWOT Analysis
- 12.1.6 Huawei Technologies Co Ltd
- 12.1.6.1. Company Overview
- 12.1.6.2. Products
- 12.1.6.3. Company Financials
- 12.1.6.4. SWOT Analysis
- 12.1.7 ZTE Corporation
- 12.1.7.1. Company Overview
- 12.1.7.2. Products
- 12.1.7.3. Company Financials
- 12.1.7.4. SWOT Analysis
- 12.1.8 Viasat Inc *List Not Exhaustive
- 12.1.8.1. Company Overview
- 12.1.8.2. Products
- 12.1.8.3. Company Financials
- 12.1.8.4. SWOT Analysis
- 12.1.9 Bombardier Aerospace Inc
- 12.1.9.1. Company Overview
- 12.1.9.2. Products
- 12.1.9.3. Company Financials
- 12.1.9.4. SWOT Analysis
- 12.1.10 Panasonic Corporation
- 12.1.10.1. Company Overview
- 12.1.10.2. Products
- 12.1.10.3. Company Financials
- 12.1.10.4. SWOT Analysis
- 12.1.1 Nokia Corp (Alcatel Lucent Enterprise Inc )
- 12.2. Market Entropy
- 12.2.1 Company's Key Areas Served
- 12.2.2 Recent Developments
- 12.3. Company Market Share Analysis 2025
- 12.3.1 Top 5 Companies Market Share Analysis
- 12.3.2 Top 3 Companies Market Share Analysis
- 12.4. List of Potential Customers
- 13. Research Methodology
List of Figures
- Figure 1: Global On-board Connectivity Market Revenue Breakdown (billion, %) by Region 2025 & 2033
- Figure 2: North America On-board Connectivity Market Revenue (billion), by Production Analysis 2025 & 2033
- Figure 3: North America On-board Connectivity Market Revenue Share (%), by Production Analysis 2025 & 2033
- Figure 4: North America On-board Connectivity Market Revenue (billion), by Consumption Analysis 2025 & 2033
- Figure 5: North America On-board Connectivity Market Revenue Share (%), by Consumption Analysis 2025 & 2033
- Figure 6: North America On-board Connectivity Market Revenue (billion), by Import Market Analysis (Value & Volume) 2025 & 2033
- Figure 7: North America On-board Connectivity Market Revenue Share (%), by Import Market Analysis (Value & Volume) 2025 & 2033
- Figure 8: North America On-board Connectivity Market Revenue (billion), by Export Market Analysis (Value & Volume) 2025 & 2033
- Figure 9: North America On-board Connectivity Market Revenue Share (%), by Export Market Analysis (Value & Volume) 2025 & 2033
- Figure 10: North America On-board Connectivity Market Revenue (billion), by Price Trend Analysis 2025 & 2033
- Figure 11: North America On-board Connectivity Market Revenue Share (%), by Price Trend Analysis 2025 & 2033
- Figure 12: North America On-board Connectivity Market Revenue (billion), by Country 2025 & 2033
- Figure 13: North America On-board Connectivity Market Revenue Share (%), by Country 2025 & 2033
- Figure 14: South America On-board Connectivity Market Revenue (billion), by Production Analysis 2025 & 2033
- Figure 15: South America On-board Connectivity Market Revenue Share (%), by Production Analysis 2025 & 2033
- Figure 16: South America On-board Connectivity Market Revenue (billion), by Consumption Analysis 2025 & 2033
- Figure 17: South America On-board Connectivity Market Revenue Share (%), by Consumption Analysis 2025 & 2033
- Figure 18: South America On-board Connectivity Market Revenue (billion), by Import Market Analysis (Value & Volume) 2025 & 2033
- Figure 19: South America On-board Connectivity Market Revenue Share (%), by Import Market Analysis (Value & Volume) 2025 & 2033
- Figure 20: South America On-board Connectivity Market Revenue (billion), by Export Market Analysis (Value & Volume) 2025 & 2033
- Figure 21: South America On-board Connectivity Market Revenue Share (%), by Export Market Analysis (Value & Volume) 2025 & 2033
- Figure 22: South America On-board Connectivity Market Revenue (billion), by Price Trend Analysis 2025 & 2033
- Figure 23: South America On-board Connectivity Market Revenue Share (%), by Price Trend Analysis 2025 & 2033
- Figure 24: South America On-board Connectivity Market Revenue (billion), by Country 2025 & 2033
- Figure 25: South America On-board Connectivity Market Revenue Share (%), by Country 2025 & 2033
- Figure 26: Europe On-board Connectivity Market Revenue (billion), by Production Analysis 2025 & 2033
- Figure 27: Europe On-board Connectivity Market Revenue Share (%), by Production Analysis 2025 & 2033
- Figure 28: Europe On-board Connectivity Market Revenue (billion), by Consumption Analysis 2025 & 2033
- Figure 29: Europe On-board Connectivity Market Revenue Share (%), by Consumption Analysis 2025 & 2033
- Figure 30: Europe On-board Connectivity Market Revenue (billion), by Import Market Analysis (Value & Volume) 2025 & 2033
- Figure 31: Europe On-board Connectivity Market Revenue Share (%), by Import Market Analysis (Value & Volume) 2025 & 2033
- Figure 32: Europe On-board Connectivity Market Revenue (billion), by Export Market Analysis (Value & Volume) 2025 & 2033
- Figure 33: Europe On-board Connectivity Market Revenue Share (%), by Export Market Analysis (Value & Volume) 2025 & 2033
- Figure 34: Europe On-board Connectivity Market Revenue (billion), by Price Trend Analysis 2025 & 2033
- Figure 35: Europe On-board Connectivity Market Revenue Share (%), by Price Trend Analysis 2025 & 2033
- Figure 36: Europe On-board Connectivity Market Revenue (billion), by Country 2025 & 2033
- Figure 37: Europe On-board Connectivity Market Revenue Share (%), by Country 2025 & 2033
- Figure 38: Middle East & Africa On-board Connectivity Market Revenue (billion), by Production Analysis 2025 & 2033
- Figure 39: Middle East & Africa On-board Connectivity Market Revenue Share (%), by Production Analysis 2025 & 2033
- Figure 40: Middle East & Africa On-board Connectivity Market Revenue (billion), by Consumption Analysis 2025 & 2033
- Figure 41: Middle East & Africa On-board Connectivity Market Revenue Share (%), by Consumption Analysis 2025 & 2033
- Figure 42: Middle East & Africa On-board Connectivity Market Revenue (billion), by Import Market Analysis (Value & Volume) 2025 & 2033
- Figure 43: Middle East & Africa On-board Connectivity Market Revenue Share (%), by Import Market Analysis (Value & Volume) 2025 & 2033
- Figure 44: Middle East & Africa On-board Connectivity Market Revenue (billion), by Export Market Analysis (Value & Volume) 2025 & 2033
- Figure 45: Middle East & Africa On-board Connectivity Market Revenue Share (%), by Export Market Analysis (Value & Volume) 2025 & 2033
- Figure 46: Middle East & Africa On-board Connectivity Market Revenue (billion), by Price Trend Analysis 2025 & 2033
- Figure 47: Middle East & Africa On-board Connectivity Market Revenue Share (%), by Price Trend Analysis 2025 & 2033
- Figure 48: Middle East & Africa On-board Connectivity Market Revenue (billion), by Country 2025 & 2033
- Figure 49: Middle East & Africa On-board Connectivity Market Revenue Share (%), by Country 2025 & 2033
- Figure 50: Asia Pacific On-board Connectivity Market Revenue (billion), by Production Analysis 2025 & 2033
- Figure 51: Asia Pacific On-board Connectivity Market Revenue Share (%), by Production Analysis 2025 & 2033
- Figure 52: Asia Pacific On-board Connectivity Market Revenue (billion), by Consumption Analysis 2025 & 2033
- Figure 53: Asia Pacific On-board Connectivity Market Revenue Share (%), by Consumption Analysis 2025 & 2033
- Figure 54: Asia Pacific On-board Connectivity Market Revenue (billion), by Import Market Analysis (Value & Volume) 2025 & 2033
- Figure 55: Asia Pacific On-board Connectivity Market Revenue Share (%), by Import Market Analysis (Value & Volume) 2025 & 2033
- Figure 56: Asia Pacific On-board Connectivity Market Revenue (billion), by Export Market Analysis (Value & Volume) 2025 & 2033
- Figure 57: Asia Pacific On-board Connectivity Market Revenue Share (%), by Export Market Analysis (Value & Volume) 2025 & 2033
- Figure 58: Asia Pacific On-board Connectivity Market Revenue (billion), by Price Trend Analysis 2025 & 2033
- Figure 59: Asia Pacific On-board Connectivity Market Revenue Share (%), by Price Trend Analysis 2025 & 2033
- Figure 60: Asia Pacific On-board Connectivity Market Revenue (billion), by Country 2025 & 2033
- Figure 61: Asia Pacific On-board Connectivity Market Revenue Share (%), by Country 2025 & 2033
List of Tables
- Table 1: Global On-board Connectivity Market Revenue billion Forecast, by Production Analysis 2020 & 2033
- Table 2: Global On-board Connectivity Market Revenue billion Forecast, by Consumption Analysis 2020 & 2033
- Table 3: Global On-board Connectivity Market Revenue billion Forecast, by Import Market Analysis (Value & Volume) 2020 & 2033
- Table 4: Global On-board Connectivity Market Revenue billion Forecast, by Export Market Analysis (Value & Volume) 2020 & 2033
- Table 5: Global On-board Connectivity Market Revenue billion Forecast, by Price Trend Analysis 2020 & 2033
- Table 6: Global On-board Connectivity Market Revenue billion Forecast, by Region 2020 & 2033
- Table 7: Global On-board Connectivity Market Revenue billion Forecast, by Production Analysis 2020 & 2033
- Table 8: Global On-board Connectivity Market Revenue billion Forecast, by Consumption Analysis 2020 & 2033
- Table 9: Global On-board Connectivity Market Revenue billion Forecast, by Import Market Analysis (Value & Volume) 2020 & 2033
- Table 10: Global On-board Connectivity Market Revenue billion Forecast, by Export Market Analysis (Value & Volume) 2020 & 2033
- Table 11: Global On-board Connectivity Market Revenue billion Forecast, by Price Trend Analysis 2020 & 2033
- Table 12: Global On-board Connectivity Market Revenue billion Forecast, by Country 2020 & 2033
- Table 13: United States On-board Connectivity Market Revenue (billion) Forecast, by Application 2020 & 2033
- Table 14: Canada On-board Connectivity Market Revenue (billion) Forecast, by Application 2020 & 2033
- Table 15: Mexico On-board Connectivity Market Revenue (billion) Forecast, by Application 2020 & 2033
- Table 16: Global On-board Connectivity Market Revenue billion Forecast, by Production Analysis 2020 & 2033
- Table 17: Global On-board Connectivity Market Revenue billion Forecast, by Consumption Analysis 2020 & 2033
- Table 18: Global On-board Connectivity Market Revenue billion Forecast, by Import Market Analysis (Value & Volume) 2020 & 2033
- Table 19: Global On-board Connectivity Market Revenue billion Forecast, by Export Market Analysis (Value & Volume) 2020 & 2033
- Table 20: Global On-board Connectivity Market Revenue billion Forecast, by Price Trend Analysis 2020 & 2033
- Table 21: Global On-board Connectivity Market Revenue billion Forecast, by Country 2020 & 2033
- Table 22: Brazil On-board Connectivity Market Revenue (billion) Forecast, by Application 2020 & 2033
- Table 23: Argentina On-board Connectivity Market Revenue (billion) Forecast, by Application 2020 & 2033
- Table 24: Rest of South America On-board Connectivity Market Revenue (billion) Forecast, by Application 2020 & 2033
- Table 25: Global On-board Connectivity Market Revenue billion Forecast, by Production Analysis 2020 & 2033
- Table 26: Global On-board Connectivity Market Revenue billion Forecast, by Consumption Analysis 2020 & 2033
- Table 27: Global On-board Connectivity Market Revenue billion Forecast, by Import Market Analysis (Value & Volume) 2020 & 2033
- Table 28: Global On-board Connectivity Market Revenue billion Forecast, by Export Market Analysis (Value & Volume) 2020 & 2033
- Table 29: Global On-board Connectivity Market Revenue billion Forecast, by Price Trend Analysis 2020 & 2033
- Table 30: Global On-board Connectivity Market Revenue billion Forecast, by Country 2020 & 2033
- Table 31: United Kingdom On-board Connectivity Market Revenue (billion) Forecast, by Application 2020 & 2033
- Table 32: Germany On-board Connectivity Market Revenue (billion) Forecast, by Application 2020 & 2033
- Table 33: France On-board Connectivity Market Revenue (billion) Forecast, by Application 2020 & 2033
- Table 34: Italy On-board Connectivity Market Revenue (billion) Forecast, by Application 2020 & 2033
- Table 35: Spain On-board Connectivity Market Revenue (billion) Forecast, by Application 2020 & 2033
- Table 36: Russia On-board Connectivity Market Revenue (billion) Forecast, by Application 2020 & 2033
- Table 37: Benelux On-board Connectivity Market Revenue (billion) Forecast, by Application 2020 & 2033
- Table 38: Nordics On-board Connectivity Market Revenue (billion) Forecast, by Application 2020 & 2033
- Table 39: Rest of Europe On-board Connectivity Market Revenue (billion) Forecast, by Application 2020 & 2033
- Table 40: Global On-board Connectivity Market Revenue billion Forecast, by Production Analysis 2020 & 2033
- Table 41: Global On-board Connectivity Market Revenue billion Forecast, by Consumption Analysis 2020 & 2033
- Table 42: Global On-board Connectivity Market Revenue billion Forecast, by Import Market Analysis (Value & Volume) 2020 & 2033
- Table 43: Global On-board Connectivity Market Revenue billion Forecast, by Export Market Analysis (Value & Volume) 2020 & 2033
- Table 44: Global On-board Connectivity Market Revenue billion Forecast, by Price Trend Analysis 2020 & 2033
- Table 45: Global On-board Connectivity Market Revenue billion Forecast, by Country 2020 & 2033
- Table 46: Turkey On-board Connectivity Market Revenue (billion) Forecast, by Application 2020 & 2033
- Table 47: Israel On-board Connectivity Market Revenue (billion) Forecast, by Application 2020 & 2033
- Table 48: GCC On-board Connectivity Market Revenue (billion) Forecast, by Application 2020 & 2033
- Table 49: North Africa On-board Connectivity Market Revenue (billion) Forecast, by Application 2020 & 2033
- Table 50: South Africa On-board Connectivity Market Revenue (billion) Forecast, by Application 2020 & 2033
- Table 51: Rest of Middle East & Africa On-board Connectivity Market Revenue (billion) Forecast, by Application 2020 & 2033
- Table 52: Global On-board Connectivity Market Revenue billion Forecast, by Production Analysis 2020 & 2033
- Table 53: Global On-board Connectivity Market Revenue billion Forecast, by Consumption Analysis 2020 & 2033
- Table 54: Global On-board Connectivity Market Revenue billion Forecast, by Import Market Analysis (Value & Volume) 2020 & 2033
- Table 55: Global On-board Connectivity Market Revenue billion Forecast, by Export Market Analysis (Value & Volume) 2020 & 2033
- Table 56: Global On-board Connectivity Market Revenue billion Forecast, by Price Trend Analysis 2020 & 2033
- Table 57: Global On-board Connectivity Market Revenue billion Forecast, by Country 2020 & 2033
- Table 58: China On-board Connectivity Market Revenue (billion) Forecast, by Application 2020 & 2033
- Table 59: India On-board Connectivity Market Revenue (billion) Forecast, by Application 2020 & 2033
- Table 60: Japan On-board Connectivity Market Revenue (billion) Forecast, by Application 2020 & 2033
- Table 61: South Korea On-board Connectivity Market Revenue (billion) Forecast, by Application 2020 & 2033
- Table 62: ASEAN On-board Connectivity Market Revenue (billion) Forecast, by Application 2020 & 2033
- Table 63: Oceania On-board Connectivity Market Revenue (billion) Forecast, by Application 2020 & 2033
- Table 64: Rest of Asia Pacific On-board Connectivity Market Revenue (billion) Forecast, by Application 2020 & 2033
Frequently Asked Questions
1. What is the projected Compound Annual Growth Rate (CAGR) of the On-board Connectivity Market?
The projected CAGR is approximately 13.5%.
2. Which companies are prominent players in the On-board Connectivity Market?
Key companies in the market include Nokia Corp (Alcatel Lucent Enterprise Inc ), AT & T Inc, Honeywell International Inc, Rockwell Collins Inc, Inmarsat PLC, Huawei Technologies Co Ltd, ZTE Corporation, Viasat Inc *List Not Exhaustive, Bombardier Aerospace Inc, Panasonic Corporation.
3. What are the main segments of the On-board Connectivity Market?
The market segments include Production Analysis, Consumption Analysis, Import Market Analysis (Value & Volume), Export Market Analysis (Value & Volume), Price Trend Analysis.
4. Can you provide details about the market size?
The market size is estimated to be USD 10.4 billion as of 2022.
5. What are some drivers contributing to market growth?
; Increasing Number Of Air Passengers; Use Of Portable Electronic Devices.
6. What are the notable trends driving market growth?
Aviation Industry Expected to Witness Significant Growth.
7. Are there any restraints impacting market growth?
; High Cost Of Connectivity Equipments.
8. Can you provide examples of recent developments in the market?
N/A
9. What pricing options are available for accessing the report?
Pricing options include single-user, multi-user, and enterprise licenses priced at USD 4750, USD 5250, and USD 8750 respectively.
10. Is the market size provided in terms of value or volume?
The market size is provided in terms of value, measured in billion.
11. Are there any specific market keywords associated with the report?
Yes, the market keyword associated with the report is "On-board Connectivity Market," which aids in identifying and referencing the specific market segment covered.
12. How do I determine which pricing option suits my needs best?
The pricing options vary based on user requirements and access needs. Individual users may opt for single-user licenses, while businesses requiring broader access may choose multi-user or enterprise licenses for cost-effective access to the report.
13. Are there any additional resources or data provided in the On-board Connectivity Market report?
While the report offers comprehensive insights, it's advisable to review the specific contents or supplementary materials provided to ascertain if additional resources or data are available.
14. How can I stay updated on further developments or reports in the On-board Connectivity Market?
To stay informed about further developments, trends, and reports in the On-board Connectivity Market, consider subscribing to industry newsletters, following relevant companies and organizations, or regularly checking reputable industry news sources and publications.
Methodology
Step 1 - Identification of Relevant Samples Size from Population Database


Step 2 - Approaches for Defining Global Market Size (Value, Volume* & Price*)

Note*: In applicable scenarios
Step 3 - Data Sources
Primary Research
- Web Analytics
- Survey Reports
- Research Institute
- Latest Research Reports
- Opinion Leaders
Secondary Research
- Annual Reports
- White Paper
- Latest Press Release
- Industry Association
- Paid Database
- Investor Presentations

Step 4 - Data Triangulation
Involves using different sources of information in order to increase the validity of a study
These sources are likely to be stakeholders in a program - participants, other researchers, program staff, other community members, and so on.
Then we put all data in single framework & apply various statistical tools to find out the dynamic on the market.
During the analysis stage, feedback from the stakeholder groups would be compared to determine areas of agreement as well as areas of divergence

