

Key Insights
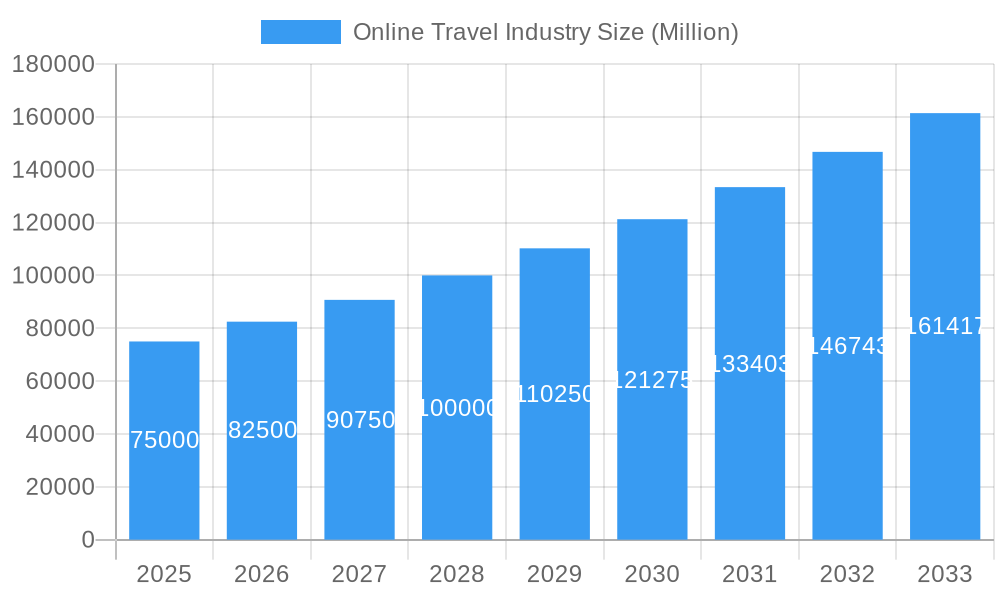
The Online Travel industry is poised for significant expansion, driven by widespread internet access, high smartphone penetration, and a growing consumer preference for convenient, self-service travel booking solutions. The market, valued at $622.6 billion in 2025, is projected to grow at a Compound Annual Growth Rate (CAGR) of 9.75% through 2033. Key growth drivers include increased affordability of air travel and accommodations, the competitive offerings and user-friendly interfaces of Online Travel Agencies (OTAs), and evolving traveler demands for personalized and curated digital experiences. Mobile booking is anticipated to become the dominant platform, surpassing website bookings.
Online Travel Industry Market Size (In Billion)
However, the sector faces challenges including economic volatility impacting travel expenditure, data privacy and security concerns, and intense competition among OTAs and traditional agencies, necessitating continuous technological innovation. Market segmentation across platforms (mobile apps, websites) and booking modes (direct, third-party) presents both opportunities and hurdles. Regional disparities exist, with North America and Europe currently leading, while Asia-Pacific is expected to see substantial growth fueled by expanding middle classes and rising disposable incomes. Leading players such as Booking Holdings, Expedia, and Airbnb operate within a dynamic and fragmented competitive landscape.
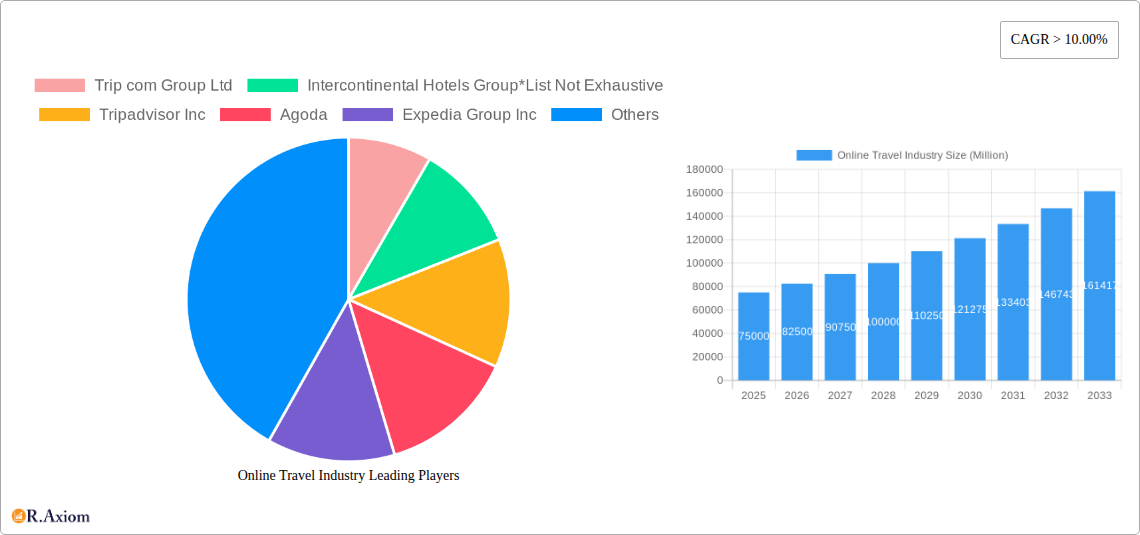
Online Travel Industry Company Market Share
This comprehensive report analyzes the Online Travel market, including size, segmentation, key players, growth drivers, challenges, and future opportunities. The analysis covers the historical period (2019-2024) and forecasts market trajectory (2025-2033), with 2025 designated as the base year. Actionable insights are provided for stakeholders, investors, and businesses in this evolving sector. The estimated market value for 2025 is $622.6 billion.
Online Travel Industry Market Concentration & Innovation
This section analyzes the competitive landscape of the online travel industry, focusing on market concentration, innovation, regulatory frameworks, and mergers & acquisitions (M&A) activity. The report identifies key players such as Booking Holdings Inc., Expedia Group Inc., Trip.com Group Ltd., and Airbnb Inc., and assesses their market share. It examines the impact of technological innovations, such as AI-powered personalization and mobile-first strategies, on market dynamics. The analysis further explores the role of regulatory frameworks in shaping the industry's evolution, including considerations of data privacy and consumer protection. The study also investigates the impact of substitute products, such as direct booking with hotels or alternative accommodation options, and examines trends in end-user behavior and preferences.
- Market Share: Booking Holdings Inc. holds an estimated xx% market share in 2025, followed by Expedia Group Inc. with xx%, Trip.com Group Ltd. with xx%, and Airbnb Inc. with xx%. (These are estimates).
- M&A Activity: The report details significant M&A deals within the industry during the study period, including deal values exceeding $xx Million. This section explores the strategic implications of these transactions for market consolidation and innovation. The cumulative value of M&A deals between 2019 and 2024 is estimated to be $xx Million.
Online Travel Industry Industry Trends & Insights
This section delves into the key trends shaping the online travel industry, with a detailed analysis of market growth drivers, technological disruptions, evolving consumer preferences, and the competitive dynamics within the sector. The report projects a Compound Annual Growth Rate (CAGR) of xx% for the forecast period (2025-2033). Market penetration of online travel bookings is expected to reach xx% by 2033. The analysis covers factors driving market expansion, including rising disposable incomes, increased internet penetration, and the growing popularity of travel experiences. It also examines the influence of technological innovations, such as the use of big data and AI for personalized recommendations, and the shift towards mobile-first booking experiences. The competitive landscape, marked by intense competition among established players and the emergence of disruptive startups, is thoroughly assessed. The report examines shifting consumer preferences, including a growing demand for sustainable and experiential travel, and how this impacts industry strategies.
Dominant Markets & Segments in Online Travel Industry
This section identifies the leading regions, countries, and segments within the online travel industry. The analysis focuses on key performance indicators such as revenue generated and market share held by various segments and regions. It examines the factors driving dominance in specific areas. Consideration is given to platform type (mobile applications vs. websites) and booking mode (third-party online portals vs. direct/captive portals).
- Leading Region: Asia-Pacific is projected as the leading region in 2025, driven by strong economic growth, a burgeoning middle class, and increased internet penetration.
- Dominant Segment (Platform): Mobile applications are expected to account for the largest market share in 2025 due to increased smartphone penetration and convenience.
- Dominant Segment (Booking Mode): Third-party online travel portals are likely to dominate, offering wider choices and competitive pricing.
Key Drivers for Dominant Markets:
- Economic Policies: Favorable government policies and investments in tourism infrastructure are key drivers, particularly in the Asia-Pacific region.
- Infrastructure: Advanced transportation networks and well-developed tourist destinations enhance market growth.
- Technology Adoption: High mobile and internet penetration enables convenient online booking.
Online Travel Industry Product Developments
This section summarizes recent product innovations, their applications, and competitive advantages. The focus is on the technological trends driving product development and how these innovations contribute to a better user experience and market differentiation. This includes advancements in personalized travel recommendations, AI-powered chatbots for customer service, and immersive virtual reality experiences for travel planning.
Report Scope & Segmentation Analysis
This report segments the online travel industry by platform (mobile application, website) and booking mode (third-party online portals, direct/captive portals). Each segment's growth projections, market size, and competitive dynamics are detailed. The market size for mobile applications in 2025 is projected to be $xx Million, while websites are expected to generate $xx Million. Third-party portals are anticipated to capture $xx Million, with direct bookings generating $xx Million. The competitive landscape varies across these segments, with different players dominating specific niches.
Key Drivers of Online Travel Industry Growth
Several factors are driving the growth of the online travel industry. These include the increasing adoption of smartphones and the internet, leading to higher online booking rates. The expansion of affordable air travel and accommodation options also plays a significant role. Furthermore, government initiatives promoting tourism and economic growth contribute to the industry's expansion. The growth is further fueled by innovations in technology, such as AI-powered personalized travel planning tools and virtual reality experiences.
Challenges in the Online Travel Industry Sector
The online travel industry faces several challenges. Fluctuations in currency exchange rates and global economic conditions impact travel spending. Stringent regulations concerning data privacy and consumer protection add complexity to operations. Intense competition among numerous online travel agents (OTAs) also presents challenges. Supply chain disruptions, such as airline cancellations or hotel closures, create uncertainty and operational difficulties.
Emerging Opportunities in Online Travel Industry
The online travel industry presents several emerging opportunities. The growing popularity of sustainable and responsible travel creates new market segments. The adoption of blockchain technology for secure and transparent transactions offers efficiency gains. Expansion into emerging markets with high growth potential promises significant rewards. The development of personalized travel experiences, incorporating augmented and virtual reality technologies, enhances user engagement.
Leading Players in the Online Travel Industry Market
Key Developments in Online Travel Industry Industry
- 2022-Q4: Booking Holdings launched a new feature for personalized travel recommendations powered by AI.
- 2023-Q1: Expedia Group acquired a smaller OTA, strengthening its market position.
- 2023-Q2: Airbnb introduced a new sustainability initiative, attracting environmentally conscious travelers.
- 2024-Q1: Trip.com expanded its operations in Southeast Asia.
(Further details of key developments with their impact on market dynamics would be included in the full report).
Strategic Outlook for Online Travel Industry Market
The online travel industry's future is promising, fueled by sustained growth in tourism, technological advancements, and evolving consumer preferences. Personalized travel experiences, leveraging AI and big data, will play a critical role. Sustainable and responsible tourism will drive demand, creating opportunities for specialized services. Expanding into underserved markets and adopting innovative technologies like virtual and augmented reality will enhance competitiveness. The industry’s growth trajectory indicates a significant market opportunity for businesses capable of adapting to changing consumer expectations and technological developments.
Online Travel Industry Segmentation
-
1. Platform
- 1.1. Mobile Application
- 1.2. Website
-
2. Mode of Booking
- 2.1. Third party online portals
- 2.2. Direct / captive portals
Online Travel Industry Segmentation By Geography
-
1. North America
- 1.1. United States
- 1.2. Canada
- 1.3. Mexico
-
2. South America
- 2.1. Brazil
- 2.2. Argentina
- 2.3. Rest of South America
-
3. Europe
- 3.1. United Kingdom
- 3.2. Germany
- 3.3. France
- 3.4. Italy
- 3.5. Spain
- 3.6. Russia
- 3.7. Benelux
- 3.8. Nordics
- 3.9. Rest of Europe
-
4. Middle East & Africa
- 4.1. Turkey
- 4.2. Israel
- 4.3. GCC
- 4.4. North Africa
- 4.5. South Africa
- 4.6. Rest of Middle East & Africa
-
5. Asia Pacific
- 5.1. China
- 5.2. India
- 5.3. Japan
- 5.4. South Korea
- 5.5. ASEAN
- 5.6. Oceania
- 5.7. Rest of Asia Pacific
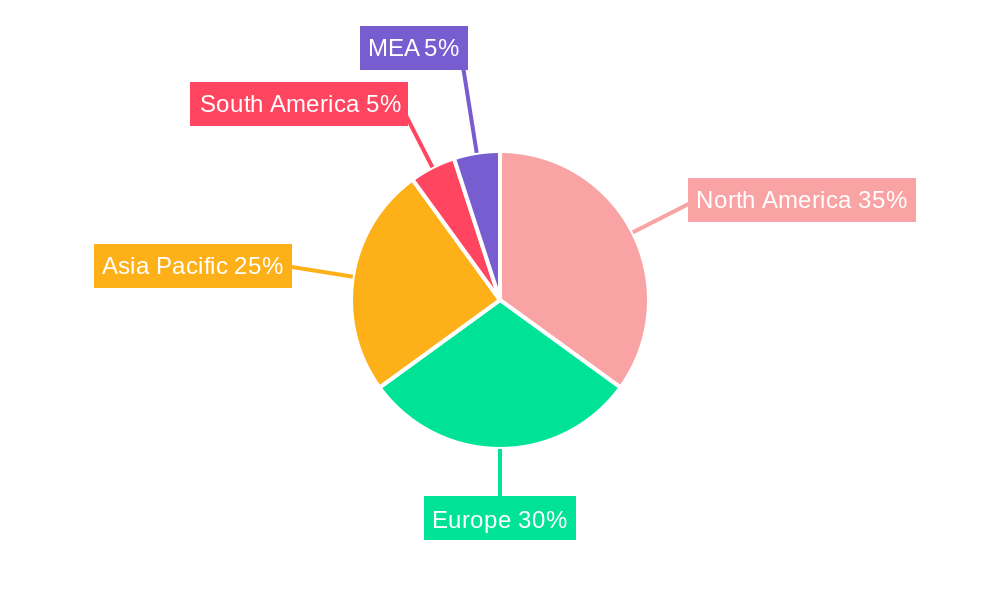
Online Travel Industry Regional Market Share
Geographic Coverage of Online Travel Industry
Online Travel Industry REPORT HIGHLIGHTS
| Aspects | Details |
|---|---|
| Study Period | 2020-2034 |
| Base Year | 2025 |
| Estimated Year | 2026 |
| Forecast Period | 2026-2034 |
| Historical Period | 2020-2025 |
| Growth Rate | CAGR of 9.75% from 2020-2034 |
| Segmentation |
|
Table of Contents
- 1. Introduction
- 1.1. Research Scope
- 1.2. Market Segmentation
- 1.3. Research Objective
- 1.4. Definitions and Assumptions
- 2. Executive Summary
- 2.1. Market Snapshot
- 3. Market Dynamics
- 3.1. Market Drivers
- 3.2. Market Restrains
- 3.3. Market Trends
- 3.4. Market Opportunities
- 4. Market Factor Analysis
- 4.1. Porters Five Forces
- 4.1.1. Bargaining Power of Suppliers
- 4.1.2. Bargaining Power of Buyers
- 4.1.3. Threat of New Entrants
- 4.1.4. Threat of Substitutes
- 4.1.5. Competitive Rivalry
- 4.2. PESTEL analysis
- 4.3. BCG Analysis
- 4.3.1. Stars (High Growth, High Market Share)
- 4.3.2. Cash Cows (Low Growth, High Market Share)
- 4.3.3. Question Mark (High Growth, Low Market Share)
- 4.3.4. Dogs (Low Growth, Low Market Share)
- 4.4. Ansoff Matrix Analysis
- 4.5. Supply Chain Analysis
- 4.6. Regulatory Landscape
- 4.7. Current Market Potential and Opportunity Assessment (TAM–SAM–SOM Framework)
- 4.8. RAX Analyst Note
- 4.1. Porters Five Forces
- 5. Market Analysis, Insights and Forecast 2021-2033
- 5.1. Market Analysis, Insights and Forecast - by Platform
- 5.1.1. Mobile Application
- 5.1.2. Website
- 5.2. Market Analysis, Insights and Forecast - by Mode of Booking
- 5.2.1. Third party online portals
- 5.2.2. Direct / captive portals
- 5.3. Market Analysis, Insights and Forecast - by Region
- 5.3.1. North America
- 5.3.2. South America
- 5.3.3. Europe
- 5.3.4. Middle East & Africa
- 5.3.5. Asia Pacific
- 5.1. Market Analysis, Insights and Forecast - by Platform
- 6. Global Online Travel Industry Analysis, Insights and Forecast, 2021-2033
- 6.1. Market Analysis, Insights and Forecast - by Platform
- 6.1.1. Mobile Application
- 6.1.2. Website
- 6.2. Market Analysis, Insights and Forecast - by Mode of Booking
- 6.2.1. Third party online portals
- 6.2.2. Direct / captive portals
- 6.1. Market Analysis, Insights and Forecast - by Platform
- 7. North America Online Travel Industry Analysis, Insights and Forecast, 2020-2032
- 7.1. Market Analysis, Insights and Forecast - by Platform
- 7.1.1. Mobile Application
- 7.1.2. Website
- 7.2. Market Analysis, Insights and Forecast - by Mode of Booking
- 7.2.1. Third party online portals
- 7.2.2. Direct / captive portals
- 7.1. Market Analysis, Insights and Forecast - by Platform
- 8. South America Online Travel Industry Analysis, Insights and Forecast, 2020-2032
- 8.1. Market Analysis, Insights and Forecast - by Platform
- 8.1.1. Mobile Application
- 8.1.2. Website
- 8.2. Market Analysis, Insights and Forecast - by Mode of Booking
- 8.2.1. Third party online portals
- 8.2.2. Direct / captive portals
- 8.1. Market Analysis, Insights and Forecast - by Platform
- 9. Europe Online Travel Industry Analysis, Insights and Forecast, 2020-2032
- 9.1. Market Analysis, Insights and Forecast - by Platform
- 9.1.1. Mobile Application
- 9.1.2. Website
- 9.2. Market Analysis, Insights and Forecast - by Mode of Booking
- 9.2.1. Third party online portals
- 9.2.2. Direct / captive portals
- 9.1. Market Analysis, Insights and Forecast - by Platform
- 10. Middle East & Africa Online Travel Industry Analysis, Insights and Forecast, 2020-2032
- 10.1. Market Analysis, Insights and Forecast - by Platform
- 10.1.1. Mobile Application
- 10.1.2. Website
- 10.2. Market Analysis, Insights and Forecast - by Mode of Booking
- 10.2.1. Third party online portals
- 10.2.2. Direct / captive portals
- 10.1. Market Analysis, Insights and Forecast - by Platform
- 11. Asia Pacific Online Travel Industry Analysis, Insights and Forecast, 2020-2032
- 11.1. Market Analysis, Insights and Forecast - by Platform
- 11.1.1. Mobile Application
- 11.1.2. Website
- 11.2. Market Analysis, Insights and Forecast - by Mode of Booking
- 11.2.1. Third party online portals
- 11.2.2. Direct / captive portals
- 11.1. Market Analysis, Insights and Forecast - by Platform
- 12. Competitive Analysis
- 12.1. Company Profiles
- 12.1.1 Trip com Group Ltd
- 12.1.1.1. Company Overview
- 12.1.1.2. Products
- 12.1.1.3. Company Financials
- 12.1.1.4. SWOT Analysis
- 12.1.2 Intercontinental Hotels Group*List Not Exhaustive
- 12.1.2.1. Company Overview
- 12.1.2.2. Products
- 12.1.2.3. Company Financials
- 12.1.2.4. SWOT Analysis
- 12.1.3 Tripadvisor Inc
- 12.1.3.1. Company Overview
- 12.1.3.2. Products
- 12.1.3.3. Company Financials
- 12.1.3.4. SWOT Analysis
- 12.1.4 Agoda
- 12.1.4.1. Company Overview
- 12.1.4.2. Products
- 12.1.4.3. Company Financials
- 12.1.4.4. SWOT Analysis
- 12.1.5 Expedia Group Inc
- 12.1.5.1. Company Overview
- 12.1.5.2. Products
- 12.1.5.3. Company Financials
- 12.1.5.4. SWOT Analysis
- 12.1.6 Traveloka Indonesia PT
- 12.1.6.1. Company Overview
- 12.1.6.2. Products
- 12.1.6.3. Company Financials
- 12.1.6.4. SWOT Analysis
- 12.1.7 HRS GmbH
- 12.1.7.1. Company Overview
- 12.1.7.2. Products
- 12.1.7.3. Company Financials
- 12.1.7.4. SWOT Analysis
- 12.1.8 Oravel Stays Pvt Ltd
- 12.1.8.1. Company Overview
- 12.1.8.2. Products
- 12.1.8.3. Company Financials
- 12.1.8.4. SWOT Analysis
- 12.1.9 Airbnb Inc
- 12.1.9.1. Company Overview
- 12.1.9.2. Products
- 12.1.9.3. Company Financials
- 12.1.9.4. SWOT Analysis
- 12.1.10 Hostelworld Group
- 12.1.10.1. Company Overview
- 12.1.10.2. Products
- 12.1.10.3. Company Financials
- 12.1.10.4. SWOT Analysis
- 12.1.11 Hotelbeds Group SL
- 12.1.11.1. Company Overview
- 12.1.11.2. Products
- 12.1.11.3. Company Financials
- 12.1.11.4. SWOT Analysis
- 12.1.12 Booking Holdings Inc
- 12.1.12.1. Company Overview
- 12.1.12.2. Products
- 12.1.12.3. Company Financials
- 12.1.12.4. SWOT Analysis
- 12.1.1 Trip com Group Ltd
- 12.2. Market Entropy
- 12.2.1 Company's Key Areas Served
- 12.2.2 Recent Developments
- 12.3. Company Market Share Analysis 2025
- 12.3.1 Top 5 Companies Market Share Analysis
- 12.3.2 Top 3 Companies Market Share Analysis
- 12.4. List of Potential Customers
- 13. Research Methodology
List of Figures
- Figure 1: Global Online Travel Industry Revenue Breakdown (billion, %) by Region 2025 & 2033
- Figure 2: North America Online Travel Industry Revenue (billion), by Platform 2025 & 2033
- Figure 3: North America Online Travel Industry Revenue Share (%), by Platform 2025 & 2033
- Figure 4: North America Online Travel Industry Revenue (billion), by Mode of Booking 2025 & 2033
- Figure 5: North America Online Travel Industry Revenue Share (%), by Mode of Booking 2025 & 2033
- Figure 6: North America Online Travel Industry Revenue (billion), by Country 2025 & 2033
- Figure 7: North America Online Travel Industry Revenue Share (%), by Country 2025 & 2033
- Figure 8: South America Online Travel Industry Revenue (billion), by Platform 2025 & 2033
- Figure 9: South America Online Travel Industry Revenue Share (%), by Platform 2025 & 2033
- Figure 10: South America Online Travel Industry Revenue (billion), by Mode of Booking 2025 & 2033
- Figure 11: South America Online Travel Industry Revenue Share (%), by Mode of Booking 2025 & 2033
- Figure 12: South America Online Travel Industry Revenue (billion), by Country 2025 & 2033
- Figure 13: South America Online Travel Industry Revenue Share (%), by Country 2025 & 2033
- Figure 14: Europe Online Travel Industry Revenue (billion), by Platform 2025 & 2033
- Figure 15: Europe Online Travel Industry Revenue Share (%), by Platform 2025 & 2033
- Figure 16: Europe Online Travel Industry Revenue (billion), by Mode of Booking 2025 & 2033
- Figure 17: Europe Online Travel Industry Revenue Share (%), by Mode of Booking 2025 & 2033
- Figure 18: Europe Online Travel Industry Revenue (billion), by Country 2025 & 2033
- Figure 19: Europe Online Travel Industry Revenue Share (%), by Country 2025 & 2033
- Figure 20: Middle East & Africa Online Travel Industry Revenue (billion), by Platform 2025 & 2033
- Figure 21: Middle East & Africa Online Travel Industry Revenue Share (%), by Platform 2025 & 2033
- Figure 22: Middle East & Africa Online Travel Industry Revenue (billion), by Mode of Booking 2025 & 2033
- Figure 23: Middle East & Africa Online Travel Industry Revenue Share (%), by Mode of Booking 2025 & 2033
- Figure 24: Middle East & Africa Online Travel Industry Revenue (billion), by Country 2025 & 2033
- Figure 25: Middle East & Africa Online Travel Industry Revenue Share (%), by Country 2025 & 2033
- Figure 26: Asia Pacific Online Travel Industry Revenue (billion), by Platform 2025 & 2033
- Figure 27: Asia Pacific Online Travel Industry Revenue Share (%), by Platform 2025 & 2033
- Figure 28: Asia Pacific Online Travel Industry Revenue (billion), by Mode of Booking 2025 & 2033
- Figure 29: Asia Pacific Online Travel Industry Revenue Share (%), by Mode of Booking 2025 & 2033
- Figure 30: Asia Pacific Online Travel Industry Revenue (billion), by Country 2025 & 2033
- Figure 31: Asia Pacific Online Travel Industry Revenue Share (%), by Country 2025 & 2033
List of Tables
- Table 1: Global Online Travel Industry Revenue billion Forecast, by Platform 2020 & 2033
- Table 2: Global Online Travel Industry Revenue billion Forecast, by Mode of Booking 2020 & 2033
- Table 3: Global Online Travel Industry Revenue billion Forecast, by Region 2020 & 2033
- Table 4: Global Online Travel Industry Revenue billion Forecast, by Platform 2020 & 2033
- Table 5: Global Online Travel Industry Revenue billion Forecast, by Mode of Booking 2020 & 2033
- Table 6: Global Online Travel Industry Revenue billion Forecast, by Country 2020 & 2033
- Table 7: United States Online Travel Industry Revenue (billion) Forecast, by Application 2020 & 2033
- Table 8: Canada Online Travel Industry Revenue (billion) Forecast, by Application 2020 & 2033
- Table 9: Mexico Online Travel Industry Revenue (billion) Forecast, by Application 2020 & 2033
- Table 10: Global Online Travel Industry Revenue billion Forecast, by Platform 2020 & 2033
- Table 11: Global Online Travel Industry Revenue billion Forecast, by Mode of Booking 2020 & 2033
- Table 12: Global Online Travel Industry Revenue billion Forecast, by Country 2020 & 2033
- Table 13: Brazil Online Travel Industry Revenue (billion) Forecast, by Application 2020 & 2033
- Table 14: Argentina Online Travel Industry Revenue (billion) Forecast, by Application 2020 & 2033
- Table 15: Rest of South America Online Travel Industry Revenue (billion) Forecast, by Application 2020 & 2033
- Table 16: Global Online Travel Industry Revenue billion Forecast, by Platform 2020 & 2033
- Table 17: Global Online Travel Industry Revenue billion Forecast, by Mode of Booking 2020 & 2033
- Table 18: Global Online Travel Industry Revenue billion Forecast, by Country 2020 & 2033
- Table 19: United Kingdom Online Travel Industry Revenue (billion) Forecast, by Application 2020 & 2033
- Table 20: Germany Online Travel Industry Revenue (billion) Forecast, by Application 2020 & 2033
- Table 21: France Online Travel Industry Revenue (billion) Forecast, by Application 2020 & 2033
- Table 22: Italy Online Travel Industry Revenue (billion) Forecast, by Application 2020 & 2033
- Table 23: Spain Online Travel Industry Revenue (billion) Forecast, by Application 2020 & 2033
- Table 24: Russia Online Travel Industry Revenue (billion) Forecast, by Application 2020 & 2033
- Table 25: Benelux Online Travel Industry Revenue (billion) Forecast, by Application 2020 & 2033
- Table 26: Nordics Online Travel Industry Revenue (billion) Forecast, by Application 2020 & 2033
- Table 27: Rest of Europe Online Travel Industry Revenue (billion) Forecast, by Application 2020 & 2033
- Table 28: Global Online Travel Industry Revenue billion Forecast, by Platform 2020 & 2033
- Table 29: Global Online Travel Industry Revenue billion Forecast, by Mode of Booking 2020 & 2033
- Table 30: Global Online Travel Industry Revenue billion Forecast, by Country 2020 & 2033
- Table 31: Turkey Online Travel Industry Revenue (billion) Forecast, by Application 2020 & 2033
- Table 32: Israel Online Travel Industry Revenue (billion) Forecast, by Application 2020 & 2033
- Table 33: GCC Online Travel Industry Revenue (billion) Forecast, by Application 2020 & 2033
- Table 34: North Africa Online Travel Industry Revenue (billion) Forecast, by Application 2020 & 2033
- Table 35: South Africa Online Travel Industry Revenue (billion) Forecast, by Application 2020 & 2033
- Table 36: Rest of Middle East & Africa Online Travel Industry Revenue (billion) Forecast, by Application 2020 & 2033
- Table 37: Global Online Travel Industry Revenue billion Forecast, by Platform 2020 & 2033
- Table 38: Global Online Travel Industry Revenue billion Forecast, by Mode of Booking 2020 & 2033
- Table 39: Global Online Travel Industry Revenue billion Forecast, by Country 2020 & 2033
- Table 40: China Online Travel Industry Revenue (billion) Forecast, by Application 2020 & 2033
- Table 41: India Online Travel Industry Revenue (billion) Forecast, by Application 2020 & 2033
- Table 42: Japan Online Travel Industry Revenue (billion) Forecast, by Application 2020 & 2033
- Table 43: South Korea Online Travel Industry Revenue (billion) Forecast, by Application 2020 & 2033
- Table 44: ASEAN Online Travel Industry Revenue (billion) Forecast, by Application 2020 & 2033
- Table 45: Oceania Online Travel Industry Revenue (billion) Forecast, by Application 2020 & 2033
- Table 46: Rest of Asia Pacific Online Travel Industry Revenue (billion) Forecast, by Application 2020 & 2033
Frequently Asked Questions
1. What is the projected Compound Annual Growth Rate (CAGR) of the Online Travel Industry?
The projected CAGR is approximately 9.75%.
2. Which companies are prominent players in the Online Travel Industry?
Key companies in the market include Trip com Group Ltd, Intercontinental Hotels Group*List Not Exhaustive, Tripadvisor Inc, Agoda, Expedia Group Inc, Traveloka Indonesia PT, HRS GmbH, Oravel Stays Pvt Ltd, Airbnb Inc, Hostelworld Group, Hotelbeds Group SL, Booking Holdings Inc.
3. What are the main segments of the Online Travel Industry?
The market segments include Platform, Mode of Booking.
4. Can you provide details about the market size?
The market size is estimated to be USD 622.6 billion as of 2022.
5. What are some drivers contributing to market growth?
Increase in Domestic Travel Driving the Market; Growing Tourist Footfall Driving the Market.
6. What are the notable trends driving market growth?
Increasing Internet Penetration has Huge Impact on the Market.
7. Are there any restraints impacting market growth?
Restrictions on Purchases of Number of Products; Customs Regulations and Taxation Policies.
8. Can you provide examples of recent developments in the market?
N/A
9. What pricing options are available for accessing the report?
Pricing options include single-user, multi-user, and enterprise licenses priced at USD 3800, USD 4500, and USD 5800 respectively.
10. Is the market size provided in terms of value or volume?
The market size is provided in terms of value, measured in billion.
11. Are there any specific market keywords associated with the report?
Yes, the market keyword associated with the report is "Online Travel Industry," which aids in identifying and referencing the specific market segment covered.
12. How do I determine which pricing option suits my needs best?
The pricing options vary based on user requirements and access needs. Individual users may opt for single-user licenses, while businesses requiring broader access may choose multi-user or enterprise licenses for cost-effective access to the report.
13. Are there any additional resources or data provided in the Online Travel Industry report?
While the report offers comprehensive insights, it's advisable to review the specific contents or supplementary materials provided to ascertain if additional resources or data are available.
14. How can I stay updated on further developments or reports in the Online Travel Industry?
To stay informed about further developments, trends, and reports in the Online Travel Industry, consider subscribing to industry newsletters, following relevant companies and organizations, or regularly checking reputable industry news sources and publications.
Methodology
Step 1 - Identification of Relevant Samples Size from Population Database


Step 2 - Approaches for Defining Global Market Size (Value, Volume* & Price*)

Note*: In applicable scenarios
Step 3 - Data Sources
Primary Research
- Web Analytics
- Survey Reports
- Research Institute
- Latest Research Reports
- Opinion Leaders
Secondary Research
- Annual Reports
- White Paper
- Latest Press Release
- Industry Association
- Paid Database
- Investor Presentations

Step 4 - Data Triangulation
Involves using different sources of information in order to increase the validity of a study
These sources are likely to be stakeholders in a program - participants, other researchers, program staff, other community members, and so on.
Then we put all data in single framework & apply various statistical tools to find out the dynamic on the market.
During the analysis stage, feedback from the stakeholder groups would be compared to determine areas of agreement as well as areas of divergence