

Key Insights
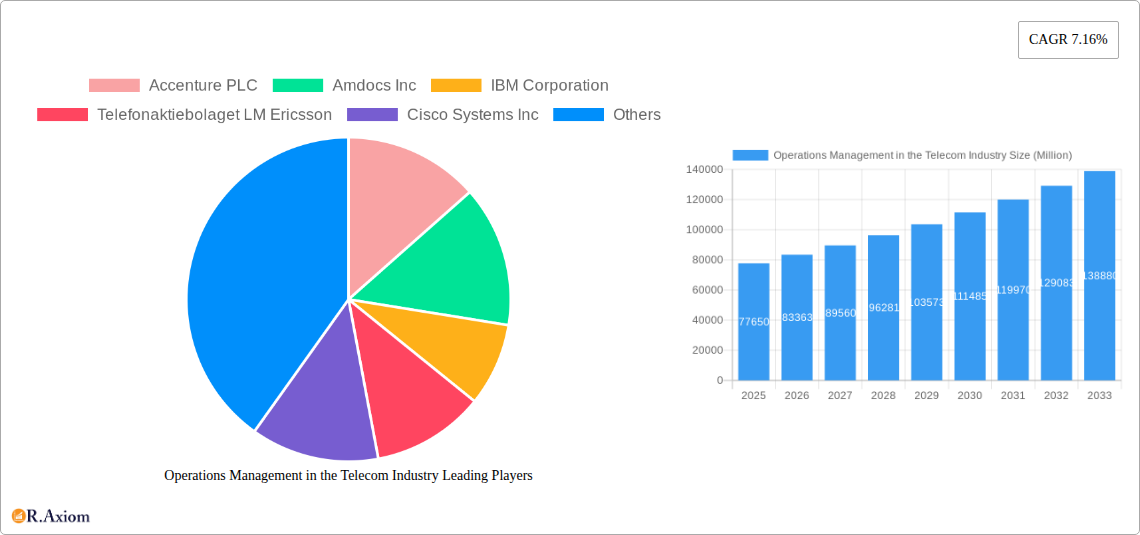
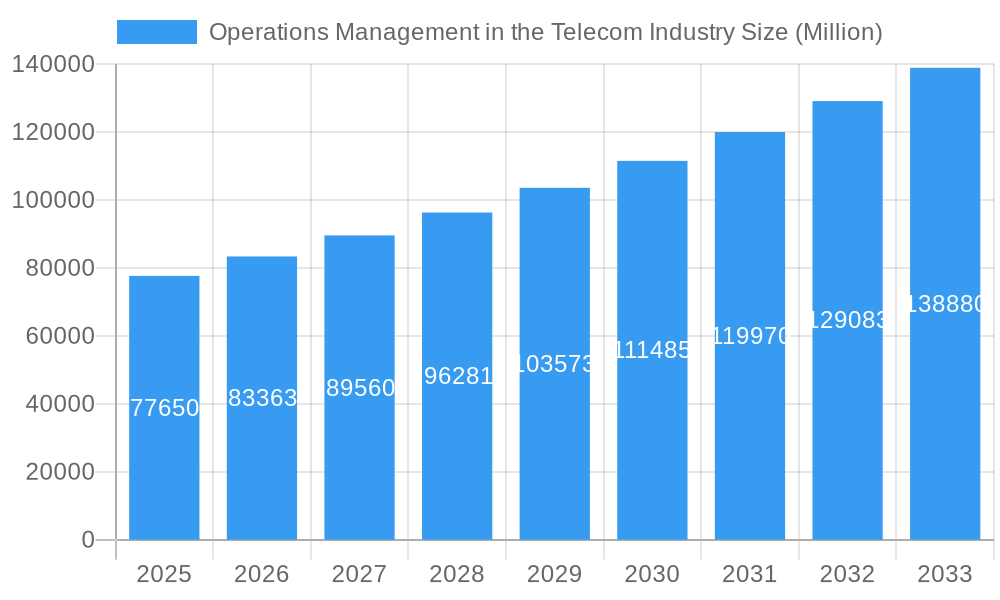
The global telecom operations management market, valued at $77.65 billion in 2025, is projected to experience robust growth, driven by the increasing demand for efficient network management, improved customer experience, and the rise of 5G technology. The Compound Annual Growth Rate (CAGR) of 7.16% from 2025 to 2033 indicates a significant expansion, fueled by the adoption of advanced analytics, automation, and AI-powered solutions for network optimization, service assurance, and resource allocation. Cloud-based deployment models are gaining significant traction, offering scalability, flexibility, and cost-effectiveness compared to on-premise solutions. The software segment, including inventory management systems and other specialized tools, dominates the market due to its ability to streamline operations and enhance decision-making. Key players like Accenture, IBM, Ericsson, and Cisco are actively investing in research and development, expanding their product portfolios, and forging strategic partnerships to capitalize on the market's growth potential. Geographic expansion is another prominent trend, with North America and Europe currently holding significant market share, while Asia-Pacific is expected to exhibit substantial growth driven by increasing digital adoption and infrastructure investments. However, challenges such as high initial investment costs for new technologies and the complexities of integrating legacy systems with modern solutions pose potential restraints.
Operations Management in the Telecom Industry Market Size (In Billion)
The market segmentation reveals that the cloud-based deployment model is rapidly gaining market share, driven by its inherent scalability and cost-effectiveness. The software segment, particularly inventory management solutions, is crucial for optimizing resource utilization and reducing operational inefficiencies. The strong presence of established players coupled with the emergence of innovative startups indicates a competitive landscape. Future growth will be further stimulated by the expanding adoption of IoT, the increasing volume of data needing management, and the continuous demand for enhanced network security. Regional variations are expected, with developing economies presenting attractive opportunities for market expansion, while mature markets focus on optimizing existing infrastructure and upgrading technologies. The industry’s focus will remain on delivering improved customer experience and service assurance, utilizing AI and machine learning for proactive issue identification and resolution, leading to overall enhanced operational efficiency and profitability.
Operations Management in the Telecom Industry Company Market Share
Operations Management in the Telecom Industry: A Comprehensive Market Report (2019-2033)
This in-depth report provides a comprehensive analysis of the Operations Management in the Telecom Industry market, covering market size, growth drivers, competitive landscape, and future outlook. The study period spans from 2019 to 2033, with 2025 as the base and estimated year. The report offers actionable insights for industry stakeholders, including telecom operators, technology vendors, and investors. With a predicted market value exceeding $XX Million by 2033, this report is essential for navigating the complexities of this rapidly evolving sector.
Operations Management in the Telecom Industry Market Concentration & Innovation
This section analyzes the market concentration, innovation drivers, regulatory landscape, and competitive dynamics within the telecom operations management sector. The market is characterized by a moderate level of concentration, with key players like Accenture PLC, Amdocs Inc., and IBM Corporation holding significant market share, estimated at a combined xx% in 2025. However, the presence of numerous niche players and ongoing M&A activity points towards a dynamic competitive environment.
- Market Share: Accenture PLC (xx%), Amdocs Inc. (xx%), IBM Corporation (xx%), Ericsson (xx%), Others (xx%). These figures are estimates based on 2025 data.
- M&A Activity: The total value of M&A deals in the sector from 2019 to 2024 is estimated at $XX Million, reflecting strategic consolidation and expansion efforts by major players. Significant deals include (examples will be detailed in the full report).
- Innovation Drivers: The increasing adoption of 5G technology, cloud computing, and AI/ML are driving significant innovation in telecom operations management. These technologies are enabling automation, enhanced network efficiency, and improved customer experience.
- Regulatory Frameworks: Stringent regulatory frameworks around data privacy, network security, and spectrum allocation influence operational strategies and investment decisions. Regional variations in these frameworks create diverse market conditions.
- Product Substitutes: The emergence of alternative technologies, such as software-defined networking (SDN) and network function virtualization (NFV), pose a potential threat to traditional operations management solutions.
- End-User Trends: The demand for personalized services, increased network capacity, and seamless connectivity is driving the need for advanced operations management solutions.
Operations Management in the Telecom Industry Industry Trends & Insights
The telecom operations management market is experiencing robust growth, driven by several key factors. The Compound Annual Growth Rate (CAGR) is projected to be xx% during the forecast period (2025-2033). Market penetration of advanced solutions, such as AI-powered network monitoring and automation tools, is steadily increasing.
This growth is fuelled by the expansion of 5G networks globally, the rising adoption of cloud-based solutions, and increasing demand for improved network performance and security. The market is also witnessing a shift towards software-defined and virtualized networks, leading to greater flexibility and efficiency in network operations. Furthermore, the increasing complexity of telecom networks and the need for real-time network monitoring are driving demand for sophisticated operations management tools. Competitive dynamics are intense, with established players facing challenges from agile startups and new entrants offering innovative solutions.
Dominant Markets & Segments in Operations Management in the Telecom Industry
North America currently holds the largest market share in the telecom operations management sector, driven by high technological adoption, strong investment in infrastructure, and the presence of major telecom operators and technology vendors.
- Key Drivers in North America:
- Advanced technological infrastructure.
- High level of digital adoption among consumers and businesses.
- Favorable regulatory environment.
- Substantial investments in 5G deployments.
- Segment Dominance:
- By Deployment: Cloud-based deployments are experiencing faster growth compared to on-premise solutions due to their scalability and cost-effectiveness.
- By Type: Software-based operations management solutions are gaining traction over traditional, hardware-centric approaches. This trend is facilitated by the increasing use of cloud-based services.
- By Service: Inventory management and other support services are vital components within the wider operational landscape and contribute significantly to overall market value.
(Detailed analysis of other regions and their growth drivers will be included in the full report.)
Operations Management in the Telecom Industry Product Developments
Recent product innovations focus on enhancing network automation, predictive analytics, and AI-driven insights. These advancements aim to improve operational efficiency, reduce costs, and enhance network performance. Key innovations include AI-powered network monitoring, automated service assurance, and self-healing network capabilities. The market is witnessing a shift towards integrated solutions that combine multiple functionalities into a single platform, offering improved usability and cost-efficiency. The success of these products depends on their ability to address the specific needs of telecom operators and seamlessly integrate with existing network infrastructure.
Report Scope & Segmentation Analysis
This report segments the Operations Management in the Telecom Industry market by deployment (on-premise, cloud), type (software, inventory management, others), and service.
By Deployment: The cloud segment is projected to experience significant growth over the forecast period, driven by the scalability and cost-effectiveness of cloud-based solutions. The on-premise segment maintains a significant market share, particularly among enterprises with stringent security requirements.
By Type: Software solutions dominate the market, offering flexible and scalable operational management capabilities. Inventory management solutions are critical for efficient network operations, while other services contribute to a comprehensive operational solution.
By Service: The market is segmented by various support services, reflecting the diverse nature of operational management tasks in the telecom sector.
Key Drivers of Operations Management in the Telecom Industry Growth
The growth of the telecom operations management market is primarily driven by the following factors:
Technological advancements: The adoption of 5G, cloud computing, AI, and machine learning is transforming network operations and creating demand for sophisticated management solutions.
Economic factors: The increasing demand for seamless connectivity and the growth of data consumption are driving investment in network infrastructure and operations management solutions.
Regulatory changes: Government initiatives to promote digital transformation and enhance network security are also contributing to market growth.
Challenges in the Operations Management in the Telecom Industry Sector
The telecom operations management sector faces several challenges:
Regulatory hurdles: Complex regulatory frameworks and compliance requirements can impede market growth and increase operational costs.
Supply chain issues: Disruptions in the global supply chain can affect the availability of hardware and software components, impacting the deployment of operations management solutions.
Competitive pressures: The intense competition among numerous technology vendors and service providers puts pressure on pricing and margins.
Emerging Opportunities in Operations Management in the Telecom Industry
Several emerging opportunities exist for growth in the telecom operations management market:
Growth in developing markets: Expanding telecom infrastructure in developing economies presents significant opportunities for operations management vendors.
Adoption of new technologies: Emerging technologies like edge computing, IoT, and blockchain present new areas for innovation and growth.
Focus on sustainability: Demand for environmentally friendly operations management solutions will provide opportunities for companies that prioritize sustainability.
Leading Players in the Operations Management in the Telecom Industry Market
Key Developments in Operations Management in the Telecom Industry Industry
April 2022: The Ministry of Railways and C-DOT signed an MoU to modernize Indian Railways' telecommunications, boosting demand for advanced solutions in the public safety and security sector.
November 2021: AWS launched AWS Private 5G, a fully managed private cellular service, expanding enterprise adoption of 5G technology and creating new opportunities for operations management vendors.
Strategic Outlook for Operations Management in the Telecom Industry Market
The future of the telecom operations management market looks bright, driven by continued technological innovation, expanding 5G deployments, and growing demand for enhanced network performance and security. The market is expected to witness sustained growth, with significant opportunities for companies that can provide innovative, scalable, and cost-effective solutions. The increasing focus on automation, AI, and cloud-based solutions will further shape market dynamics, driving efficiency and creating new possibilities within the telecom sector.
Operations Management in the Telecom Industry Segmentation
-
1. Deployment
- 1.1. On-premise
- 1.2. Cloud
-
2. Type
-
2.1. Software
- 2.1.1. Network Management
- 2.1.2. Customer and Product Management
- 2.1.3. Revenue Management
- 2.1.4. Inventory Management and Others
- 2.2. Services
-
2.1. Software
Operations Management in the Telecom Industry Segmentation By Geography
- 1. North America
- 2. Europe
- 3. Asia Pacific
- 4. Latin America
- 5. Middle East and Africa
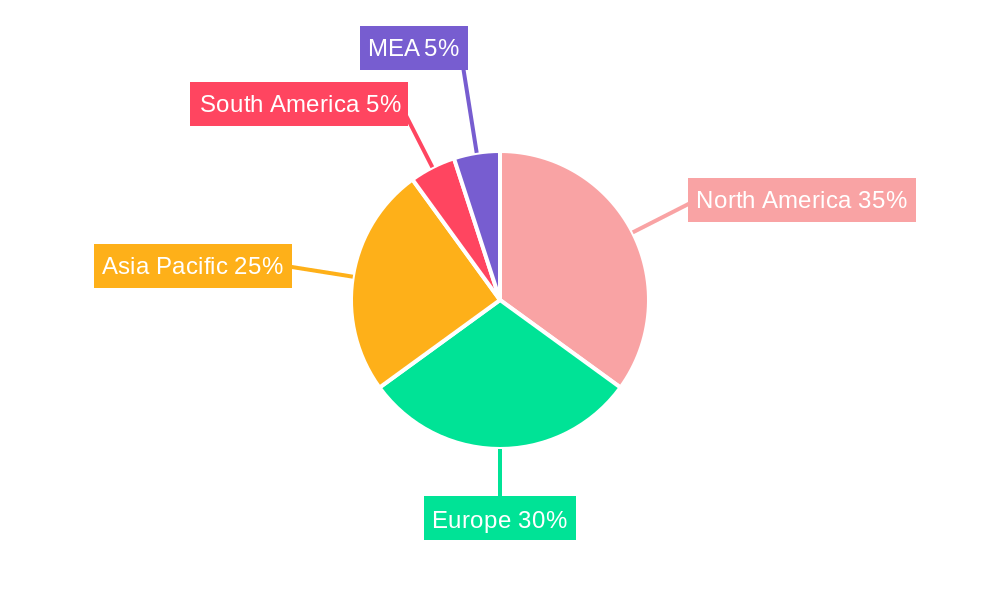
Operations Management in the Telecom Industry Regional Market Share
Geographic Coverage of Operations Management in the Telecom Industry
Operations Management in the Telecom Industry REPORT HIGHLIGHTS
| Aspects | Details |
|---|---|
| Study Period | 2020-2034 |
| Base Year | 2025 |
| Estimated Year | 2026 |
| Forecast Period | 2026-2034 |
| Historical Period | 2020-2025 |
| Growth Rate | CAGR of 7.16% from 2020-2034 |
| Segmentation |
|
Table of Contents
- 1. Introduction
- 1.1. Research Scope
- 1.2. Market Segmentation
- 1.3. Research Objective
- 1.4. Definitions and Assumptions
- 2. Executive Summary
- 2.1. Market Snapshot
- 3. Market Dynamics
- 3.1. Market Drivers
- 3.2. Market Restrains
- 3.3. Market Trends
- 3.4. Market Opportunities
- 4. Market Factor Analysis
- 4.1. Porters Five Forces
- 4.1.1. Bargaining Power of Suppliers
- 4.1.2. Bargaining Power of Buyers
- 4.1.3. Threat of New Entrants
- 4.1.4. Threat of Substitutes
- 4.1.5. Competitive Rivalry
- 4.2. PESTEL analysis
- 4.3. BCG Analysis
- 4.3.1. Stars (High Growth, High Market Share)
- 4.3.2. Cash Cows (Low Growth, High Market Share)
- 4.3.3. Question Mark (High Growth, Low Market Share)
- 4.3.4. Dogs (Low Growth, Low Market Share)
- 4.4. Ansoff Matrix Analysis
- 4.5. Supply Chain Analysis
- 4.6. Regulatory Landscape
- 4.7. Current Market Potential and Opportunity Assessment (TAM–SAM–SOM Framework)
- 4.8. RAX Analyst Note
- 4.1. Porters Five Forces
- 5. Market Analysis, Insights and Forecast 2021-2033
- 5.1. Market Analysis, Insights and Forecast - by Deployment
- 5.1.1. On-premise
- 5.1.2. Cloud
- 5.2. Market Analysis, Insights and Forecast - by Type
- 5.2.1. Software
- 5.2.1.1. Network Management
- 5.2.1.2. Customer and Product Management
- 5.2.1.3. Revenue Management
- 5.2.1.4. Inventory Management and Others
- 5.2.2. Services
- 5.2.1. Software
- 5.3. Market Analysis, Insights and Forecast - by Region
- 5.3.1. North America
- 5.3.2. Europe
- 5.3.3. Asia Pacific
- 5.3.4. Latin America
- 5.3.5. Middle East and Africa
- 5.1. Market Analysis, Insights and Forecast - by Deployment
- 6. Global Operations Management in the Telecom Industry Analysis, Insights and Forecast, 2021-2033
- 6.1. Market Analysis, Insights and Forecast - by Deployment
- 6.1.1. On-premise
- 6.1.2. Cloud
- 6.2. Market Analysis, Insights and Forecast - by Type
- 6.2.1. Software
- 6.2.1.1. Network Management
- 6.2.1.2. Customer and Product Management
- 6.2.1.3. Revenue Management
- 6.2.1.4. Inventory Management and Others
- 6.2.2. Services
- 6.2.1. Software
- 6.1. Market Analysis, Insights and Forecast - by Deployment
- 7. North America Operations Management in the Telecom Industry Analysis, Insights and Forecast, 2020-2032
- 7.1. Market Analysis, Insights and Forecast - by Deployment
- 7.1.1. On-premise
- 7.1.2. Cloud
- 7.2. Market Analysis, Insights and Forecast - by Type
- 7.2.1. Software
- 7.2.1.1. Network Management
- 7.2.1.2. Customer and Product Management
- 7.2.1.3. Revenue Management
- 7.2.1.4. Inventory Management and Others
- 7.2.2. Services
- 7.2.1. Software
- 7.1. Market Analysis, Insights and Forecast - by Deployment
- 8. Europe Operations Management in the Telecom Industry Analysis, Insights and Forecast, 2020-2032
- 8.1. Market Analysis, Insights and Forecast - by Deployment
- 8.1.1. On-premise
- 8.1.2. Cloud
- 8.2. Market Analysis, Insights and Forecast - by Type
- 8.2.1. Software
- 8.2.1.1. Network Management
- 8.2.1.2. Customer and Product Management
- 8.2.1.3. Revenue Management
- 8.2.1.4. Inventory Management and Others
- 8.2.2. Services
- 8.2.1. Software
- 8.1. Market Analysis, Insights and Forecast - by Deployment
- 9. Asia Pacific Operations Management in the Telecom Industry Analysis, Insights and Forecast, 2020-2032
- 9.1. Market Analysis, Insights and Forecast - by Deployment
- 9.1.1. On-premise
- 9.1.2. Cloud
- 9.2. Market Analysis, Insights and Forecast - by Type
- 9.2.1. Software
- 9.2.1.1. Network Management
- 9.2.1.2. Customer and Product Management
- 9.2.1.3. Revenue Management
- 9.2.1.4. Inventory Management and Others
- 9.2.2. Services
- 9.2.1. Software
- 9.1. Market Analysis, Insights and Forecast - by Deployment
- 10. Latin America Operations Management in the Telecom Industry Analysis, Insights and Forecast, 2020-2032
- 10.1. Market Analysis, Insights and Forecast - by Deployment
- 10.1.1. On-premise
- 10.1.2. Cloud
- 10.2. Market Analysis, Insights and Forecast - by Type
- 10.2.1. Software
- 10.2.1.1. Network Management
- 10.2.1.2. Customer and Product Management
- 10.2.1.3. Revenue Management
- 10.2.1.4. Inventory Management and Others
- 10.2.2. Services
- 10.2.1. Software
- 10.1. Market Analysis, Insights and Forecast - by Deployment
- 11. Middle East and Africa Operations Management in the Telecom Industry Analysis, Insights and Forecast, 2020-2032
- 11.1. Market Analysis, Insights and Forecast - by Deployment
- 11.1.1. On-premise
- 11.1.2. Cloud
- 11.2. Market Analysis, Insights and Forecast - by Type
- 11.2.1. Software
- 11.2.1.1. Network Management
- 11.2.1.2. Customer and Product Management
- 11.2.1.3. Revenue Management
- 11.2.1.4. Inventory Management and Others
- 11.2.2. Services
- 11.2.1. Software
- 11.1. Market Analysis, Insights and Forecast - by Deployment
- 12. Competitive Analysis
- 12.1. Company Profiles
- 12.1.1 Accenture PLC
- 12.1.1.1. Company Overview
- 12.1.1.2. Products
- 12.1.1.3. Company Financials
- 12.1.1.4. SWOT Analysis
- 12.1.2 Amdocs Inc
- 12.1.2.1. Company Overview
- 12.1.2.2. Products
- 12.1.2.3. Company Financials
- 12.1.2.4. SWOT Analysis
- 12.1.3 IBM Corporation
- 12.1.3.1. Company Overview
- 12.1.3.2. Products
- 12.1.3.3. Company Financials
- 12.1.3.4. SWOT Analysis
- 12.1.4 Telefonaktiebolaget LM Ericsson
- 12.1.4.1. Company Overview
- 12.1.4.2. Products
- 12.1.4.3. Company Financials
- 12.1.4.4. SWOT Analysis
- 12.1.5 Cisco Systems Inc
- 12.1.5.1. Company Overview
- 12.1.5.2. Products
- 12.1.5.3. Company Financials
- 12.1.5.4. SWOT Analysis
- 12.1.6 Hewlett Packard Enterprise Development LP
- 12.1.6.1. Company Overview
- 12.1.6.2. Products
- 12.1.6.3. Company Financials
- 12.1.6.4. SWOT Analysis
- 12.1.7 ServiceNow Inc
- 12.1.7.1. Company Overview
- 12.1.7.2. Products
- 12.1.7.3. Company Financials
- 12.1.7.4. SWOT Analysis
- 12.1.8 NEC Corporation
- 12.1.8.1. Company Overview
- 12.1.8.2. Products
- 12.1.8.3. Company Financials
- 12.1.8.4. SWOT Analysis
- 12.1.9 ZTE Corporation
- 12.1.9.1. Company Overview
- 12.1.9.2. Products
- 12.1.9.3. Company Financials
- 12.1.9.4. SWOT Analysis
- 12.1.10 Oracle Corporation
- 12.1.10.1. Company Overview
- 12.1.10.2. Products
- 12.1.10.3. Company Financials
- 12.1.10.4. SWOT Analysis
- 12.1.11 Comarch SA
- 12.1.11.1. Company Overview
- 12.1.11.2. Products
- 12.1.11.3. Company Financials
- 12.1.11.4. SWOT Analysis
- 12.1.12 Nokia Corporation
- 12.1.12.1. Company Overview
- 12.1.12.2. Products
- 12.1.12.3. Company Financials
- 12.1.12.4. SWOT Analysis
- 12.1.13 TATA Consultancy Services Limited*List Not Exhaustive
- 12.1.13.1. Company Overview
- 12.1.13.2. Products
- 12.1.13.3. Company Financials
- 12.1.13.4. SWOT Analysis
- 12.1.14 SAP SE
- 12.1.14.1. Company Overview
- 12.1.14.2. Products
- 12.1.14.3. Company Financials
- 12.1.14.4. SWOT Analysis
- 12.1.15 Netcracker Technology Corp
- 12.1.15.1. Company Overview
- 12.1.15.2. Products
- 12.1.15.3. Company Financials
- 12.1.15.4. SWOT Analysis
- 12.1.1 Accenture PLC
- 12.2. Market Entropy
- 12.2.1 Company's Key Areas Served
- 12.2.2 Recent Developments
- 12.3. Company Market Share Analysis 2025
- 12.3.1 Top 5 Companies Market Share Analysis
- 12.3.2 Top 3 Companies Market Share Analysis
- 12.4. List of Potential Customers
- 13. Research Methodology
List of Figures
- Figure 1: Global Operations Management in the Telecom Industry Revenue Breakdown (Million, %) by Region 2025 & 2033
- Figure 2: North America Operations Management in the Telecom Industry Revenue (Million), by Deployment 2025 & 2033
- Figure 3: North America Operations Management in the Telecom Industry Revenue Share (%), by Deployment 2025 & 2033
- Figure 4: North America Operations Management in the Telecom Industry Revenue (Million), by Type 2025 & 2033
- Figure 5: North America Operations Management in the Telecom Industry Revenue Share (%), by Type 2025 & 2033
- Figure 6: North America Operations Management in the Telecom Industry Revenue (Million), by Country 2025 & 2033
- Figure 7: North America Operations Management in the Telecom Industry Revenue Share (%), by Country 2025 & 2033
- Figure 8: Europe Operations Management in the Telecom Industry Revenue (Million), by Deployment 2025 & 2033
- Figure 9: Europe Operations Management in the Telecom Industry Revenue Share (%), by Deployment 2025 & 2033
- Figure 10: Europe Operations Management in the Telecom Industry Revenue (Million), by Type 2025 & 2033
- Figure 11: Europe Operations Management in the Telecom Industry Revenue Share (%), by Type 2025 & 2033
- Figure 12: Europe Operations Management in the Telecom Industry Revenue (Million), by Country 2025 & 2033
- Figure 13: Europe Operations Management in the Telecom Industry Revenue Share (%), by Country 2025 & 2033
- Figure 14: Asia Pacific Operations Management in the Telecom Industry Revenue (Million), by Deployment 2025 & 2033
- Figure 15: Asia Pacific Operations Management in the Telecom Industry Revenue Share (%), by Deployment 2025 & 2033
- Figure 16: Asia Pacific Operations Management in the Telecom Industry Revenue (Million), by Type 2025 & 2033
- Figure 17: Asia Pacific Operations Management in the Telecom Industry Revenue Share (%), by Type 2025 & 2033
- Figure 18: Asia Pacific Operations Management in the Telecom Industry Revenue (Million), by Country 2025 & 2033
- Figure 19: Asia Pacific Operations Management in the Telecom Industry Revenue Share (%), by Country 2025 & 2033
- Figure 20: Latin America Operations Management in the Telecom Industry Revenue (Million), by Deployment 2025 & 2033
- Figure 21: Latin America Operations Management in the Telecom Industry Revenue Share (%), by Deployment 2025 & 2033
- Figure 22: Latin America Operations Management in the Telecom Industry Revenue (Million), by Type 2025 & 2033
- Figure 23: Latin America Operations Management in the Telecom Industry Revenue Share (%), by Type 2025 & 2033
- Figure 24: Latin America Operations Management in the Telecom Industry Revenue (Million), by Country 2025 & 2033
- Figure 25: Latin America Operations Management in the Telecom Industry Revenue Share (%), by Country 2025 & 2033
- Figure 26: Middle East and Africa Operations Management in the Telecom Industry Revenue (Million), by Deployment 2025 & 2033
- Figure 27: Middle East and Africa Operations Management in the Telecom Industry Revenue Share (%), by Deployment 2025 & 2033
- Figure 28: Middle East and Africa Operations Management in the Telecom Industry Revenue (Million), by Type 2025 & 2033
- Figure 29: Middle East and Africa Operations Management in the Telecom Industry Revenue Share (%), by Type 2025 & 2033
- Figure 30: Middle East and Africa Operations Management in the Telecom Industry Revenue (Million), by Country 2025 & 2033
- Figure 31: Middle East and Africa Operations Management in the Telecom Industry Revenue Share (%), by Country 2025 & 2033
List of Tables
- Table 1: Global Operations Management in the Telecom Industry Revenue Million Forecast, by Deployment 2020 & 2033
- Table 2: Global Operations Management in the Telecom Industry Revenue Million Forecast, by Type 2020 & 2033
- Table 3: Global Operations Management in the Telecom Industry Revenue Million Forecast, by Region 2020 & 2033
- Table 4: Global Operations Management in the Telecom Industry Revenue Million Forecast, by Deployment 2020 & 2033
- Table 5: Global Operations Management in the Telecom Industry Revenue Million Forecast, by Type 2020 & 2033
- Table 6: Global Operations Management in the Telecom Industry Revenue Million Forecast, by Country 2020 & 2033
- Table 7: Global Operations Management in the Telecom Industry Revenue Million Forecast, by Deployment 2020 & 2033
- Table 8: Global Operations Management in the Telecom Industry Revenue Million Forecast, by Type 2020 & 2033
- Table 9: Global Operations Management in the Telecom Industry Revenue Million Forecast, by Country 2020 & 2033
- Table 10: Global Operations Management in the Telecom Industry Revenue Million Forecast, by Deployment 2020 & 2033
- Table 11: Global Operations Management in the Telecom Industry Revenue Million Forecast, by Type 2020 & 2033
- Table 12: Global Operations Management in the Telecom Industry Revenue Million Forecast, by Country 2020 & 2033
- Table 13: Global Operations Management in the Telecom Industry Revenue Million Forecast, by Deployment 2020 & 2033
- Table 14: Global Operations Management in the Telecom Industry Revenue Million Forecast, by Type 2020 & 2033
- Table 15: Global Operations Management in the Telecom Industry Revenue Million Forecast, by Country 2020 & 2033
- Table 16: Global Operations Management in the Telecom Industry Revenue Million Forecast, by Deployment 2020 & 2033
- Table 17: Global Operations Management in the Telecom Industry Revenue Million Forecast, by Type 2020 & 2033
- Table 18: Global Operations Management in the Telecom Industry Revenue Million Forecast, by Country 2020 & 2033
Frequently Asked Questions
1. What is the projected Compound Annual Growth Rate (CAGR) of the Operations Management in the Telecom Industry?
The projected CAGR is approximately 7.16%.
2. Which companies are prominent players in the Operations Management in the Telecom Industry?
Key companies in the market include Accenture PLC, Amdocs Inc, IBM Corporation, Telefonaktiebolaget LM Ericsson, Cisco Systems Inc, Hewlett Packard Enterprise Development LP, ServiceNow Inc, NEC Corporation, ZTE Corporation, Oracle Corporation, Comarch SA, Nokia Corporation, TATA Consultancy Services Limited*List Not Exhaustive, SAP SE, Netcracker Technology Corp.
3. What are the main segments of the Operations Management in the Telecom Industry?
The market segments include Deployment, Type.
4. Can you provide details about the market size?
The market size is estimated to be USD 77.65 Million as of 2022.
5. What are some drivers contributing to market growth?
Increasing Operational Costs and Complexity.
6. What are the notable trends driving market growth?
Cloud is Expected to Witness Significant Growth.
7. Are there any restraints impacting market growth?
; Stringent Government Regulations on Data Security.
8. Can you provide examples of recent developments in the market?
April 2022 - The Ministry of Railways and the Centre for Development of Telematics (C-DOT) have signed an MoU to modernize telecommunication in Indian Railways for public safety and security services. The MoU was signed for coordination, resource sharing, and to deliver and implement C-DOT's telecom solutions and services in the railway's network.
9. What pricing options are available for accessing the report?
Pricing options include single-user, multi-user, and enterprise licenses priced at USD 4750, USD 5250, and USD 8750 respectively.
10. Is the market size provided in terms of value or volume?
The market size is provided in terms of value, measured in Million.
11. Are there any specific market keywords associated with the report?
Yes, the market keyword associated with the report is "Operations Management in the Telecom Industry," which aids in identifying and referencing the specific market segment covered.
12. How do I determine which pricing option suits my needs best?
The pricing options vary based on user requirements and access needs. Individual users may opt for single-user licenses, while businesses requiring broader access may choose multi-user or enterprise licenses for cost-effective access to the report.
13. Are there any additional resources or data provided in the Operations Management in the Telecom Industry report?
While the report offers comprehensive insights, it's advisable to review the specific contents or supplementary materials provided to ascertain if additional resources or data are available.
14. How can I stay updated on further developments or reports in the Operations Management in the Telecom Industry?
To stay informed about further developments, trends, and reports in the Operations Management in the Telecom Industry, consider subscribing to industry newsletters, following relevant companies and organizations, or regularly checking reputable industry news sources and publications.
Methodology
Step 1 - Identification of Relevant Samples Size from Population Database


Step 2 - Approaches for Defining Global Market Size (Value, Volume* & Price*)

Note*: In applicable scenarios
Step 3 - Data Sources
Primary Research
- Web Analytics
- Survey Reports
- Research Institute
- Latest Research Reports
- Opinion Leaders
Secondary Research
- Annual Reports
- White Paper
- Latest Press Release
- Industry Association
- Paid Database
- Investor Presentations

Step 4 - Data Triangulation
Involves using different sources of information in order to increase the validity of a study
These sources are likely to be stakeholders in a program - participants, other researchers, program staff, other community members, and so on.
Then we put all data in single framework & apply various statistical tools to find out the dynamic on the market.
During the analysis stage, feedback from the stakeholder groups would be compared to determine areas of agreement as well as areas of divergence