

Key Insights
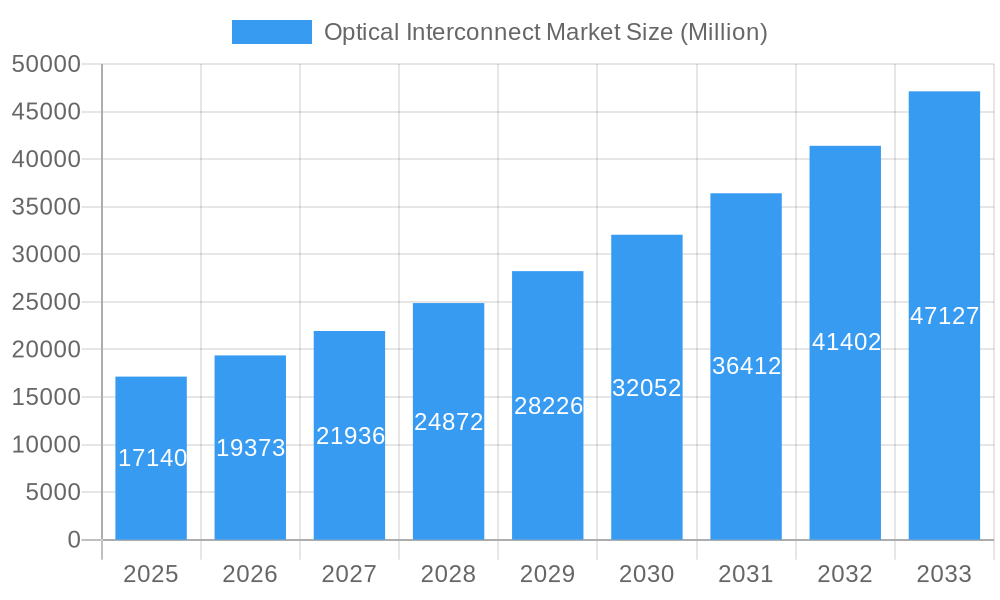
The optical interconnect market, valued at $17.14 billion in 2025, is experiencing robust growth, projected to expand at a compound annual growth rate (CAGR) of 13.15% from 2025 to 2033. This expansion is driven primarily by the increasing demand for high-bandwidth connectivity across various sectors, including telecommunications and data centers. The proliferation of 5G networks, cloud computing infrastructure expansion, and the growing adoption of high-performance computing (HPC) are key factors fueling market growth. Furthermore, advancements in optical transceiver technology, leading to smaller, more energy-efficient, and higher-capacity devices, are contributing significantly to market expansion. The market segmentation reveals strong growth across all types of optical interconnects, with optical transceivers maintaining a dominant market share due to their widespread application in various networking architectures. Active Optical Cables (AOCs) and Embedded Optical Modules (EOMs) are experiencing significant growth, driven by their ease of use and suitability for high-density deployments. Geographically, North America and Asia Pacific currently hold the largest market share, with significant growth potential in developing regions like Southeast Asia and the Middle East and Africa, driven by increasing investments in digital infrastructure.
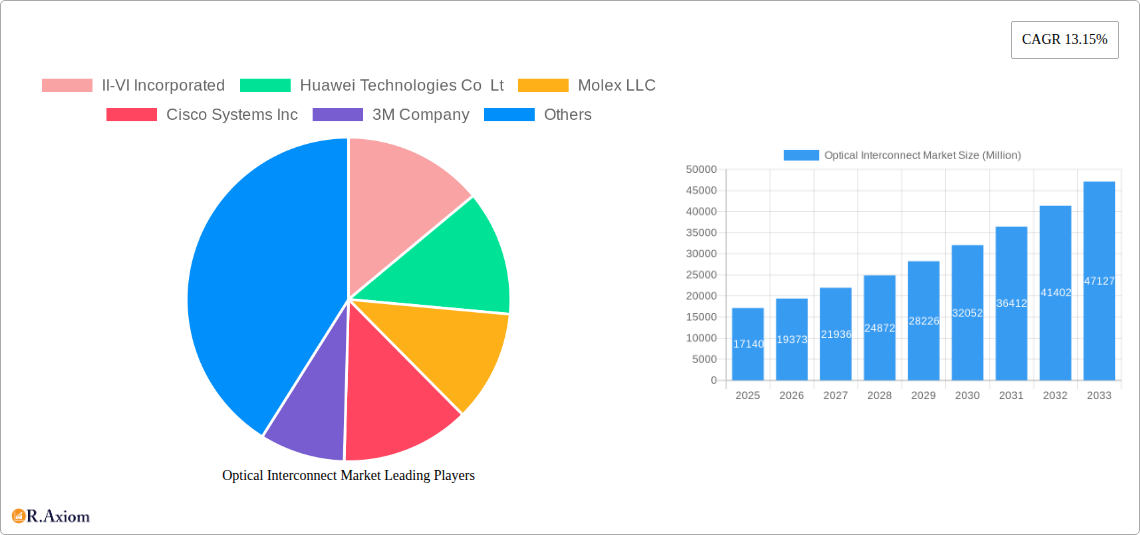
Optical Interconnect Market Market Size (In Billion)
The competitive landscape is marked by the presence of established players like II-VI Incorporated, Huawei Technologies, Molex, Cisco Systems, and 3M, alongside emerging innovative companies. These companies are continuously engaged in research and development to improve the performance, cost-effectiveness, and sustainability of their products. Competition is intensifying with a focus on technological innovation, strategic partnerships, and mergers and acquisitions to gain a competitive edge. While the market faces certain restraints, such as the high initial investment costs associated with deploying optical interconnect solutions and potential supply chain disruptions, the overall long-term outlook for the optical interconnect market remains highly positive, propelled by the relentless demand for faster and more reliable data transmission capabilities. Future growth will be significantly influenced by the ongoing advancements in data center technology, the expansion of 5G and beyond, and the increasing need for high-bandwidth connectivity across various industries.
Optical Interconnect Market Company Market Share
Optical Interconnect Market: A Comprehensive Report (2019-2033)
This in-depth report provides a comprehensive analysis of the Optical Interconnect Market, encompassing historical data (2019-2024), current estimations (2025), and future projections (2025-2033). It delves into market segmentation, competitive dynamics, technological advancements, and key growth drivers, offering valuable insights for industry stakeholders, investors, and strategic decision-makers. The report features a detailed examination of key players like II-VI Incorporated, Huawei Technologies Co Lt, Molex LLC, Cisco Systems Inc, 3M Company, Amphenol Corporation, TE Connectivity Ltd, Go!Foton Inc, Corning Incorporated, and Sumitomo Electric Industries Ltd, and analyzes market segments such as Optical Transceivers, Active Optical Cables (AOCs), and Embedded Optical Modules (EOMs) across Telecommunication and Data Communication applications.
Optical Interconnect Market Market Concentration & Innovation
The Optical Interconnect market exhibits a moderately concentrated landscape, with a few dominant players controlling a significant market share. However, the presence of numerous smaller, specialized companies fosters innovation and competition. Market share dynamics are influenced by factors including technological advancements, strategic partnerships, mergers and acquisitions (M&A), and regulatory changes. Recent M&A activity has involved deals valued at approximately xx Million, primarily driven by the pursuit of enhanced technological capabilities and expanded market reach. The market is characterized by continuous innovation, with companies focusing on improving data transmission speeds, reducing power consumption, and enhancing the miniaturization of optical components. Regulatory frameworks, such as those related to data security and environmental standards, significantly impact the market. The emergence of substitute technologies, such as advanced copper cabling solutions, presents a challenge, although the advantages of optical interconnects in terms of bandwidth and transmission distance largely maintain its dominance. End-user trends, particularly the growing demand for high-speed data transmission in data centers and telecommunications networks, are a significant driver of market growth.
- Market Concentration: Moderately concentrated, with top 5 players holding approximately xx% market share.
- Innovation Drivers: Demand for higher bandwidth, lower latency, and miniaturization.
- M&A Activity: Significant activity in recent years, with deals valued at approximately xx Million.
- Regulatory Frameworks: Influence product development and market access.
- Product Substitutes: Advanced copper cabling poses a limited threat.
- End-User Trends: Growing demand for high-speed data transmission in data centers and 5G networks.
Optical Interconnect Market Industry Trends & Insights
The Optical Interconnect market is experiencing robust growth, driven by the escalating demand for high-bandwidth connectivity across various sectors. The market is projected to exhibit a Compound Annual Growth Rate (CAGR) of xx% during the forecast period (2025-2033). Technological advancements, such as the adoption of coherent optical transmission and silicon photonics, are significantly boosting market expansion. The increasing penetration of cloud computing and the Internet of Things (IoT) is further fueling demand for advanced optical interconnect solutions. Consumer preference for seamless and high-speed connectivity is a key driver. Competitive dynamics are intense, with companies continuously striving to improve product performance, reduce costs, and expand market share through innovation and strategic partnerships. Market penetration of optical interconnects in emerging applications, such as automotive and industrial automation, is steadily increasing. The shift towards higher data rates (400G, 800G, and beyond) is a major factor driving market growth. Increased adoption of advanced packaging technologies is also contributing to market expansion.
Dominant Markets & Segments in Optical Interconnect Market
The Asia-Pacific region is currently the dominant market for optical interconnects, driven by rapid infrastructure development and the burgeoning demand for data centers in countries like China and Japan. North America and Europe also represent significant markets. Among the segments, Optical Transceivers hold the largest market share due to their widespread adoption across various applications.
- Leading Region: Asia-Pacific
- Key Drivers: Rapid infrastructure development, growing data center deployments, and strong government support for digitalization initiatives.
- Dominant Segment (Type): Optical Transceivers
- Key Drivers: Widespread adoption in various applications, cost-effectiveness, and readily available technology.
- Dominant Segment (Application): Telecommunication
- Key Drivers: Expansion of 5G networks, growth of cloud services, and increasing demand for high-speed data transmission.
Within each region and segment, growth is driven by specific factors, including economic policies encouraging infrastructure development, supportive government regulations, increasing investments in telecommunications and data center infrastructure, and strong adoption rates in key end-user sectors. The market is experiencing a shift toward higher-capacity optical transceivers, which is further driving growth.
Optical Interconnect Market Product Developments
Recent product innovations focus on increasing bandwidth, reducing power consumption, and improving miniaturization. Companies are developing advanced optical transceivers supporting 400G and 800G speeds, along with smaller, more energy-efficient Active Optical Cables (AOCs) and Embedded Optical Modules (EOMs). These advancements cater to the growing demand for higher bandwidth and lower latency in data centers and telecommunication networks. The integration of silicon photonics is enhancing the performance and cost-effectiveness of optical interconnect solutions. These innovations are creating competitive advantages by enabling faster data transmission, improved reliability, and reduced energy consumption.
Report Scope & Segmentation Analysis
This report segments the Optical Interconnect Market by type (Optical Transceivers, Active Optical Cables (AOCs), Embedded Optical Modules (EOMs)) and application (Telecommunication, Data Communication). Each segment includes detailed growth projections, market size estimations, and competitive landscape analysis. The Optical Transceiver segment is expected to maintain its dominance, driven by widespread adoption. The AOC segment is projected to witness significant growth, fueled by the rising demand for high-speed short-reach connectivity. The EOM segment is anticipated to grow steadily, driven by increased adoption in high-density data center applications. In the applications segment, Telecommunication is expected to continue its leadership position, while Data Communication is projected to grow significantly, largely due to the rising adoption of cloud services and the Internet of Things (IoT).
Key Drivers of Optical Interconnect Market Growth
The Optical Interconnect market's growth is driven by several key factors. The escalating demand for high-bandwidth connectivity across various sectors, particularly in data centers and telecommunication networks, is a primary driver. Technological advancements, such as the development of high-speed optical transceivers and coherent optical transmission, are also significantly impacting growth. Furthermore, the growing adoption of cloud computing and the Internet of Things (IoT) is fueling demand for advanced optical interconnect solutions. Government initiatives promoting digital infrastructure development in various regions contribute to this market expansion.
Challenges in the Optical Interconnect Market Sector
The Optical Interconnect market faces several challenges, including the high initial cost of implementation for optical infrastructure, the potential for signal degradation over long distances, and the increasing complexity of managing high-bandwidth networks. Competitive pressures from alternative technologies and supply chain disruptions can also impact market growth. Regulatory hurdles and environmental concerns further add to the complexity of this market. These factors may limit the widespread adoption of optical interconnects in certain sectors.
Emerging Opportunities in Optical Interconnect Market
Emerging opportunities exist in the development of next-generation optical transceivers supporting terabit speeds, the integration of optical interconnect solutions into emerging technologies such as augmented reality and virtual reality, and the expansion into new applications like automotive and industrial automation. The adoption of novel materials and manufacturing processes will further unlock cost-reduction opportunities and improve performance. The growth of 5G networks and edge computing presents significant opportunities for expansion.
Leading Players in the Optical Interconnect Market Market
- II-VI Incorporated
- Huawei Technologies Co Lt
- Molex LLC
- Cisco Systems Inc
- 3M Company
- Amphenol Corporation
- TE Connectivity Ltd
- Go!Foton Inc
- Corning Incorporated
- Sumitomo Electric Industries Ltd
Key Developments in Optical Interconnect Market Industry
- March 2021: Reflex Photonics secured a multimillion-dollar contract to supply SpaceABLE 28 optical modules for high-throughput communication satellites. This highlights the growing demand for robust and radiation-resistant optical interconnects in space applications.
- 2019: Reflex Photonics launched LightCONEX active optical blind mate, compatible with the VITA 66.5 standard and supported by the SOSA consortium. This signifies the increasing integration of optical interconnects in defense and aerospace applications.
- July 2020: Vodafone New Zealand collaborated with Ciena Corporation to deploy 800-Gbps data center interconnect, showcasing the trend towards higher data rates and the expanding application of optical interconnects in 5G infrastructure.
Strategic Outlook for Optical Interconnect Market Market
The Optical Interconnect market presents significant growth opportunities driven by continuous technological advancements, increasing demand for high-bandwidth connectivity, and expansion into new applications. The development of cost-effective and energy-efficient solutions remains crucial for broader market adoption. Future growth hinges on sustained innovation, strategic collaborations, and addressing the existing challenges related to cost, complexity, and reliability. The market is poised for substantial expansion driven by the ongoing digital transformation across various sectors.
Optical Interconnect Market Segmentation
-
1. Type
- 1.1. Optical Transceivers
- 1.2. Active Optical Cables (AOCs)
- 1.3. Embedded Optical Modules (EOMs)
-
2. Application
- 2.1. Telecommunication
- 2.2. Data Communication
Optical Interconnect Market Segmentation By Geography
-
1. North America
- 1.1. United States
- 1.2. Canada
-
2. Europe
- 2.1. Germany
- 2.2. United Kingdom
- 2.3. France
- 2.4. Rest of Europe
-
3. Asia Pacific
- 3.1. India
- 3.2. China
- 3.3. Japan
- 3.4. Rest of Asia Pacific
- 4. Latin America
- 5. Middle East and Africa
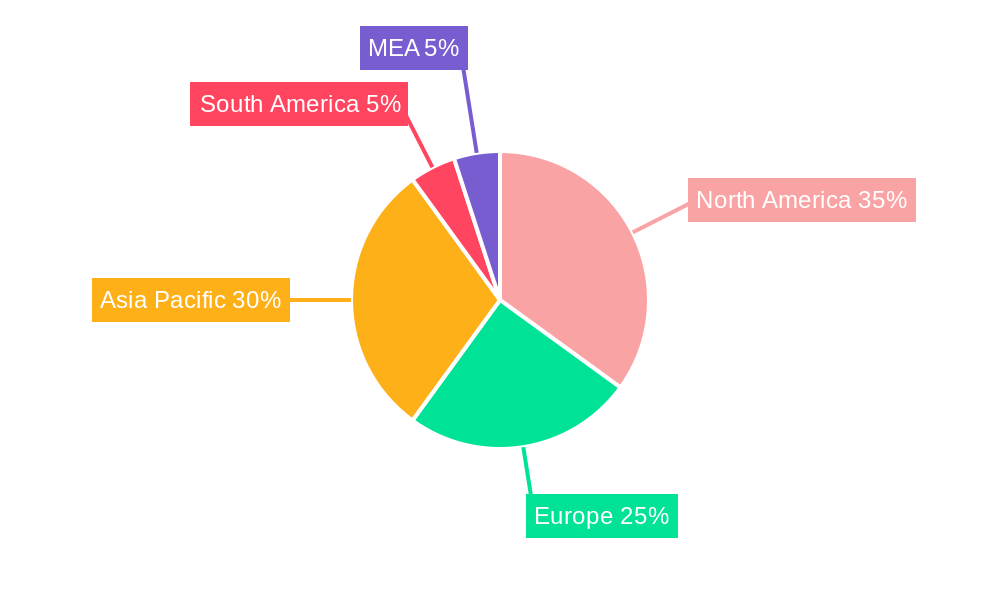
Optical Interconnect Market Regional Market Share
Geographic Coverage of Optical Interconnect Market
Optical Interconnect Market REPORT HIGHLIGHTS
| Aspects | Details |
|---|---|
| Study Period | 2020-2034 |
| Base Year | 2025 |
| Estimated Year | 2026 |
| Forecast Period | 2026-2034 |
| Historical Period | 2020-2025 |
| Growth Rate | CAGR of 13.15% from 2020-2034 |
| Segmentation |
|
Table of Contents
- 1. Introduction
- 1.1. Research Scope
- 1.2. Market Segmentation
- 1.3. Research Objective
- 1.4. Definitions and Assumptions
- 2. Executive Summary
- 2.1. Market Snapshot
- 3. Market Dynamics
- 3.1. Market Drivers
- 3.2. Market Restrains
- 3.3. Market Trends
- 3.4. Market Opportunities
- 4. Market Factor Analysis
- 4.1. Porters Five Forces
- 4.1.1. Bargaining Power of Suppliers
- 4.1.2. Bargaining Power of Buyers
- 4.1.3. Threat of New Entrants
- 4.1.4. Threat of Substitutes
- 4.1.5. Competitive Rivalry
- 4.2. PESTEL analysis
- 4.3. BCG Analysis
- 4.3.1. Stars (High Growth, High Market Share)
- 4.3.2. Cash Cows (Low Growth, High Market Share)
- 4.3.3. Question Mark (High Growth, Low Market Share)
- 4.3.4. Dogs (Low Growth, Low Market Share)
- 4.4. Ansoff Matrix Analysis
- 4.5. Supply Chain Analysis
- 4.6. Regulatory Landscape
- 4.7. Current Market Potential and Opportunity Assessment (TAM–SAM–SOM Framework)
- 4.8. RAX Analyst Note
- 4.1. Porters Five Forces
- 5. Market Analysis, Insights and Forecast 2021-2033
- 5.1. Market Analysis, Insights and Forecast - by Type
- 5.1.1. Optical Transceivers
- 5.1.2. Active Optical Cables (AOCs)
- 5.1.3. Embedded Optical Modules (EOMs)
- 5.2. Market Analysis, Insights and Forecast - by Application
- 5.2.1. Telecommunication
- 5.2.2. Data Communication
- 5.3. Market Analysis, Insights and Forecast - by Region
- 5.3.1. North America
- 5.3.2. Europe
- 5.3.3. Asia Pacific
- 5.3.4. Latin America
- 5.3.5. Middle East and Africa
- 5.1. Market Analysis, Insights and Forecast - by Type
- 6. Global Optical Interconnect Market Analysis, Insights and Forecast, 2021-2033
- 6.1. Market Analysis, Insights and Forecast - by Type
- 6.1.1. Optical Transceivers
- 6.1.2. Active Optical Cables (AOCs)
- 6.1.3. Embedded Optical Modules (EOMs)
- 6.2. Market Analysis, Insights and Forecast - by Application
- 6.2.1. Telecommunication
- 6.2.2. Data Communication
- 6.1. Market Analysis, Insights and Forecast - by Type
- 7. North America Optical Interconnect Market Analysis, Insights and Forecast, 2020-2032
- 7.1. Market Analysis, Insights and Forecast - by Type
- 7.1.1. Optical Transceivers
- 7.1.2. Active Optical Cables (AOCs)
- 7.1.3. Embedded Optical Modules (EOMs)
- 7.2. Market Analysis, Insights and Forecast - by Application
- 7.2.1. Telecommunication
- 7.2.2. Data Communication
- 7.1. Market Analysis, Insights and Forecast - by Type
- 8. Europe Optical Interconnect Market Analysis, Insights and Forecast, 2020-2032
- 8.1. Market Analysis, Insights and Forecast - by Type
- 8.1.1. Optical Transceivers
- 8.1.2. Active Optical Cables (AOCs)
- 8.1.3. Embedded Optical Modules (EOMs)
- 8.2. Market Analysis, Insights and Forecast - by Application
- 8.2.1. Telecommunication
- 8.2.2. Data Communication
- 8.1. Market Analysis, Insights and Forecast - by Type
- 9. Asia Pacific Optical Interconnect Market Analysis, Insights and Forecast, 2020-2032
- 9.1. Market Analysis, Insights and Forecast - by Type
- 9.1.1. Optical Transceivers
- 9.1.2. Active Optical Cables (AOCs)
- 9.1.3. Embedded Optical Modules (EOMs)
- 9.2. Market Analysis, Insights and Forecast - by Application
- 9.2.1. Telecommunication
- 9.2.2. Data Communication
- 9.1. Market Analysis, Insights and Forecast - by Type
- 10. Latin America Optical Interconnect Market Analysis, Insights and Forecast, 2020-2032
- 10.1. Market Analysis, Insights and Forecast - by Type
- 10.1.1. Optical Transceivers
- 10.1.2. Active Optical Cables (AOCs)
- 10.1.3. Embedded Optical Modules (EOMs)
- 10.2. Market Analysis, Insights and Forecast - by Application
- 10.2.1. Telecommunication
- 10.2.2. Data Communication
- 10.1. Market Analysis, Insights and Forecast - by Type
- 11. Middle East and Africa Optical Interconnect Market Analysis, Insights and Forecast, 2020-2032
- 11.1. Market Analysis, Insights and Forecast - by Type
- 11.1.1. Optical Transceivers
- 11.1.2. Active Optical Cables (AOCs)
- 11.1.3. Embedded Optical Modules (EOMs)
- 11.2. Market Analysis, Insights and Forecast - by Application
- 11.2.1. Telecommunication
- 11.2.2. Data Communication
- 11.1. Market Analysis, Insights and Forecast - by Type
- 12. Competitive Analysis
- 12.1. Company Profiles
- 12.1.1 II-VI Incorporated
- 12.1.1.1. Company Overview
- 12.1.1.2. Products
- 12.1.1.3. Company Financials
- 12.1.1.4. SWOT Analysis
- 12.1.2 Huawei Technologies Co Lt
- 12.1.2.1. Company Overview
- 12.1.2.2. Products
- 12.1.2.3. Company Financials
- 12.1.2.4. SWOT Analysis
- 12.1.3 Molex LLC
- 12.1.3.1. Company Overview
- 12.1.3.2. Products
- 12.1.3.3. Company Financials
- 12.1.3.4. SWOT Analysis
- 12.1.4 Cisco Systems Inc
- 12.1.4.1. Company Overview
- 12.1.4.2. Products
- 12.1.4.3. Company Financials
- 12.1.4.4. SWOT Analysis
- 12.1.5 3M Company
- 12.1.5.1. Company Overview
- 12.1.5.2. Products
- 12.1.5.3. Company Financials
- 12.1.5.4. SWOT Analysis
- 12.1.6 Amphenol Corporation
- 12.1.6.1. Company Overview
- 12.1.6.2. Products
- 12.1.6.3. Company Financials
- 12.1.6.4. SWOT Analysis
- 12.1.7 TE Connectivity Ltd
- 12.1.7.1. Company Overview
- 12.1.7.2. Products
- 12.1.7.3. Company Financials
- 12.1.7.4. SWOT Analysis
- 12.1.8 Go!Foton Inc
- 12.1.8.1. Company Overview
- 12.1.8.2. Products
- 12.1.8.3. Company Financials
- 12.1.8.4. SWOT Analysis
- 12.1.9 Corning Incorporated
- 12.1.9.1. Company Overview
- 12.1.9.2. Products
- 12.1.9.3. Company Financials
- 12.1.9.4. SWOT Analysis
- 12.1.10 Sumitomo Electric Industries Ltd
- 12.1.10.1. Company Overview
- 12.1.10.2. Products
- 12.1.10.3. Company Financials
- 12.1.10.4. SWOT Analysis
- 12.1.1 II-VI Incorporated
- 12.2. Market Entropy
- 12.2.1 Company's Key Areas Served
- 12.2.2 Recent Developments
- 12.3. Company Market Share Analysis 2025
- 12.3.1 Top 5 Companies Market Share Analysis
- 12.3.2 Top 3 Companies Market Share Analysis
- 12.4. List of Potential Customers
- 13. Research Methodology
List of Figures
- Figure 1: Global Optical Interconnect Market Revenue Breakdown (Million, %) by Region 2025 & 2033
- Figure 2: North America Optical Interconnect Market Revenue (Million), by Type 2025 & 2033
- Figure 3: North America Optical Interconnect Market Revenue Share (%), by Type 2025 & 2033
- Figure 4: North America Optical Interconnect Market Revenue (Million), by Application 2025 & 2033
- Figure 5: North America Optical Interconnect Market Revenue Share (%), by Application 2025 & 2033
- Figure 6: North America Optical Interconnect Market Revenue (Million), by Country 2025 & 2033
- Figure 7: North America Optical Interconnect Market Revenue Share (%), by Country 2025 & 2033
- Figure 8: Europe Optical Interconnect Market Revenue (Million), by Type 2025 & 2033
- Figure 9: Europe Optical Interconnect Market Revenue Share (%), by Type 2025 & 2033
- Figure 10: Europe Optical Interconnect Market Revenue (Million), by Application 2025 & 2033
- Figure 11: Europe Optical Interconnect Market Revenue Share (%), by Application 2025 & 2033
- Figure 12: Europe Optical Interconnect Market Revenue (Million), by Country 2025 & 2033
- Figure 13: Europe Optical Interconnect Market Revenue Share (%), by Country 2025 & 2033
- Figure 14: Asia Pacific Optical Interconnect Market Revenue (Million), by Type 2025 & 2033
- Figure 15: Asia Pacific Optical Interconnect Market Revenue Share (%), by Type 2025 & 2033
- Figure 16: Asia Pacific Optical Interconnect Market Revenue (Million), by Application 2025 & 2033
- Figure 17: Asia Pacific Optical Interconnect Market Revenue Share (%), by Application 2025 & 2033
- Figure 18: Asia Pacific Optical Interconnect Market Revenue (Million), by Country 2025 & 2033
- Figure 19: Asia Pacific Optical Interconnect Market Revenue Share (%), by Country 2025 & 2033
- Figure 20: Latin America Optical Interconnect Market Revenue (Million), by Type 2025 & 2033
- Figure 21: Latin America Optical Interconnect Market Revenue Share (%), by Type 2025 & 2033
- Figure 22: Latin America Optical Interconnect Market Revenue (Million), by Application 2025 & 2033
- Figure 23: Latin America Optical Interconnect Market Revenue Share (%), by Application 2025 & 2033
- Figure 24: Latin America Optical Interconnect Market Revenue (Million), by Country 2025 & 2033
- Figure 25: Latin America Optical Interconnect Market Revenue Share (%), by Country 2025 & 2033
- Figure 26: Middle East and Africa Optical Interconnect Market Revenue (Million), by Type 2025 & 2033
- Figure 27: Middle East and Africa Optical Interconnect Market Revenue Share (%), by Type 2025 & 2033
- Figure 28: Middle East and Africa Optical Interconnect Market Revenue (Million), by Application 2025 & 2033
- Figure 29: Middle East and Africa Optical Interconnect Market Revenue Share (%), by Application 2025 & 2033
- Figure 30: Middle East and Africa Optical Interconnect Market Revenue (Million), by Country 2025 & 2033
- Figure 31: Middle East and Africa Optical Interconnect Market Revenue Share (%), by Country 2025 & 2033
List of Tables
- Table 1: Global Optical Interconnect Market Revenue Million Forecast, by Type 2020 & 2033
- Table 2: Global Optical Interconnect Market Revenue Million Forecast, by Application 2020 & 2033
- Table 3: Global Optical Interconnect Market Revenue Million Forecast, by Region 2020 & 2033
- Table 4: Global Optical Interconnect Market Revenue Million Forecast, by Type 2020 & 2033
- Table 5: Global Optical Interconnect Market Revenue Million Forecast, by Application 2020 & 2033
- Table 6: Global Optical Interconnect Market Revenue Million Forecast, by Country 2020 & 2033
- Table 7: United States Optical Interconnect Market Revenue (Million) Forecast, by Application 2020 & 2033
- Table 8: Canada Optical Interconnect Market Revenue (Million) Forecast, by Application 2020 & 2033
- Table 9: Global Optical Interconnect Market Revenue Million Forecast, by Type 2020 & 2033
- Table 10: Global Optical Interconnect Market Revenue Million Forecast, by Application 2020 & 2033
- Table 11: Global Optical Interconnect Market Revenue Million Forecast, by Country 2020 & 2033
- Table 12: Germany Optical Interconnect Market Revenue (Million) Forecast, by Application 2020 & 2033
- Table 13: United Kingdom Optical Interconnect Market Revenue (Million) Forecast, by Application 2020 & 2033
- Table 14: France Optical Interconnect Market Revenue (Million) Forecast, by Application 2020 & 2033
- Table 15: Rest of Europe Optical Interconnect Market Revenue (Million) Forecast, by Application 2020 & 2033
- Table 16: Global Optical Interconnect Market Revenue Million Forecast, by Type 2020 & 2033
- Table 17: Global Optical Interconnect Market Revenue Million Forecast, by Application 2020 & 2033
- Table 18: Global Optical Interconnect Market Revenue Million Forecast, by Country 2020 & 2033
- Table 19: India Optical Interconnect Market Revenue (Million) Forecast, by Application 2020 & 2033
- Table 20: China Optical Interconnect Market Revenue (Million) Forecast, by Application 2020 & 2033
- Table 21: Japan Optical Interconnect Market Revenue (Million) Forecast, by Application 2020 & 2033
- Table 22: Rest of Asia Pacific Optical Interconnect Market Revenue (Million) Forecast, by Application 2020 & 2033
- Table 23: Global Optical Interconnect Market Revenue Million Forecast, by Type 2020 & 2033
- Table 24: Global Optical Interconnect Market Revenue Million Forecast, by Application 2020 & 2033
- Table 25: Global Optical Interconnect Market Revenue Million Forecast, by Country 2020 & 2033
- Table 26: Global Optical Interconnect Market Revenue Million Forecast, by Type 2020 & 2033
- Table 27: Global Optical Interconnect Market Revenue Million Forecast, by Application 2020 & 2033
- Table 28: Global Optical Interconnect Market Revenue Million Forecast, by Country 2020 & 2033
Frequently Asked Questions
1. What is the projected Compound Annual Growth Rate (CAGR) of the Optical Interconnect Market?
The projected CAGR is approximately 13.15%.
2. Which companies are prominent players in the Optical Interconnect Market?
Key companies in the market include II-VI Incorporated, Huawei Technologies Co Lt, Molex LLC, Cisco Systems Inc, 3M Company, Amphenol Corporation, TE Connectivity Ltd, Go!Foton Inc, Corning Incorporated, Sumitomo Electric Industries Ltd.
3. What are the main segments of the Optical Interconnect Market?
The market segments include Type, Application.
4. Can you provide details about the market size?
The market size is estimated to be USD 17.14 Million as of 2022.
5. What are some drivers contributing to market growth?
Increasing Demand for Communication Bandwidth Owing to Demand for Cloud Computing. AI. and HPC; Increasing Investment in Data Centers Interconnect and Fiber Optic Communication.
6. What are the notable trends driving market growth?
Data Communication is Expected to Spur the Demand for Optical Interconnects.
7. Are there any restraints impacting market growth?
Slow Commercialization of Optical Interconnection Related Technologies.
8. Can you provide examples of recent developments in the market?
March 2021 - Canada-based Reflex Photonics was awarded a multimillion-dollar contract to deliver thousands of SpaceABLE 28 optical module devices to be used in high-throughput communication satellites (HTCS) that may be deployed in geostationary orbit. Building on the recognized robustness inherent in the design of Reflex Photonics' optical modules, the SpaceABLE28 line may provide radiation-resistant optical interconnect modules tested and qualified for use in harsh space environment. In 2019, the company launched new LightCONEX active optical blind mate that interconnects compatible with the upcoming VITA 66.5 standard and supported by the Sensor Open System Architecture (SOSA) consortium.
9. What pricing options are available for accessing the report?
Pricing options include single-user, multi-user, and enterprise licenses priced at USD 4750, USD 5250, and USD 8750 respectively.
10. Is the market size provided in terms of value or volume?
The market size is provided in terms of value, measured in Million.
11. Are there any specific market keywords associated with the report?
Yes, the market keyword associated with the report is "Optical Interconnect Market," which aids in identifying and referencing the specific market segment covered.
12. How do I determine which pricing option suits my needs best?
The pricing options vary based on user requirements and access needs. Individual users may opt for single-user licenses, while businesses requiring broader access may choose multi-user or enterprise licenses for cost-effective access to the report.
13. Are there any additional resources or data provided in the Optical Interconnect Market report?
While the report offers comprehensive insights, it's advisable to review the specific contents or supplementary materials provided to ascertain if additional resources or data are available.
14. How can I stay updated on further developments or reports in the Optical Interconnect Market?
To stay informed about further developments, trends, and reports in the Optical Interconnect Market, consider subscribing to industry newsletters, following relevant companies and organizations, or regularly checking reputable industry news sources and publications.
Methodology
Step 1 - Identification of Relevant Samples Size from Population Database


Step 2 - Approaches for Defining Global Market Size (Value, Volume* & Price*)

Note*: In applicable scenarios
Step 3 - Data Sources
Primary Research
- Web Analytics
- Survey Reports
- Research Institute
- Latest Research Reports
- Opinion Leaders
Secondary Research
- Annual Reports
- White Paper
- Latest Press Release
- Industry Association
- Paid Database
- Investor Presentations

Step 4 - Data Triangulation
Involves using different sources of information in order to increase the validity of a study
These sources are likely to be stakeholders in a program - participants, other researchers, program staff, other community members, and so on.
Then we put all data in single framework & apply various statistical tools to find out the dynamic on the market.
During the analysis stage, feedback from the stakeholder groups would be compared to determine areas of agreement as well as areas of divergence