
Key Insights
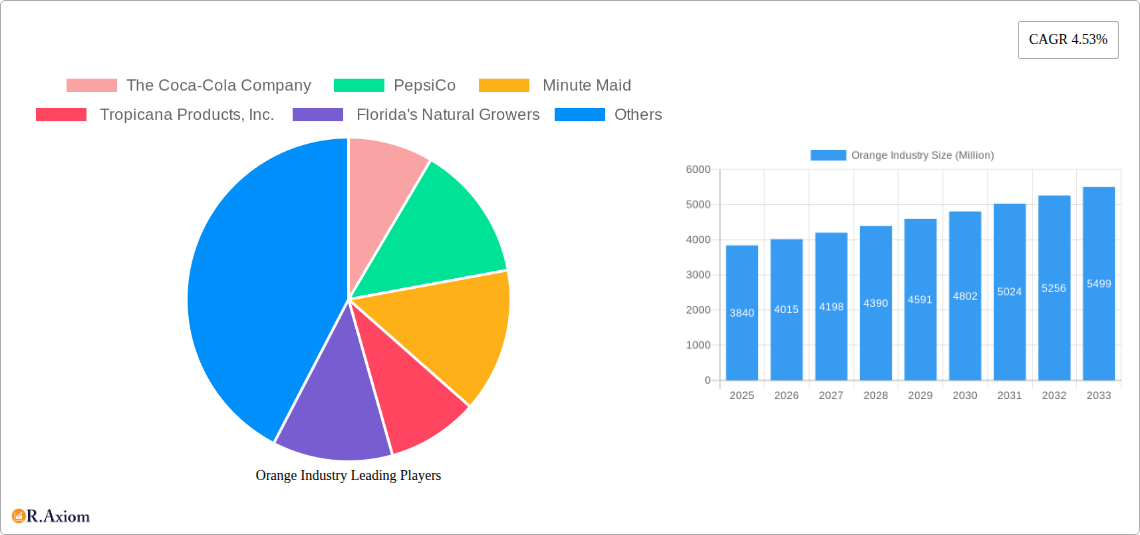
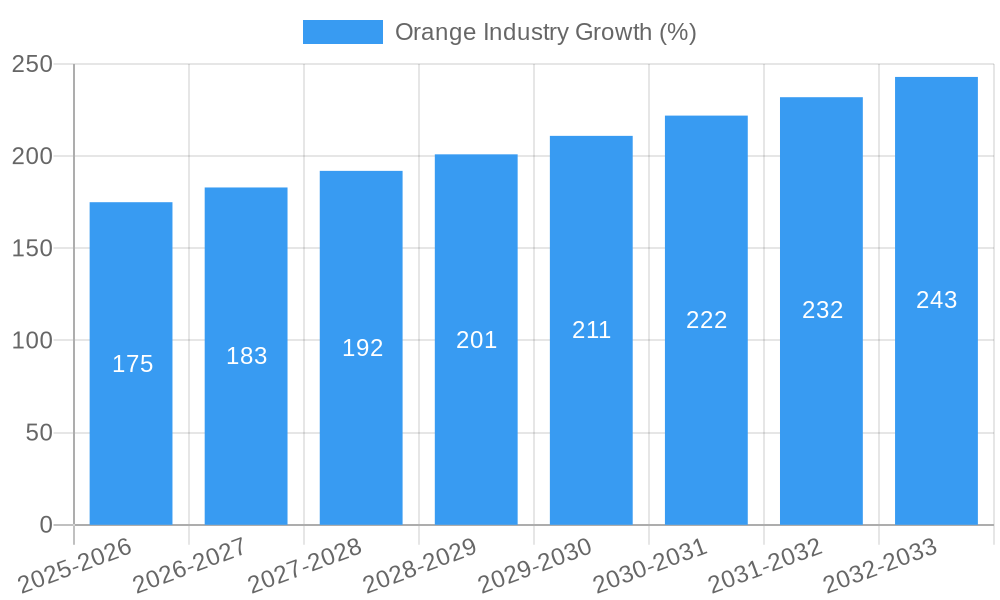
The global orange industry, valued at $3.84 billion in 2025, is projected to experience robust growth, driven by increasing consumer demand for healthy beverages and food products, and the rising popularity of orange-based functional foods and dietary supplements. The industry's Compound Annual Growth Rate (CAGR) of 4.53% from 2025 to 2033 indicates a significant expansion in market size over the forecast period. Key growth drivers include the expanding beverage industry, particularly the continued demand for orange juice and other orange-flavored drinks. Furthermore, increasing health consciousness among consumers is fueling the demand for fresh oranges and orange-based products perceived as nutritious and rich in Vitamin C. The diverse applications of oranges, encompassing direct consumption, juice production, and use in food processing, contribute to this market's resilience. However, factors like climate change impacting orange yields, fluctuating raw material prices, and the increasing competition from other fruit juices could potentially constrain growth. The segmentation by type (fresh, frozen, juice, concentrates, peels) and application (beverages, food processing, direct consumption) provides a nuanced view of market dynamics, allowing for targeted strategies by industry players. The significant presence of major players like Coca-Cola, PepsiCo, Minute Maid, and Tropicana indicates a consolidated yet competitive landscape. Regional variations in consumption patterns and production capacities will also shape the industry's trajectory, with North America and Asia-Pacific expected to lead in terms of market share.
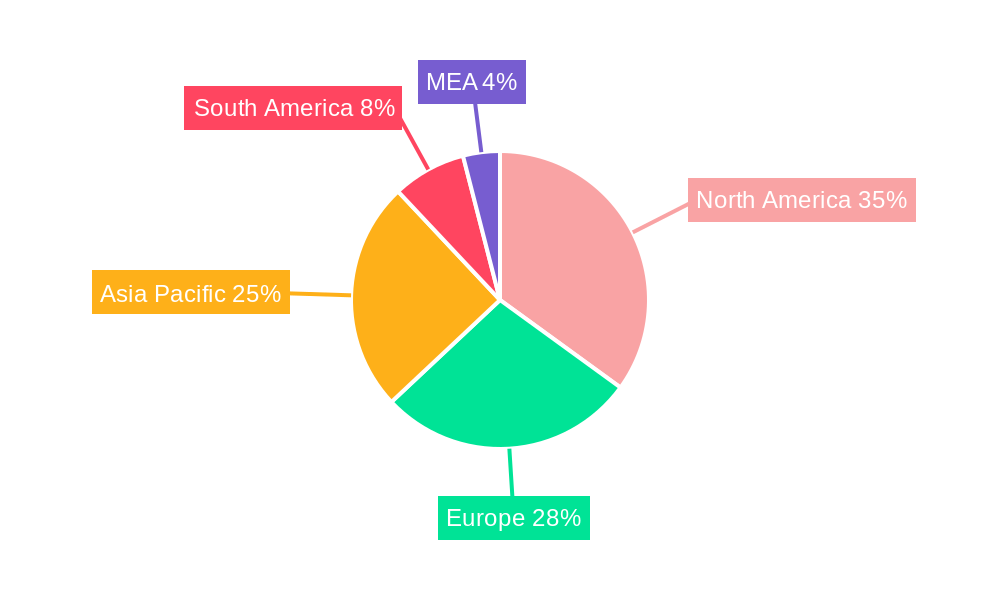
The geographical distribution of the orange market highlights regional disparities. North America, with its established infrastructure and large consumer base, holds a substantial share, closely followed by Europe and Asia-Pacific. Emerging markets in South America and the MEA region present opportunities for expansion, fueled by increasing disposable incomes and changing dietary preferences. However, these regions may face challenges related to infrastructure and production capabilities. The competitive landscape is dominated by major multinational companies with extensive distribution networks and established brands. These players are constantly innovating to cater to evolving consumer preferences, launching new products, and expanding their geographic reach. Smaller, regional players focusing on niche markets, such as organic or specialty oranges, are also emerging, adding diversity to the market. The forecast period of 2025-2033 offers significant potential for growth and consolidation within the orange industry, requiring players to adapt to changing market conditions and consumer demands.
Orange Industry Market Report: 2019-2033
This comprehensive report provides a detailed analysis of the global orange industry, offering invaluable insights for stakeholders across the value chain. With a study period spanning 2019-2033, a base year of 2025, and an estimated and forecast period of 2025-2033, this report offers both historical context and future projections, enabling informed decision-making. The report examines key market segments, including fresh oranges, frozen oranges, orange juice, orange concentrates, and orange peels, across diverse applications like the beverage industry, food processing, and direct consumption. Leading players like The Coca-Cola Company, PepsiCo, Minute Maid, Tropicana Products, Inc., and Florida's Natural Growers are analyzed, revealing market concentration, innovation, and competitive dynamics. The report analyzes a market valued at xx Million in 2025, projecting significant growth to xx Million by 2033.
Orange Industry Market Concentration & Innovation
The orange industry exhibits a moderately concentrated market structure, with a few multinational corporations holding significant market share. The Coca-Cola Company and PepsiCo, through their respective subsidiaries (Minute Maid and Tropicana), dominate the processed orange juice segment. Smaller players, like Florida’s Natural Growers, cater to niche markets focused on fresh and natural products. Innovation is driven by consumer demand for healthier options, functional beverages, and convenient formats. This includes advancements in processing technologies to enhance the shelf life and nutritional value of orange products. The industry faces regulatory scrutiny regarding sugar content, pesticide use, and sustainability practices. Product substitutes, including other fruit juices and beverages, exert competitive pressure. Mergers and acquisitions (M&A) activity is moderate, with larger players acquiring smaller companies to expand their product portfolios and geographical reach. Recent M&A deal values have ranged from xx Million to xx Million, primarily focused on expanding distribution networks and enhancing brand recognition.
- Market Share: Coca-Cola/Minute Maid (xx%), PepsiCo/Tropicana (xx%), Others (xx%).
- M&A Deal Values (2019-2024): Averaging xx Million per deal.
- Key Innovation Drivers: Consumer health consciousness, sustainable farming practices, and technological advancements in processing and packaging.
Orange Industry Industry Trends & Insights
The global orange industry is experiencing dynamic shifts driven by changing consumer preferences, technological advancements, and evolving market dynamics. Market growth is projected at a Compound Annual Growth Rate (CAGR) of xx% during the forecast period (2025-2033). This growth is fueled by factors such as rising disposable incomes in developing economies, increasing demand for convenient and ready-to-drink beverages, and growing awareness of the health benefits of Vitamin C-rich orange juice. Technological innovations, particularly in processing and packaging, contribute to increased efficiency and improved product quality. However, the industry faces challenges from fluctuating orange yields due to weather patterns and pest infestations, impacting supply chains and prices. Consumer preferences are shifting towards organic, fair-trade, and sustainably sourced products, prompting industry players to adapt their supply chains and adopt eco-friendly practices. Market penetration for organic orange products is projected to reach xx% by 2033. The competitive landscape is marked by intense competition amongst major players, driving innovation and price competitiveness.
Dominant Markets & Segments in Orange Industry
The United States remains the dominant market for orange juice and concentrates, driven by high consumption levels and robust infrastructure. Brazil and other Latin American countries are significant producers of fresh oranges and orange concentrates for export. The orange juice segment holds the largest market share, followed by fresh oranges and orange concentrates.
Key Drivers of US Dominance: High per capita consumption, established processing infrastructure, strong distribution networks.
Key Drivers of Latin American Production: Favorable climatic conditions, abundant land resources, and established export channels.
By Type: Orange juice holds the largest market share, followed by fresh oranges and orange concentrates. The frozen orange segment is experiencing steady growth. Orange peels are gaining traction due to their use in food processing and other applications.
By Application: The beverage industry is the largest consumer of oranges, followed by the food processing and direct consumption sectors.
Orange Industry Product Developments
Recent product innovations center around functional beverages, enhanced nutritional profiles (e.g., fortified with added vitamins or antioxidants), and convenient packaging formats (e.g., single-serving pouches, ready-to-drink bottles). Technological advancements in juice extraction and preservation techniques ensure superior quality and extended shelf life. These innovations cater to the evolving consumer preferences for health and wellness while enhancing the competitive advantage of leading brands. The emphasis on sustainability, with eco-friendly packaging and sourcing practices, is an increasing focus in product development.
Report Scope & Segmentation Analysis
This report comprehensively segments the orange industry by type (fresh oranges, frozen oranges, orange juice, orange concentrates, orange peels) and by application (beverage industry, food processing, direct consumption). Each segment's market size, growth projections, and competitive dynamics are analyzed in detail. For instance, the orange juice segment is projected to grow at a CAGR of xx% during the forecast period, driven by increasing demand for convenient and ready-to-drink beverages. The fresh orange segment, while experiencing slower growth, benefits from consumer preference for natural products, with an estimated market size of xx Million in 2025.
Key Drivers of Orange Industry Growth
The growth of the orange industry is fueled by several key factors. Rising disposable incomes, especially in emerging markets, are driving increased demand for orange products. Growing health consciousness and awareness of the health benefits of Vitamin C are boosting consumption. Technological advancements in processing, packaging, and preservation enhance product quality and shelf life. Favorable government policies and incentives promoting orange cultivation also contribute to industry growth.
Challenges in the Orange Industry Sector
The orange industry faces several challenges. Fluctuations in orange yields due to weather patterns and disease outbreaks create supply chain disruptions and price volatility. Increasing costs of raw materials, labor, and transportation affect profitability. Intense competition among major players puts pressure on pricing and margins. Stringent regulations on food safety and sustainability require significant investment and compliance efforts. These factors collectively influence overall market stability.
Emerging Opportunities in Orange Industry
Emerging opportunities include the growth of premium and organic orange segments, catering to health-conscious consumers. The development of new products, such as functional beverages incorporating orange extracts, presents promising avenues. Expansion into emerging markets in Asia and Africa offers significant growth potential. Utilizing orange peels and by-products for various applications (e.g., essential oils, food additives) can enhance profitability and sustainability.
Leading Players in the Orange Industry Market
- The Coca-Cola Company
- PepsiCo
- Minute Maid
- Tropicana Products, Inc.
- Florida's Natural Growers
Key Developments in Orange Industry Industry
- May 2022: An agreement between the Agricultural and Processed Food Products Export Development Authority and Agrovision Foundation set an export target increase for oranges from USD 61.2 Million to USD 612.0 Million through organic farming and quality hybrids.
- September 2022: Virtue Clean Energy launched an orange-flavored energy drink, expanding its product line and tapping into consumer demand for fruit-based beverages.
- November 2022: Arunachal Pradesh Agriculture Marketing Board exported its first orange consignment (6 metric tons) to the UAE and Qatar, marking a significant step in international market expansion.
Strategic Outlook for Orange Industry Market
The orange industry is poised for continued growth, driven by increasing consumer demand, product innovation, and expansion into new markets. Focusing on sustainability, health and wellness, and convenient formats will be crucial for success. Companies that can effectively manage supply chain challenges and adapt to changing consumer preferences will be well-positioned to capture significant market share in the years to come. The long-term outlook remains positive, with consistent growth driven by rising disposable income and the enduring appeal of orange-based products.
Orange Industry Segmentation
- 1. Production Analysis
- 2. Consumption Analysis
- 3. Import Market Analysis (Value & Volume)
- 4. Export Market Analysis (Value & Volume)
- 5. Price Trend Analysis
Orange Industry Segmentation By Geography
- 1. Brazil
- 2. China
- 3. India
- 4. Mexico
- 5. United States
- 6. European Union
- 7. Egypt
- 8. South Africa
- 9. Indonesia
- 10. Turkey
Orange Industry REPORT HIGHLIGHTS
| Aspects | Details |
|---|---|
| Study Period | 2019-2033 |
| Base Year | 2024 |
| Estimated Year | 2025 |
| Forecast Period | 2025-2033 |
| Historical Period | 2019-2024 |
| Growth Rate | CAGR of 4.53% from 2019-2033 |
| Segmentation |
|
Table of Contents
- 1. Introduction
- 1.1. Research Scope
- 1.2. Market Segmentation
- 1.3. Research Methodology
- 1.4. Definitions and Assumptions
- 2. Executive Summary
- 2.1. Introduction
- 3. Market Dynamics
- 3.1. Introduction
- 3.2. Market Drivers
- 3.2.1. Rising Consumption of Cashew Nuts as a Healthy Snack; Increasing Government initiatives; Growing Cashew Nut Imports in The United States
- 3.3. Market Restrains
- 3.3.1. Hazardous Climatic Condition Hinders Cashew Production; Stringent Regulations Related To Food Quality Standards
- 3.4. Market Trends
- 3.4.1. Growing Seasonal Consumption of Orange
- 4. Market Factor Analysis
- 4.1. Porters Five Forces
- 4.2. Supply/Value Chain
- 4.3. PESTEL analysis
- 4.4. Market Entropy
- 4.5. Patent/Trademark Analysis
- 5. Global Orange Industry Analysis, Insights and Forecast, 2019-2031
- 5.1. Market Analysis, Insights and Forecast - by Production Analysis
- 5.2. Market Analysis, Insights and Forecast - by Consumption Analysis
- 5.3. Market Analysis, Insights and Forecast - by Import Market Analysis (Value & Volume)
- 5.4. Market Analysis, Insights and Forecast - by Export Market Analysis (Value & Volume)
- 5.5. Market Analysis, Insights and Forecast - by Price Trend Analysis
- 5.6. Market Analysis, Insights and Forecast - by Region
- 5.6.1. Brazil
- 5.6.2. China
- 5.6.3. India
- 5.6.4. Mexico
- 5.6.5. United States
- 5.6.6. European Union
- 5.6.7. Egypt
- 5.6.8. South Africa
- 5.6.9. Indonesia
- 5.6.10. Turkey
- 5.1. Market Analysis, Insights and Forecast - by Production Analysis
- 6. Brazil Orange Industry Analysis, Insights and Forecast, 2019-2031
- 6.1. Market Analysis, Insights and Forecast - by Production Analysis
- 6.2. Market Analysis, Insights and Forecast - by Consumption Analysis
- 6.3. Market Analysis, Insights and Forecast - by Import Market Analysis (Value & Volume)
- 6.4. Market Analysis, Insights and Forecast - by Export Market Analysis (Value & Volume)
- 6.5. Market Analysis, Insights and Forecast - by Price Trend Analysis
- 6.1. Market Analysis, Insights and Forecast - by Production Analysis
- 7. China Orange Industry Analysis, Insights and Forecast, 2019-2031
- 7.1. Market Analysis, Insights and Forecast - by Production Analysis
- 7.2. Market Analysis, Insights and Forecast - by Consumption Analysis
- 7.3. Market Analysis, Insights and Forecast - by Import Market Analysis (Value & Volume)
- 7.4. Market Analysis, Insights and Forecast - by Export Market Analysis (Value & Volume)
- 7.5. Market Analysis, Insights and Forecast - by Price Trend Analysis
- 7.1. Market Analysis, Insights and Forecast - by Production Analysis
- 8. India Orange Industry Analysis, Insights and Forecast, 2019-2031
- 8.1. Market Analysis, Insights and Forecast - by Production Analysis
- 8.2. Market Analysis, Insights and Forecast - by Consumption Analysis
- 8.3. Market Analysis, Insights and Forecast - by Import Market Analysis (Value & Volume)
- 8.4. Market Analysis, Insights and Forecast - by Export Market Analysis (Value & Volume)
- 8.5. Market Analysis, Insights and Forecast - by Price Trend Analysis
- 8.1. Market Analysis, Insights and Forecast - by Production Analysis
- 9. Mexico Orange Industry Analysis, Insights and Forecast, 2019-2031
- 9.1. Market Analysis, Insights and Forecast - by Production Analysis
- 9.2. Market Analysis, Insights and Forecast - by Consumption Analysis
- 9.3. Market Analysis, Insights and Forecast - by Import Market Analysis (Value & Volume)
- 9.4. Market Analysis, Insights and Forecast - by Export Market Analysis (Value & Volume)
- 9.5. Market Analysis, Insights and Forecast - by Price Trend Analysis
- 9.1. Market Analysis, Insights and Forecast - by Production Analysis
- 10. United States Orange Industry Analysis, Insights and Forecast, 2019-2031
- 10.1. Market Analysis, Insights and Forecast - by Production Analysis
- 10.2. Market Analysis, Insights and Forecast - by Consumption Analysis
- 10.3. Market Analysis, Insights and Forecast - by Import Market Analysis (Value & Volume)
- 10.4. Market Analysis, Insights and Forecast - by Export Market Analysis (Value & Volume)
- 10.5. Market Analysis, Insights and Forecast - by Price Trend Analysis
- 10.1. Market Analysis, Insights and Forecast - by Production Analysis
- 11. European Union Orange Industry Analysis, Insights and Forecast, 2019-2031
- 11.1. Market Analysis, Insights and Forecast - by Production Analysis
- 11.2. Market Analysis, Insights and Forecast - by Consumption Analysis
- 11.3. Market Analysis, Insights and Forecast - by Import Market Analysis (Value & Volume)
- 11.4. Market Analysis, Insights and Forecast - by Export Market Analysis (Value & Volume)
- 11.5. Market Analysis, Insights and Forecast - by Price Trend Analysis
- 11.1. Market Analysis, Insights and Forecast - by Production Analysis
- 12. Egypt Orange Industry Analysis, Insights and Forecast, 2019-2031
- 12.1. Market Analysis, Insights and Forecast - by Production Analysis
- 12.2. Market Analysis, Insights and Forecast - by Consumption Analysis
- 12.3. Market Analysis, Insights and Forecast - by Import Market Analysis (Value & Volume)
- 12.4. Market Analysis, Insights and Forecast - by Export Market Analysis (Value & Volume)
- 12.5. Market Analysis, Insights and Forecast - by Price Trend Analysis
- 12.1. Market Analysis, Insights and Forecast - by Production Analysis
- 13. South Africa Orange Industry Analysis, Insights and Forecast, 2019-2031
- 13.1. Market Analysis, Insights and Forecast - by Production Analysis
- 13.2. Market Analysis, Insights and Forecast - by Consumption Analysis
- 13.3. Market Analysis, Insights and Forecast - by Import Market Analysis (Value & Volume)
- 13.4. Market Analysis, Insights and Forecast - by Export Market Analysis (Value & Volume)
- 13.5. Market Analysis, Insights and Forecast - by Price Trend Analysis
- 13.1. Market Analysis, Insights and Forecast - by Production Analysis
- 14. Indonesia Orange Industry Analysis, Insights and Forecast, 2019-2031
- 14.1. Market Analysis, Insights and Forecast - by Production Analysis
- 14.2. Market Analysis, Insights and Forecast - by Consumption Analysis
- 14.3. Market Analysis, Insights and Forecast - by Import Market Analysis (Value & Volume)
- 14.4. Market Analysis, Insights and Forecast - by Export Market Analysis (Value & Volume)
- 14.5. Market Analysis, Insights and Forecast - by Price Trend Analysis
- 14.1. Market Analysis, Insights and Forecast - by Production Analysis
- 15. Turkey Orange Industry Analysis, Insights and Forecast, 2019-2031
- 15.1. Market Analysis, Insights and Forecast - by Production Analysis
- 15.2. Market Analysis, Insights and Forecast - by Consumption Analysis
- 15.3. Market Analysis, Insights and Forecast - by Import Market Analysis (Value & Volume)
- 15.4. Market Analysis, Insights and Forecast - by Export Market Analysis (Value & Volume)
- 15.5. Market Analysis, Insights and Forecast - by Price Trend Analysis
- 15.1. Market Analysis, Insights and Forecast - by Production Analysis
- 16. South America Orange Industry Analysis, Insights and Forecast, 2019-2031
- 16.1. Market Analysis, Insights and Forecast - By Country/Sub-region
- 16.1.1 Brazil
- 16.1.2 Argentina
- 16.1.3 Rest of South America
- 17. North America Orange Industry Analysis, Insights and Forecast, 2019-2031
- 17.1. Market Analysis, Insights and Forecast - By Country/Sub-region
- 17.1.1 United States
- 17.1.2 Canada
- 17.1.3 Mexico
- 18. MEA Orange Industry Analysis, Insights and Forecast, 2019-2031
- 18.1. Market Analysis, Insights and Forecast - By Country/Sub-region
- 18.1.1 Middle East
- 18.1.2 Africa
- 19. Europe Orange Industry Analysis, Insights and Forecast, 2019-2031
- 19.1. Market Analysis, Insights and Forecast - By Country/Sub-region
- 19.1.1 Germany
- 19.1.2 France
- 19.1.3 Italy
- 19.1.4 United Kingdom
- 19.1.5 Netherlands
- 19.1.6 Rest of Europe
- 20. Asia Pacific Orange Industry Analysis, Insights and Forecast, 2019-2031
- 20.1. Market Analysis, Insights and Forecast - By Country/Sub-region
- 20.1.1 China
- 20.1.2 Japan
- 20.1.3 India
- 20.1.4 South Korea
- 20.1.5 Taiwan
- 20.1.6 Australia
- 20.1.7 Rest of Asia-Pacific
- 21. Competitive Analysis
- 21.1. Global Market Share Analysis 2024
- 21.2. Company Profiles
- 21.2.1 The Coca-Cola Company
- 21.2.1.1. Overview
- 21.2.1.2. Products
- 21.2.1.3. SWOT Analysis
- 21.2.1.4. Recent Developments
- 21.2.1.5. Financials (Based on Availability)
- 21.2.2 PepsiCo
- 21.2.2.1. Overview
- 21.2.2.2. Products
- 21.2.2.3. SWOT Analysis
- 21.2.2.4. Recent Developments
- 21.2.2.5. Financials (Based on Availability)
- 21.2.3 Minute Maid
- 21.2.3.1. Overview
- 21.2.3.2. Products
- 21.2.3.3. SWOT Analysis
- 21.2.3.4. Recent Developments
- 21.2.3.5. Financials (Based on Availability)
- 21.2.4 Tropicana Products Inc.
- 21.2.4.1. Overview
- 21.2.4.2. Products
- 21.2.4.3. SWOT Analysis
- 21.2.4.4. Recent Developments
- 21.2.4.5. Financials (Based on Availability)
- 21.2.5 Florida's Natural Growers
- 21.2.5.1. Overview
- 21.2.5.2. Products
- 21.2.5.3. SWOT Analysis
- 21.2.5.4. Recent Developments
- 21.2.5.5. Financials (Based on Availability)
- 21.2.1 The Coca-Cola Company
List of Figures
- Figure 1: Global Orange Industry Revenue Breakdown (Million, %) by Region 2024 & 2032
- Figure 2: Global Orange Industry Volume Breakdown (Kiloton, %) by Region 2024 & 2032
- Figure 3: South America Orange Industry Revenue (Million), by Country 2024 & 2032
- Figure 4: South America Orange Industry Volume (Kiloton), by Country 2024 & 2032
- Figure 5: South America Orange Industry Revenue Share (%), by Country 2024 & 2032
- Figure 6: South America Orange Industry Volume Share (%), by Country 2024 & 2032
- Figure 7: North America Orange Industry Revenue (Million), by Country 2024 & 2032
- Figure 8: North America Orange Industry Volume (Kiloton), by Country 2024 & 2032
- Figure 9: North America Orange Industry Revenue Share (%), by Country 2024 & 2032
- Figure 10: North America Orange Industry Volume Share (%), by Country 2024 & 2032
- Figure 11: MEA Orange Industry Revenue (Million), by Country 2024 & 2032
- Figure 12: MEA Orange Industry Volume (Kiloton), by Country 2024 & 2032
- Figure 13: MEA Orange Industry Revenue Share (%), by Country 2024 & 2032
- Figure 14: MEA Orange Industry Volume Share (%), by Country 2024 & 2032
- Figure 15: Europe Orange Industry Revenue (Million), by Country 2024 & 2032
- Figure 16: Europe Orange Industry Volume (Kiloton), by Country 2024 & 2032
- Figure 17: Europe Orange Industry Revenue Share (%), by Country 2024 & 2032
- Figure 18: Europe Orange Industry Volume Share (%), by Country 2024 & 2032
- Figure 19: Asia Pacific Orange Industry Revenue (Million), by Country 2024 & 2032
- Figure 20: Asia Pacific Orange Industry Volume (Kiloton), by Country 2024 & 2032
- Figure 21: Asia Pacific Orange Industry Revenue Share (%), by Country 2024 & 2032
- Figure 22: Asia Pacific Orange Industry Volume Share (%), by Country 2024 & 2032
- Figure 23: Brazil Orange Industry Revenue (Million), by Production Analysis 2024 & 2032
- Figure 24: Brazil Orange Industry Volume (Kiloton), by Production Analysis 2024 & 2032
- Figure 25: Brazil Orange Industry Revenue Share (%), by Production Analysis 2024 & 2032
- Figure 26: Brazil Orange Industry Volume Share (%), by Production Analysis 2024 & 2032
- Figure 27: Brazil Orange Industry Revenue (Million), by Consumption Analysis 2024 & 2032
- Figure 28: Brazil Orange Industry Volume (Kiloton), by Consumption Analysis 2024 & 2032
- Figure 29: Brazil Orange Industry Revenue Share (%), by Consumption Analysis 2024 & 2032
- Figure 30: Brazil Orange Industry Volume Share (%), by Consumption Analysis 2024 & 2032
- Figure 31: Brazil Orange Industry Revenue (Million), by Import Market Analysis (Value & Volume) 2024 & 2032
- Figure 32: Brazil Orange Industry Volume (Kiloton), by Import Market Analysis (Value & Volume) 2024 & 2032
- Figure 33: Brazil Orange Industry Revenue Share (%), by Import Market Analysis (Value & Volume) 2024 & 2032
- Figure 34: Brazil Orange Industry Volume Share (%), by Import Market Analysis (Value & Volume) 2024 & 2032
- Figure 35: Brazil Orange Industry Revenue (Million), by Export Market Analysis (Value & Volume) 2024 & 2032
- Figure 36: Brazil Orange Industry Volume (Kiloton), by Export Market Analysis (Value & Volume) 2024 & 2032
- Figure 37: Brazil Orange Industry Revenue Share (%), by Export Market Analysis (Value & Volume) 2024 & 2032
- Figure 38: Brazil Orange Industry Volume Share (%), by Export Market Analysis (Value & Volume) 2024 & 2032
- Figure 39: Brazil Orange Industry Revenue (Million), by Price Trend Analysis 2024 & 2032
- Figure 40: Brazil Orange Industry Volume (Kiloton), by Price Trend Analysis 2024 & 2032
- Figure 41: Brazil Orange Industry Revenue Share (%), by Price Trend Analysis 2024 & 2032
- Figure 42: Brazil Orange Industry Volume Share (%), by Price Trend Analysis 2024 & 2032
- Figure 43: Brazil Orange Industry Revenue (Million), by Country 2024 & 2032
- Figure 44: Brazil Orange Industry Volume (Kiloton), by Country 2024 & 2032
- Figure 45: Brazil Orange Industry Revenue Share (%), by Country 2024 & 2032
- Figure 46: Brazil Orange Industry Volume Share (%), by Country 2024 & 2032
- Figure 47: China Orange Industry Revenue (Million), by Production Analysis 2024 & 2032
- Figure 48: China Orange Industry Volume (Kiloton), by Production Analysis 2024 & 2032
- Figure 49: China Orange Industry Revenue Share (%), by Production Analysis 2024 & 2032
- Figure 50: China Orange Industry Volume Share (%), by Production Analysis 2024 & 2032
- Figure 51: China Orange Industry Revenue (Million), by Consumption Analysis 2024 & 2032
- Figure 52: China Orange Industry Volume (Kiloton), by Consumption Analysis 2024 & 2032
- Figure 53: China Orange Industry Revenue Share (%), by Consumption Analysis 2024 & 2032
- Figure 54: China Orange Industry Volume Share (%), by Consumption Analysis 2024 & 2032
- Figure 55: China Orange Industry Revenue (Million), by Import Market Analysis (Value & Volume) 2024 & 2032
- Figure 56: China Orange Industry Volume (Kiloton), by Import Market Analysis (Value & Volume) 2024 & 2032
- Figure 57: China Orange Industry Revenue Share (%), by Import Market Analysis (Value & Volume) 2024 & 2032
- Figure 58: China Orange Industry Volume Share (%), by Import Market Analysis (Value & Volume) 2024 & 2032
- Figure 59: China Orange Industry Revenue (Million), by Export Market Analysis (Value & Volume) 2024 & 2032
- Figure 60: China Orange Industry Volume (Kiloton), by Export Market Analysis (Value & Volume) 2024 & 2032
- Figure 61: China Orange Industry Revenue Share (%), by Export Market Analysis (Value & Volume) 2024 & 2032
- Figure 62: China Orange Industry Volume Share (%), by Export Market Analysis (Value & Volume) 2024 & 2032
- Figure 63: China Orange Industry Revenue (Million), by Price Trend Analysis 2024 & 2032
- Figure 64: China Orange Industry Volume (Kiloton), by Price Trend Analysis 2024 & 2032
- Figure 65: China Orange Industry Revenue Share (%), by Price Trend Analysis 2024 & 2032
- Figure 66: China Orange Industry Volume Share (%), by Price Trend Analysis 2024 & 2032
- Figure 67: China Orange Industry Revenue (Million), by Country 2024 & 2032
- Figure 68: China Orange Industry Volume (Kiloton), by Country 2024 & 2032
- Figure 69: China Orange Industry Revenue Share (%), by Country 2024 & 2032
- Figure 70: China Orange Industry Volume Share (%), by Country 2024 & 2032
- Figure 71: India Orange Industry Revenue (Million), by Production Analysis 2024 & 2032
- Figure 72: India Orange Industry Volume (Kiloton), by Production Analysis 2024 & 2032
- Figure 73: India Orange Industry Revenue Share (%), by Production Analysis 2024 & 2032
- Figure 74: India Orange Industry Volume Share (%), by Production Analysis 2024 & 2032
- Figure 75: India Orange Industry Revenue (Million), by Consumption Analysis 2024 & 2032
- Figure 76: India Orange Industry Volume (Kiloton), by Consumption Analysis 2024 & 2032
- Figure 77: India Orange Industry Revenue Share (%), by Consumption Analysis 2024 & 2032
- Figure 78: India Orange Industry Volume Share (%), by Consumption Analysis 2024 & 2032
- Figure 79: India Orange Industry Revenue (Million), by Import Market Analysis (Value & Volume) 2024 & 2032
- Figure 80: India Orange Industry Volume (Kiloton), by Import Market Analysis (Value & Volume) 2024 & 2032
- Figure 81: India Orange Industry Revenue Share (%), by Import Market Analysis (Value & Volume) 2024 & 2032
- Figure 82: India Orange Industry Volume Share (%), by Import Market Analysis (Value & Volume) 2024 & 2032
- Figure 83: India Orange Industry Revenue (Million), by Export Market Analysis (Value & Volume) 2024 & 2032
- Figure 84: India Orange Industry Volume (Kiloton), by Export Market Analysis (Value & Volume) 2024 & 2032
- Figure 85: India Orange Industry Revenue Share (%), by Export Market Analysis (Value & Volume) 2024 & 2032
- Figure 86: India Orange Industry Volume Share (%), by Export Market Analysis (Value & Volume) 2024 & 2032
- Figure 87: India Orange Industry Revenue (Million), by Price Trend Analysis 2024 & 2032
- Figure 88: India Orange Industry Volume (Kiloton), by Price Trend Analysis 2024 & 2032
- Figure 89: India Orange Industry Revenue Share (%), by Price Trend Analysis 2024 & 2032
- Figure 90: India Orange Industry Volume Share (%), by Price Trend Analysis 2024 & 2032
- Figure 91: India Orange Industry Revenue (Million), by Country 2024 & 2032
- Figure 92: India Orange Industry Volume (Kiloton), by Country 2024 & 2032
- Figure 93: India Orange Industry Revenue Share (%), by Country 2024 & 2032
- Figure 94: India Orange Industry Volume Share (%), by Country 2024 & 2032
- Figure 95: Mexico Orange Industry Revenue (Million), by Production Analysis 2024 & 2032
- Figure 96: Mexico Orange Industry Volume (Kiloton), by Production Analysis 2024 & 2032
- Figure 97: Mexico Orange Industry Revenue Share (%), by Production Analysis 2024 & 2032
- Figure 98: Mexico Orange Industry Volume Share (%), by Production Analysis 2024 & 2032
- Figure 99: Mexico Orange Industry Revenue (Million), by Consumption Analysis 2024 & 2032
- Figure 100: Mexico Orange Industry Volume (Kiloton), by Consumption Analysis 2024 & 2032
- Figure 101: Mexico Orange Industry Revenue Share (%), by Consumption Analysis 2024 & 2032
- Figure 102: Mexico Orange Industry Volume Share (%), by Consumption Analysis 2024 & 2032
- Figure 103: Mexico Orange Industry Revenue (Million), by Import Market Analysis (Value & Volume) 2024 & 2032
- Figure 104: Mexico Orange Industry Volume (Kiloton), by Import Market Analysis (Value & Volume) 2024 & 2032
- Figure 105: Mexico Orange Industry Revenue Share (%), by Import Market Analysis (Value & Volume) 2024 & 2032
- Figure 106: Mexico Orange Industry Volume Share (%), by Import Market Analysis (Value & Volume) 2024 & 2032
- Figure 107: Mexico Orange Industry Revenue (Million), by Export Market Analysis (Value & Volume) 2024 & 2032
- Figure 108: Mexico Orange Industry Volume (Kiloton), by Export Market Analysis (Value & Volume) 2024 & 2032
- Figure 109: Mexico Orange Industry Revenue Share (%), by Export Market Analysis (Value & Volume) 2024 & 2032
- Figure 110: Mexico Orange Industry Volume Share (%), by Export Market Analysis (Value & Volume) 2024 & 2032
- Figure 111: Mexico Orange Industry Revenue (Million), by Price Trend Analysis 2024 & 2032
- Figure 112: Mexico Orange Industry Volume (Kiloton), by Price Trend Analysis 2024 & 2032
- Figure 113: Mexico Orange Industry Revenue Share (%), by Price Trend Analysis 2024 & 2032
- Figure 114: Mexico Orange Industry Volume Share (%), by Price Trend Analysis 2024 & 2032
- Figure 115: Mexico Orange Industry Revenue (Million), by Country 2024 & 2032
- Figure 116: Mexico Orange Industry Volume (Kiloton), by Country 2024 & 2032
- Figure 117: Mexico Orange Industry Revenue Share (%), by Country 2024 & 2032
- Figure 118: Mexico Orange Industry Volume Share (%), by Country 2024 & 2032
- Figure 119: United States Orange Industry Revenue (Million), by Production Analysis 2024 & 2032
- Figure 120: United States Orange Industry Volume (Kiloton), by Production Analysis 2024 & 2032
- Figure 121: United States Orange Industry Revenue Share (%), by Production Analysis 2024 & 2032
- Figure 122: United States Orange Industry Volume Share (%), by Production Analysis 2024 & 2032
- Figure 123: United States Orange Industry Revenue (Million), by Consumption Analysis 2024 & 2032
- Figure 124: United States Orange Industry Volume (Kiloton), by Consumption Analysis 2024 & 2032
- Figure 125: United States Orange Industry Revenue Share (%), by Consumption Analysis 2024 & 2032
- Figure 126: United States Orange Industry Volume Share (%), by Consumption Analysis 2024 & 2032
- Figure 127: United States Orange Industry Revenue (Million), by Import Market Analysis (Value & Volume) 2024 & 2032
- Figure 128: United States Orange Industry Volume (Kiloton), by Import Market Analysis (Value & Volume) 2024 & 2032
- Figure 129: United States Orange Industry Revenue Share (%), by Import Market Analysis (Value & Volume) 2024 & 2032
- Figure 130: United States Orange Industry Volume Share (%), by Import Market Analysis (Value & Volume) 2024 & 2032
- Figure 131: United States Orange Industry Revenue (Million), by Export Market Analysis (Value & Volume) 2024 & 2032
- Figure 132: United States Orange Industry Volume (Kiloton), by Export Market Analysis (Value & Volume) 2024 & 2032
- Figure 133: United States Orange Industry Revenue Share (%), by Export Market Analysis (Value & Volume) 2024 & 2032
- Figure 134: United States Orange Industry Volume Share (%), by Export Market Analysis (Value & Volume) 2024 & 2032
- Figure 135: United States Orange Industry Revenue (Million), by Price Trend Analysis 2024 & 2032
- Figure 136: United States Orange Industry Volume (Kiloton), by Price Trend Analysis 2024 & 2032
- Figure 137: United States Orange Industry Revenue Share (%), by Price Trend Analysis 2024 & 2032
- Figure 138: United States Orange Industry Volume Share (%), by Price Trend Analysis 2024 & 2032
- Figure 139: United States Orange Industry Revenue (Million), by Country 2024 & 2032
- Figure 140: United States Orange Industry Volume (Kiloton), by Country 2024 & 2032
- Figure 141: United States Orange Industry Revenue Share (%), by Country 2024 & 2032
- Figure 142: United States Orange Industry Volume Share (%), by Country 2024 & 2032
- Figure 143: European Union Orange Industry Revenue (Million), by Production Analysis 2024 & 2032
- Figure 144: European Union Orange Industry Volume (Kiloton), by Production Analysis 2024 & 2032
- Figure 145: European Union Orange Industry Revenue Share (%), by Production Analysis 2024 & 2032
- Figure 146: European Union Orange Industry Volume Share (%), by Production Analysis 2024 & 2032
- Figure 147: European Union Orange Industry Revenue (Million), by Consumption Analysis 2024 & 2032
- Figure 148: European Union Orange Industry Volume (Kiloton), by Consumption Analysis 2024 & 2032
- Figure 149: European Union Orange Industry Revenue Share (%), by Consumption Analysis 2024 & 2032
- Figure 150: European Union Orange Industry Volume Share (%), by Consumption Analysis 2024 & 2032
- Figure 151: European Union Orange Industry Revenue (Million), by Import Market Analysis (Value & Volume) 2024 & 2032
- Figure 152: European Union Orange Industry Volume (Kiloton), by Import Market Analysis (Value & Volume) 2024 & 2032
- Figure 153: European Union Orange Industry Revenue Share (%), by Import Market Analysis (Value & Volume) 2024 & 2032
- Figure 154: European Union Orange Industry Volume Share (%), by Import Market Analysis (Value & Volume) 2024 & 2032
- Figure 155: European Union Orange Industry Revenue (Million), by Export Market Analysis (Value & Volume) 2024 & 2032
- Figure 156: European Union Orange Industry Volume (Kiloton), by Export Market Analysis (Value & Volume) 2024 & 2032
- Figure 157: European Union Orange Industry Revenue Share (%), by Export Market Analysis (Value & Volume) 2024 & 2032
- Figure 158: European Union Orange Industry Volume Share (%), by Export Market Analysis (Value & Volume) 2024 & 2032
- Figure 159: European Union Orange Industry Revenue (Million), by Price Trend Analysis 2024 & 2032
- Figure 160: European Union Orange Industry Volume (Kiloton), by Price Trend Analysis 2024 & 2032
- Figure 161: European Union Orange Industry Revenue Share (%), by Price Trend Analysis 2024 & 2032
- Figure 162: European Union Orange Industry Volume Share (%), by Price Trend Analysis 2024 & 2032
- Figure 163: European Union Orange Industry Revenue (Million), by Country 2024 & 2032
- Figure 164: European Union Orange Industry Volume (Kiloton), by Country 2024 & 2032
- Figure 165: European Union Orange Industry Revenue Share (%), by Country 2024 & 2032
- Figure 166: European Union Orange Industry Volume Share (%), by Country 2024 & 2032
- Figure 167: Egypt Orange Industry Revenue (Million), by Production Analysis 2024 & 2032
- Figure 168: Egypt Orange Industry Volume (Kiloton), by Production Analysis 2024 & 2032
- Figure 169: Egypt Orange Industry Revenue Share (%), by Production Analysis 2024 & 2032
- Figure 170: Egypt Orange Industry Volume Share (%), by Production Analysis 2024 & 2032
- Figure 171: Egypt Orange Industry Revenue (Million), by Consumption Analysis 2024 & 2032
- Figure 172: Egypt Orange Industry Volume (Kiloton), by Consumption Analysis 2024 & 2032
- Figure 173: Egypt Orange Industry Revenue Share (%), by Consumption Analysis 2024 & 2032
- Figure 174: Egypt Orange Industry Volume Share (%), by Consumption Analysis 2024 & 2032
- Figure 175: Egypt Orange Industry Revenue (Million), by Import Market Analysis (Value & Volume) 2024 & 2032
- Figure 176: Egypt Orange Industry Volume (Kiloton), by Import Market Analysis (Value & Volume) 2024 & 2032
- Figure 177: Egypt Orange Industry Revenue Share (%), by Import Market Analysis (Value & Volume) 2024 & 2032
- Figure 178: Egypt Orange Industry Volume Share (%), by Import Market Analysis (Value & Volume) 2024 & 2032
- Figure 179: Egypt Orange Industry Revenue (Million), by Export Market Analysis (Value & Volume) 2024 & 2032
- Figure 180: Egypt Orange Industry Volume (Kiloton), by Export Market Analysis (Value & Volume) 2024 & 2032
- Figure 181: Egypt Orange Industry Revenue Share (%), by Export Market Analysis (Value & Volume) 2024 & 2032
- Figure 182: Egypt Orange Industry Volume Share (%), by Export Market Analysis (Value & Volume) 2024 & 2032
- Figure 183: Egypt Orange Industry Revenue (Million), by Price Trend Analysis 2024 & 2032
- Figure 184: Egypt Orange Industry Volume (Kiloton), by Price Trend Analysis 2024 & 2032
- Figure 185: Egypt Orange Industry Revenue Share (%), by Price Trend Analysis 2024 & 2032
- Figure 186: Egypt Orange Industry Volume Share (%), by Price Trend Analysis 2024 & 2032
- Figure 187: Egypt Orange Industry Revenue (Million), by Country 2024 & 2032
- Figure 188: Egypt Orange Industry Volume (Kiloton), by Country 2024 & 2032
- Figure 189: Egypt Orange Industry Revenue Share (%), by Country 2024 & 2032
- Figure 190: Egypt Orange Industry Volume Share (%), by Country 2024 & 2032
- Figure 191: South Africa Orange Industry Revenue (Million), by Production Analysis 2024 & 2032
- Figure 192: South Africa Orange Industry Volume (Kiloton), by Production Analysis 2024 & 2032
- Figure 193: South Africa Orange Industry Revenue Share (%), by Production Analysis 2024 & 2032
- Figure 194: South Africa Orange Industry Volume Share (%), by Production Analysis 2024 & 2032
- Figure 195: South Africa Orange Industry Revenue (Million), by Consumption Analysis 2024 & 2032
- Figure 196: South Africa Orange Industry Volume (Kiloton), by Consumption Analysis 2024 & 2032
- Figure 197: South Africa Orange Industry Revenue Share (%), by Consumption Analysis 2024 & 2032
- Figure 198: South Africa Orange Industry Volume Share (%), by Consumption Analysis 2024 & 2032
- Figure 199: South Africa Orange Industry Revenue (Million), by Import Market Analysis (Value & Volume) 2024 & 2032
- Figure 200: South Africa Orange Industry Volume (Kiloton), by Import Market Analysis (Value & Volume) 2024 & 2032
- Figure 201: South Africa Orange Industry Revenue Share (%), by Import Market Analysis (Value & Volume) 2024 & 2032
- Figure 202: South Africa Orange Industry Volume Share (%), by Import Market Analysis (Value & Volume) 2024 & 2032
- Figure 203: South Africa Orange Industry Revenue (Million), by Export Market Analysis (Value & Volume) 2024 & 2032
- Figure 204: South Africa Orange Industry Volume (Kiloton), by Export Market Analysis (Value & Volume) 2024 & 2032
- Figure 205: South Africa Orange Industry Revenue Share (%), by Export Market Analysis (Value & Volume) 2024 & 2032
- Figure 206: South Africa Orange Industry Volume Share (%), by Export Market Analysis (Value & Volume) 2024 & 2032
- Figure 207: South Africa Orange Industry Revenue (Million), by Price Trend Analysis 2024 & 2032
- Figure 208: South Africa Orange Industry Volume (Kiloton), by Price Trend Analysis 2024 & 2032
- Figure 209: South Africa Orange Industry Revenue Share (%), by Price Trend Analysis 2024 & 2032
- Figure 210: South Africa Orange Industry Volume Share (%), by Price Trend Analysis 2024 & 2032
- Figure 211: South Africa Orange Industry Revenue (Million), by Country 2024 & 2032
- Figure 212: South Africa Orange Industry Volume (Kiloton), by Country 2024 & 2032
- Figure 213: South Africa Orange Industry Revenue Share (%), by Country 2024 & 2032
- Figure 214: South Africa Orange Industry Volume Share (%), by Country 2024 & 2032
- Figure 215: Indonesia Orange Industry Revenue (Million), by Production Analysis 2024 & 2032
- Figure 216: Indonesia Orange Industry Volume (Kiloton), by Production Analysis 2024 & 2032
- Figure 217: Indonesia Orange Industry Revenue Share (%), by Production Analysis 2024 & 2032
- Figure 218: Indonesia Orange Industry Volume Share (%), by Production Analysis 2024 & 2032
- Figure 219: Indonesia Orange Industry Revenue (Million), by Consumption Analysis 2024 & 2032
- Figure 220: Indonesia Orange Industry Volume (Kiloton), by Consumption Analysis 2024 & 2032
- Figure 221: Indonesia Orange Industry Revenue Share (%), by Consumption Analysis 2024 & 2032
- Figure 222: Indonesia Orange Industry Volume Share (%), by Consumption Analysis 2024 & 2032
- Figure 223: Indonesia Orange Industry Revenue (Million), by Import Market Analysis (Value & Volume) 2024 & 2032
- Figure 224: Indonesia Orange Industry Volume (Kiloton), by Import Market Analysis (Value & Volume) 2024 & 2032
- Figure 225: Indonesia Orange Industry Revenue Share (%), by Import Market Analysis (Value & Volume) 2024 & 2032
- Figure 226: Indonesia Orange Industry Volume Share (%), by Import Market Analysis (Value & Volume) 2024 & 2032
- Figure 227: Indonesia Orange Industry Revenue (Million), by Export Market Analysis (Value & Volume) 2024 & 2032
- Figure 228: Indonesia Orange Industry Volume (Kiloton), by Export Market Analysis (Value & Volume) 2024 & 2032
- Figure 229: Indonesia Orange Industry Revenue Share (%), by Export Market Analysis (Value & Volume) 2024 & 2032
- Figure 230: Indonesia Orange Industry Volume Share (%), by Export Market Analysis (Value & Volume) 2024 & 2032
- Figure 231: Indonesia Orange Industry Revenue (Million), by Price Trend Analysis 2024 & 2032
- Figure 232: Indonesia Orange Industry Volume (Kiloton), by Price Trend Analysis 2024 & 2032
- Figure 233: Indonesia Orange Industry Revenue Share (%), by Price Trend Analysis 2024 & 2032
- Figure 234: Indonesia Orange Industry Volume Share (%), by Price Trend Analysis 2024 & 2032
- Figure 235: Indonesia Orange Industry Revenue (Million), by Country 2024 & 2032
- Figure 236: Indonesia Orange Industry Volume (Kiloton), by Country 2024 & 2032
- Figure 237: Indonesia Orange Industry Revenue Share (%), by Country 2024 & 2032
- Figure 238: Indonesia Orange Industry Volume Share (%), by Country 2024 & 2032
- Figure 239: Turkey Orange Industry Revenue (Million), by Production Analysis 2024 & 2032
- Figure 240: Turkey Orange Industry Volume (Kiloton), by Production Analysis 2024 & 2032
- Figure 241: Turkey Orange Industry Revenue Share (%), by Production Analysis 2024 & 2032
- Figure 242: Turkey Orange Industry Volume Share (%), by Production Analysis 2024 & 2032
- Figure 243: Turkey Orange Industry Revenue (Million), by Consumption Analysis 2024 & 2032
- Figure 244: Turkey Orange Industry Volume (Kiloton), by Consumption Analysis 2024 & 2032
- Figure 245: Turkey Orange Industry Revenue Share (%), by Consumption Analysis 2024 & 2032
- Figure 246: Turkey Orange Industry Volume Share (%), by Consumption Analysis 2024 & 2032
- Figure 247: Turkey Orange Industry Revenue (Million), by Import Market Analysis (Value & Volume) 2024 & 2032
- Figure 248: Turkey Orange Industry Volume (Kiloton), by Import Market Analysis (Value & Volume) 2024 & 2032
- Figure 249: Turkey Orange Industry Revenue Share (%), by Import Market Analysis (Value & Volume) 2024 & 2032
- Figure 250: Turkey Orange Industry Volume Share (%), by Import Market Analysis (Value & Volume) 2024 & 2032
- Figure 251: Turkey Orange Industry Revenue (Million), by Export Market Analysis (Value & Volume) 2024 & 2032
- Figure 252: Turkey Orange Industry Volume (Kiloton), by Export Market Analysis (Value & Volume) 2024 & 2032
- Figure 253: Turkey Orange Industry Revenue Share (%), by Export Market Analysis (Value & Volume) 2024 & 2032
- Figure 254: Turkey Orange Industry Volume Share (%), by Export Market Analysis (Value & Volume) 2024 & 2032
- Figure 255: Turkey Orange Industry Revenue (Million), by Price Trend Analysis 2024 & 2032
- Figure 256: Turkey Orange Industry Volume (Kiloton), by Price Trend Analysis 2024 & 2032
- Figure 257: Turkey Orange Industry Revenue Share (%), by Price Trend Analysis 2024 & 2032
- Figure 258: Turkey Orange Industry Volume Share (%), by Price Trend Analysis 2024 & 2032
- Figure 259: Turkey Orange Industry Revenue (Million), by Country 2024 & 2032
- Figure 260: Turkey Orange Industry Volume (Kiloton), by Country 2024 & 2032
- Figure 261: Turkey Orange Industry Revenue Share (%), by Country 2024 & 2032
- Figure 262: Turkey Orange Industry Volume Share (%), by Country 2024 & 2032
List of Tables
- Table 1: Global Orange Industry Revenue Million Forecast, by Region 2019 & 2032
- Table 2: Global Orange Industry Volume Kiloton Forecast, by Region 2019 & 2032
- Table 3: Global Orange Industry Revenue Million Forecast, by Production Analysis 2019 & 2032
- Table 4: Global Orange Industry Volume Kiloton Forecast, by Production Analysis 2019 & 2032
- Table 5: Global Orange Industry Revenue Million Forecast, by Consumption Analysis 2019 & 2032
- Table 6: Global Orange Industry Volume Kiloton Forecast, by Consumption Analysis 2019 & 2032
- Table 7: Global Orange Industry Revenue Million Forecast, by Import Market Analysis (Value & Volume) 2019 & 2032
- Table 8: Global Orange Industry Volume Kiloton Forecast, by Import Market Analysis (Value & Volume) 2019 & 2032
- Table 9: Global Orange Industry Revenue Million Forecast, by Export Market Analysis (Value & Volume) 2019 & 2032
- Table 10: Global Orange Industry Volume Kiloton Forecast, by Export Market Analysis (Value & Volume) 2019 & 2032
- Table 11: Global Orange Industry Revenue Million Forecast, by Price Trend Analysis 2019 & 2032
- Table 12: Global Orange Industry Volume Kiloton Forecast, by Price Trend Analysis 2019 & 2032
- Table 13: Global Orange Industry Revenue Million Forecast, by Region 2019 & 2032
- Table 14: Global Orange Industry Volume Kiloton Forecast, by Region 2019 & 2032
- Table 15: Global Orange Industry Revenue Million Forecast, by Country 2019 & 2032
- Table 16: Global Orange Industry Volume Kiloton Forecast, by Country 2019 & 2032
- Table 17: Brazil Orange Industry Revenue (Million) Forecast, by Application 2019 & 2032
- Table 18: Brazil Orange Industry Volume (Kiloton) Forecast, by Application 2019 & 2032
- Table 19: Argentina Orange Industry Revenue (Million) Forecast, by Application 2019 & 2032
- Table 20: Argentina Orange Industry Volume (Kiloton) Forecast, by Application 2019 & 2032
- Table 21: Rest of South America Orange Industry Revenue (Million) Forecast, by Application 2019 & 2032
- Table 22: Rest of South America Orange Industry Volume (Kiloton) Forecast, by Application 2019 & 2032
- Table 23: Global Orange Industry Revenue Million Forecast, by Country 2019 & 2032
- Table 24: Global Orange Industry Volume Kiloton Forecast, by Country 2019 & 2032
- Table 25: United States Orange Industry Revenue (Million) Forecast, by Application 2019 & 2032
- Table 26: United States Orange Industry Volume (Kiloton) Forecast, by Application 2019 & 2032
- Table 27: Canada Orange Industry Revenue (Million) Forecast, by Application 2019 & 2032
- Table 28: Canada Orange Industry Volume (Kiloton) Forecast, by Application 2019 & 2032
- Table 29: Mexico Orange Industry Revenue (Million) Forecast, by Application 2019 & 2032
- Table 30: Mexico Orange Industry Volume (Kiloton) Forecast, by Application 2019 & 2032
- Table 31: Global Orange Industry Revenue Million Forecast, by Country 2019 & 2032
- Table 32: Global Orange Industry Volume Kiloton Forecast, by Country 2019 & 2032
- Table 33: Middle East Orange Industry Revenue (Million) Forecast, by Application 2019 & 2032
- Table 34: Middle East Orange Industry Volume (Kiloton) Forecast, by Application 2019 & 2032
- Table 35: Africa Orange Industry Revenue (Million) Forecast, by Application 2019 & 2032
- Table 36: Africa Orange Industry Volume (Kiloton) Forecast, by Application 2019 & 2032
- Table 37: Global Orange Industry Revenue Million Forecast, by Country 2019 & 2032
- Table 38: Global Orange Industry Volume Kiloton Forecast, by Country 2019 & 2032
- Table 39: Germany Orange Industry Revenue (Million) Forecast, by Application 2019 & 2032
- Table 40: Germany Orange Industry Volume (Kiloton) Forecast, by Application 2019 & 2032
- Table 41: France Orange Industry Revenue (Million) Forecast, by Application 2019 & 2032
- Table 42: France Orange Industry Volume (Kiloton) Forecast, by Application 2019 & 2032
- Table 43: Italy Orange Industry Revenue (Million) Forecast, by Application 2019 & 2032
- Table 44: Italy Orange Industry Volume (Kiloton) Forecast, by Application 2019 & 2032
- Table 45: United Kingdom Orange Industry Revenue (Million) Forecast, by Application 2019 & 2032
- Table 46: United Kingdom Orange Industry Volume (Kiloton) Forecast, by Application 2019 & 2032
- Table 47: Netherlands Orange Industry Revenue (Million) Forecast, by Application 2019 & 2032
- Table 48: Netherlands Orange Industry Volume (Kiloton) Forecast, by Application 2019 & 2032
- Table 49: Rest of Europe Orange Industry Revenue (Million) Forecast, by Application 2019 & 2032
- Table 50: Rest of Europe Orange Industry Volume (Kiloton) Forecast, by Application 2019 & 2032
- Table 51: Global Orange Industry Revenue Million Forecast, by Country 2019 & 2032
- Table 52: Global Orange Industry Volume Kiloton Forecast, by Country 2019 & 2032
- Table 53: China Orange Industry Revenue (Million) Forecast, by Application 2019 & 2032
- Table 54: China Orange Industry Volume (Kiloton) Forecast, by Application 2019 & 2032
- Table 55: Japan Orange Industry Revenue (Million) Forecast, by Application 2019 & 2032
- Table 56: Japan Orange Industry Volume (Kiloton) Forecast, by Application 2019 & 2032
- Table 57: India Orange Industry Revenue (Million) Forecast, by Application 2019 & 2032
- Table 58: India Orange Industry Volume (Kiloton) Forecast, by Application 2019 & 2032
- Table 59: South Korea Orange Industry Revenue (Million) Forecast, by Application 2019 & 2032
- Table 60: South Korea Orange Industry Volume (Kiloton) Forecast, by Application 2019 & 2032
- Table 61: Taiwan Orange Industry Revenue (Million) Forecast, by Application 2019 & 2032
- Table 62: Taiwan Orange Industry Volume (Kiloton) Forecast, by Application 2019 & 2032
- Table 63: Australia Orange Industry Revenue (Million) Forecast, by Application 2019 & 2032
- Table 64: Australia Orange Industry Volume (Kiloton) Forecast, by Application 2019 & 2032
- Table 65: Rest of Asia-Pacific Orange Industry Revenue (Million) Forecast, by Application 2019 & 2032
- Table 66: Rest of Asia-Pacific Orange Industry Volume (Kiloton) Forecast, by Application 2019 & 2032
- Table 67: Global Orange Industry Revenue Million Forecast, by Production Analysis 2019 & 2032
- Table 68: Global Orange Industry Volume Kiloton Forecast, by Production Analysis 2019 & 2032
- Table 69: Global Orange Industry Revenue Million Forecast, by Consumption Analysis 2019 & 2032
- Table 70: Global Orange Industry Volume Kiloton Forecast, by Consumption Analysis 2019 & 2032
- Table 71: Global Orange Industry Revenue Million Forecast, by Import Market Analysis (Value & Volume) 2019 & 2032
- Table 72: Global Orange Industry Volume Kiloton Forecast, by Import Market Analysis (Value & Volume) 2019 & 2032
- Table 73: Global Orange Industry Revenue Million Forecast, by Export Market Analysis (Value & Volume) 2019 & 2032
- Table 74: Global Orange Industry Volume Kiloton Forecast, by Export Market Analysis (Value & Volume) 2019 & 2032
- Table 75: Global Orange Industry Revenue Million Forecast, by Price Trend Analysis 2019 & 2032
- Table 76: Global Orange Industry Volume Kiloton Forecast, by Price Trend Analysis 2019 & 2032
- Table 77: Global Orange Industry Revenue Million Forecast, by Country 2019 & 2032
- Table 78: Global Orange Industry Volume Kiloton Forecast, by Country 2019 & 2032
- Table 79: Global Orange Industry Revenue Million Forecast, by Production Analysis 2019 & 2032
- Table 80: Global Orange Industry Volume Kiloton Forecast, by Production Analysis 2019 & 2032
- Table 81: Global Orange Industry Revenue Million Forecast, by Consumption Analysis 2019 & 2032
- Table 82: Global Orange Industry Volume Kiloton Forecast, by Consumption Analysis 2019 & 2032
- Table 83: Global Orange Industry Revenue Million Forecast, by Import Market Analysis (Value & Volume) 2019 & 2032
- Table 84: Global Orange Industry Volume Kiloton Forecast, by Import Market Analysis (Value & Volume) 2019 & 2032
- Table 85: Global Orange Industry Revenue Million Forecast, by Export Market Analysis (Value & Volume) 2019 & 2032
- Table 86: Global Orange Industry Volume Kiloton Forecast, by Export Market Analysis (Value & Volume) 2019 & 2032
- Table 87: Global Orange Industry Revenue Million Forecast, by Price Trend Analysis 2019 & 2032
- Table 88: Global Orange Industry Volume Kiloton Forecast, by Price Trend Analysis 2019 & 2032
- Table 89: Global Orange Industry Revenue Million Forecast, by Country 2019 & 2032
- Table 90: Global Orange Industry Volume Kiloton Forecast, by Country 2019 & 2032
- Table 91: Global Orange Industry Revenue Million Forecast, by Production Analysis 2019 & 2032
- Table 92: Global Orange Industry Volume Kiloton Forecast, by Production Analysis 2019 & 2032
- Table 93: Global Orange Industry Revenue Million Forecast, by Consumption Analysis 2019 & 2032
- Table 94: Global Orange Industry Volume Kiloton Forecast, by Consumption Analysis 2019 & 2032
- Table 95: Global Orange Industry Revenue Million Forecast, by Import Market Analysis (Value & Volume) 2019 & 2032
- Table 96: Global Orange Industry Volume Kiloton Forecast, by Import Market Analysis (Value & Volume) 2019 & 2032
- Table 97: Global Orange Industry Revenue Million Forecast, by Export Market Analysis (Value & Volume) 2019 & 2032
- Table 98: Global Orange Industry Volume Kiloton Forecast, by Export Market Analysis (Value & Volume) 2019 & 2032
- Table 99: Global Orange Industry Revenue Million Forecast, by Price Trend Analysis 2019 & 2032
- Table 100: Global Orange Industry Volume Kiloton Forecast, by Price Trend Analysis 2019 & 2032
- Table 101: Global Orange Industry Revenue Million Forecast, by Country 2019 & 2032
- Table 102: Global Orange Industry Volume Kiloton Forecast, by Country 2019 & 2032
- Table 103: Global Orange Industry Revenue Million Forecast, by Production Analysis 2019 & 2032
- Table 104: Global Orange Industry Volume Kiloton Forecast, by Production Analysis 2019 & 2032
- Table 105: Global Orange Industry Revenue Million Forecast, by Consumption Analysis 2019 & 2032
- Table 106: Global Orange Industry Volume Kiloton Forecast, by Consumption Analysis 2019 & 2032
- Table 107: Global Orange Industry Revenue Million Forecast, by Import Market Analysis (Value & Volume) 2019 & 2032
- Table 108: Global Orange Industry Volume Kiloton Forecast, by Import Market Analysis (Value & Volume) 2019 & 2032
- Table 109: Global Orange Industry Revenue Million Forecast, by Export Market Analysis (Value & Volume) 2019 & 2032
- Table 110: Global Orange Industry Volume Kiloton Forecast, by Export Market Analysis (Value & Volume) 2019 & 2032
- Table 111: Global Orange Industry Revenue Million Forecast, by Price Trend Analysis 2019 & 2032
- Table 112: Global Orange Industry Volume Kiloton Forecast, by Price Trend Analysis 2019 & 2032
- Table 113: Global Orange Industry Revenue Million Forecast, by Country 2019 & 2032
- Table 114: Global Orange Industry Volume Kiloton Forecast, by Country 2019 & 2032
- Table 115: Global Orange Industry Revenue Million Forecast, by Production Analysis 2019 & 2032
- Table 116: Global Orange Industry Volume Kiloton Forecast, by Production Analysis 2019 & 2032
- Table 117: Global Orange Industry Revenue Million Forecast, by Consumption Analysis 2019 & 2032
- Table 118: Global Orange Industry Volume Kiloton Forecast, by Consumption Analysis 2019 & 2032
- Table 119: Global Orange Industry Revenue Million Forecast, by Import Market Analysis (Value & Volume) 2019 & 2032
- Table 120: Global Orange Industry Volume Kiloton Forecast, by Import Market Analysis (Value & Volume) 2019 & 2032
- Table 121: Global Orange Industry Revenue Million Forecast, by Export Market Analysis (Value & Volume) 2019 & 2032
- Table 122: Global Orange Industry Volume Kiloton Forecast, by Export Market Analysis (Value & Volume) 2019 & 2032
- Table 123: Global Orange Industry Revenue Million Forecast, by Price Trend Analysis 2019 & 2032
- Table 124: Global Orange Industry Volume Kiloton Forecast, by Price Trend Analysis 2019 & 2032
- Table 125: Global Orange Industry Revenue Million Forecast, by Country 2019 & 2032
- Table 126: Global Orange Industry Volume Kiloton Forecast, by Country 2019 & 2032
- Table 127: Global Orange Industry Revenue Million Forecast, by Production Analysis 2019 & 2032
- Table 128: Global Orange Industry Volume Kiloton Forecast, by Production Analysis 2019 & 2032
- Table 129: Global Orange Industry Revenue Million Forecast, by Consumption Analysis 2019 & 2032
- Table 130: Global Orange Industry Volume Kiloton Forecast, by Consumption Analysis 2019 & 2032
- Table 131: Global Orange Industry Revenue Million Forecast, by Import Market Analysis (Value & Volume) 2019 & 2032
- Table 132: Global Orange Industry Volume Kiloton Forecast, by Import Market Analysis (Value & Volume) 2019 & 2032
- Table 133: Global Orange Industry Revenue Million Forecast, by Export Market Analysis (Value & Volume) 2019 & 2032
- Table 134: Global Orange Industry Volume Kiloton Forecast, by Export Market Analysis (Value & Volume) 2019 & 2032
- Table 135: Global Orange Industry Revenue Million Forecast, by Price Trend Analysis 2019 & 2032
- Table 136: Global Orange Industry Volume Kiloton Forecast, by Price Trend Analysis 2019 & 2032
- Table 137: Global Orange Industry Revenue Million Forecast, by Country 2019 & 2032
- Table 138: Global Orange Industry Volume Kiloton Forecast, by Country 2019 & 2032
- Table 139: Global Orange Industry Revenue Million Forecast, by Production Analysis 2019 & 2032
- Table 140: Global Orange Industry Volume Kiloton Forecast, by Production Analysis 2019 & 2032
- Table 141: Global Orange Industry Revenue Million Forecast, by Consumption Analysis 2019 & 2032
- Table 142: Global Orange Industry Volume Kiloton Forecast, by Consumption Analysis 2019 & 2032
- Table 143: Global Orange Industry Revenue Million Forecast, by Import Market Analysis (Value & Volume) 2019 & 2032
- Table 144: Global Orange Industry Volume Kiloton Forecast, by Import Market Analysis (Value & Volume) 2019 & 2032
- Table 145: Global Orange Industry Revenue Million Forecast, by Export Market Analysis (Value & Volume) 2019 & 2032
- Table 146: Global Orange Industry Volume Kiloton Forecast, by Export Market Analysis (Value & Volume) 2019 & 2032
- Table 147: Global Orange Industry Revenue Million Forecast, by Price Trend Analysis 2019 & 2032
- Table 148: Global Orange Industry Volume Kiloton Forecast, by Price Trend Analysis 2019 & 2032
- Table 149: Global Orange Industry Revenue Million Forecast, by Country 2019 & 2032
- Table 150: Global Orange Industry Volume Kiloton Forecast, by Country 2019 & 2032
- Table 151: Global Orange Industry Revenue Million Forecast, by Production Analysis 2019 & 2032
- Table 152: Global Orange Industry Volume Kiloton Forecast, by Production Analysis 2019 & 2032
- Table 153: Global Orange Industry Revenue Million Forecast, by Consumption Analysis 2019 & 2032
- Table 154: Global Orange Industry Volume Kiloton Forecast, by Consumption Analysis 2019 & 2032
- Table 155: Global Orange Industry Revenue Million Forecast, by Import Market Analysis (Value & Volume) 2019 & 2032
- Table 156: Global Orange Industry Volume Kiloton Forecast, by Import Market Analysis (Value & Volume) 2019 & 2032
- Table 157: Global Orange Industry Revenue Million Forecast, by Export Market Analysis (Value & Volume) 2019 & 2032
- Table 158: Global Orange Industry Volume Kiloton Forecast, by Export Market Analysis (Value & Volume) 2019 & 2032
- Table 159: Global Orange Industry Revenue Million Forecast, by Price Trend Analysis 2019 & 2032
- Table 160: Global Orange Industry Volume Kiloton Forecast, by Price Trend Analysis 2019 & 2032
- Table 161: Global Orange Industry Revenue Million Forecast, by Country 2019 & 2032
- Table 162: Global Orange Industry Volume Kiloton Forecast, by Country 2019 & 2032
- Table 163: Global Orange Industry Revenue Million Forecast, by Production Analysis 2019 & 2032
- Table 164: Global Orange Industry Volume Kiloton Forecast, by Production Analysis 2019 & 2032
- Table 165: Global Orange Industry Revenue Million Forecast, by Consumption Analysis 2019 & 2032
- Table 166: Global Orange Industry Volume Kiloton Forecast, by Consumption Analysis 2019 & 2032
- Table 167: Global Orange Industry Revenue Million Forecast, by Import Market Analysis (Value & Volume) 2019 & 2032
- Table 168: Global Orange Industry Volume Kiloton Forecast, by Import Market Analysis (Value & Volume) 2019 & 2032
- Table 169: Global Orange Industry Revenue Million Forecast, by Export Market Analysis (Value & Volume) 2019 & 2032
- Table 170: Global Orange Industry Volume Kiloton Forecast, by Export Market Analysis (Value & Volume) 2019 & 2032
- Table 171: Global Orange Industry Revenue Million Forecast, by Price Trend Analysis 2019 & 2032
- Table 172: Global Orange Industry Volume Kiloton Forecast, by Price Trend Analysis 2019 & 2032
- Table 173: Global Orange Industry Revenue Million Forecast, by Country 2019 & 2032
- Table 174: Global Orange Industry Volume Kiloton Forecast, by Country 2019 & 2032
- Table 175: Global Orange Industry Revenue Million Forecast, by Production Analysis 2019 & 2032
- Table 176: Global Orange Industry Volume Kiloton Forecast, by Production Analysis 2019 & 2032
- Table 177: Global Orange Industry Revenue Million Forecast, by Consumption Analysis 2019 & 2032
- Table 178: Global Orange Industry Volume Kiloton Forecast, by Consumption Analysis 2019 & 2032
- Table 179: Global Orange Industry Revenue Million Forecast, by Import Market Analysis (Value & Volume) 2019 & 2032
- Table 180: Global Orange Industry Volume Kiloton Forecast, by Import Market Analysis (Value & Volume) 2019 & 2032
- Table 181: Global Orange Industry Revenue Million Forecast, by Export Market Analysis (Value & Volume) 2019 & 2032
- Table 182: Global Orange Industry Volume Kiloton Forecast, by Export Market Analysis (Value & Volume) 2019 & 2032
- Table 183: Global Orange Industry Revenue Million Forecast, by Price Trend Analysis 2019 & 2032
- Table 184: Global Orange Industry Volume Kiloton Forecast, by Price Trend Analysis 2019 & 2032
- Table 185: Global Orange Industry Revenue Million Forecast, by Country 2019 & 2032
- Table 186: Global Orange Industry Volume Kiloton Forecast, by Country 2019 & 2032
Frequently Asked Questions
1. What is the projected Compound Annual Growth Rate (CAGR) of the Orange Industry?
The projected CAGR is approximately 4.53%.
2. Which companies are prominent players in the Orange Industry?
Key companies in the market include The Coca-Cola Company , PepsiCo , Minute Maid, Tropicana Products, Inc. , Florida's Natural Growers.
3. What are the main segments of the Orange Industry?
The market segments include Production Analysis, Consumption Analysis, Import Market Analysis (Value & Volume), Export Market Analysis (Value & Volume), Price Trend Analysis.
4. Can you provide details about the market size?
The market size is estimated to be USD 3.84 Million as of 2022.
5. What are some drivers contributing to market growth?
Rising Consumption of Cashew Nuts as a Healthy Snack; Increasing Government initiatives; Growing Cashew Nut Imports in The United States.
6. What are the notable trends driving market growth?
Growing Seasonal Consumption of Orange.
7. Are there any restraints impacting market growth?
Hazardous Climatic Condition Hinders Cashew Production; Stringent Regulations Related To Food Quality Standards.
8. Can you provide examples of recent developments in the market?
November 2022: Arunachal Pradesh Agriculture Marketing Board exported the first 6 metric tons of oranges consignment to the UAE and Qatar in collaboration with the Agricultural and Processed Food Products Export Development Authority, the central government, and the Dubai-based Lulu Group International. The oranges will be launched at the Lulu Group's hypermarkets in the UAE and Qatar.
9. What pricing options are available for accessing the report?
Pricing options include single-user, multi-user, and enterprise licenses priced at USD 4750, USD 5250, and USD 8750 respectively.
10. Is the market size provided in terms of value or volume?
The market size is provided in terms of value, measured in Million and volume, measured in Kiloton.
11. Are there any specific market keywords associated with the report?
Yes, the market keyword associated with the report is "Orange Industry," which aids in identifying and referencing the specific market segment covered.
12. How do I determine which pricing option suits my needs best?
The pricing options vary based on user requirements and access needs. Individual users may opt for single-user licenses, while businesses requiring broader access may choose multi-user or enterprise licenses for cost-effective access to the report.
13. Are there any additional resources or data provided in the Orange Industry report?
While the report offers comprehensive insights, it's advisable to review the specific contents or supplementary materials provided to ascertain if additional resources or data are available.
14. How can I stay updated on further developments or reports in the Orange Industry?
To stay informed about further developments, trends, and reports in the Orange Industry, consider subscribing to industry newsletters, following relevant companies and organizations, or regularly checking reputable industry news sources and publications.
Methodology
Step 1 - Identification of Relevant Samples Size from Population Database


Step 2 - Approaches for Defining Global Market Size (Value, Volume* & Price*)

Note*: In applicable scenarios
Step 3 - Data Sources
Primary Research
- Web Analytics
- Survey Reports
- Research Institute
- Latest Research Reports
- Opinion Leaders
Secondary Research
- Annual Reports
- White Paper
- Latest Press Release
- Industry Association
- Paid Database
- Investor Presentations

Step 4 - Data Triangulation
Involves using different sources of information in order to increase the validity of a study
These sources are likely to be stakeholders in a program - participants, other researchers, program staff, other community members, and so on.
Then we put all data in single framework & apply various statistical tools to find out the dynamic on the market.
During the analysis stage, feedback from the stakeholder groups would be compared to determine areas of agreement as well as areas of divergence


