Key Insights
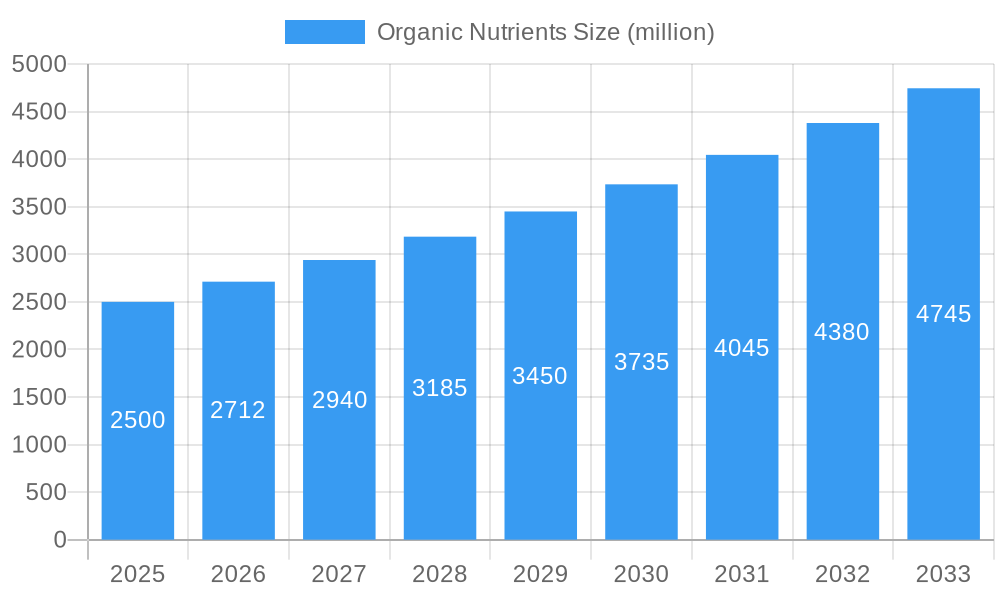
The global Organic Nutrients market is poised for significant expansion, projected to reach approximately USD 2,500 million by 2025, with an anticipated Compound Annual Growth Rate (CAGR) of around 8.5% during the forecast period of 2025-2033. This robust growth is primarily driven by a confluence of increasing consumer awareness regarding the health and environmental benefits of organic produce, coupled with a burgeoning demand for sustainable agricultural practices. The rising popularity of home gardening and urban farming further bolsters this trend, as consumers seek natural and eco-friendly solutions for their plants. The market is segmented into online and offline applications, with the online channel expected to witness a steeper growth trajectory due to its convenience and wider accessibility to specialized organic nutrient products. Indoor and outdoor plant applications represent key segments, catering to both commercial horticulture and individual plant enthusiasts.
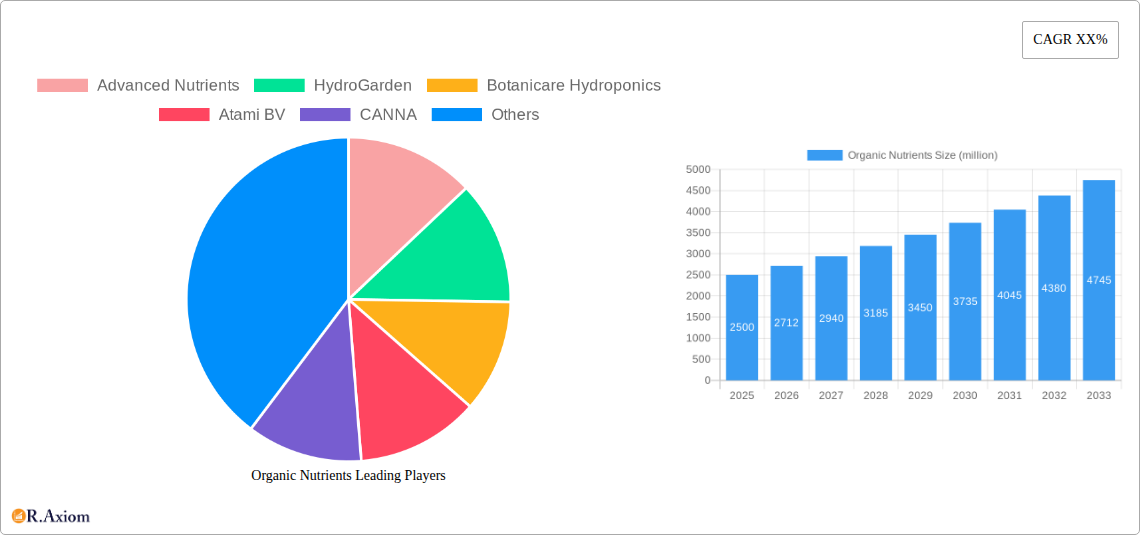
Organic Nutrients Market Size (In Billion)
The competitive landscape features prominent players like Advanced Nutrients, HydroGarden, and Botanicare Hydroponics, among others, actively innovating and expanding their product portfolios to meet evolving market demands. Emerging trends include the development of advanced organic nutrient formulations, such as microbial inoculants and nutrient-rich compost teas, which enhance soil health and plant vitality. Restraints, however, might include the perceived higher cost of organic nutrients compared to conventional alternatives, and the time lag for organic methods to show results in certain agricultural settings. Despite these challenges, the overarching shift towards sustainable living and healthier food choices strongly underpins the sustained growth and market penetration of organic nutrients globally, with Asia Pacific and North America expected to lead in terms of market share due to strong consumer adoption and advanced agricultural infrastructure.
Organic Nutrients Company Market Share
Organic Nutrients Market Concentration & Innovation
The global organic nutrients market is characterized by a moderate to high level of concentration, with key players like Advanced Nutrients, CANNA, and FoxFarm holding significant market share. The market has witnessed substantial innovation, driven by increasing consumer demand for sustainable and eco-friendly agricultural practices. Regulatory frameworks are evolving, with a growing emphasis on organic certification and reduced reliance on synthetic inputs. Product substitutes, while present in the form of conventional fertilizers, are increasingly being challenged by the superior environmental and health benefits offered by organic nutrients. End-user trends are heavily influenced by the burgeoning indoor and hydroponic gardening segments, as well as a growing awareness of soil health in outdoor agriculture. Mergers and acquisition (M&A) activities, while not currently at a billion-dollar scale, are present as companies seek to expand their product portfolios and geographical reach. Estimated M&A deal value is in the range of tens to hundreds of millions. The market is dynamic, with new entrants and established companies continually innovating to meet the evolving needs of growers.
Organic Nutrients Industry Trends & Insights
The organic nutrients industry is experiencing robust growth, fueled by a confluence of powerful trends. A primary growth driver is the escalating global demand for sustainable agriculture and organic produce, a movement gaining significant traction among environmentally conscious consumers and health-focused individuals. This consumer preference directly translates into increased adoption of organic nutrient solutions by both commercial farmers and home gardeners. Technological disruptions are also playing a pivotal role, with advancements in biostimulants, microbial inoculants, and precision nutrient delivery systems enhancing the efficacy and efficiency of organic nutrient applications. The market penetration of organic nutrients is steadily rising, particularly in developed economies where regulatory support and consumer awareness are high. The forecast period (2025–2033) anticipates a continued upward trajectory, with a projected Compound Annual Growth Rate (CAGR) of approximately 8-12%, reaching a market size potentially in the tens of billions by 2033. The historical period (2019–2024) laid a strong foundation for this growth, marked by increasing adoption in niche markets and a gradual shift away from synthetic alternatives. Competitive dynamics are evolving, with a focus shifting towards product differentiation, ingredient transparency, and evidence-based efficacy. Companies are investing heavily in research and development to create novel formulations that address specific crop needs and environmental conditions. The shift towards online sales channels is also creating new avenues for market penetration and direct consumer engagement. The ongoing focus on soil health and regenerative agriculture practices further solidifies the long-term prospects for the organic nutrients sector.
Dominant Markets & Segments in Organic Nutrients
The organic nutrients market exhibits distinct regional and segment dominance, driven by a combination of economic policies, consumer awareness, and infrastructural development.
Application: Online vs. Offline
- Online Application: The online segment for organic nutrients is experiencing exponential growth, projected to reach a market size in the billions by 2033. Key drivers include the convenience of direct-to-consumer sales, the ability to reach a wider customer base, and the increasing sophistication of e-commerce platforms specializing in gardening and agricultural supplies. Online retailers and direct brand websites are facilitating access to a vast array of products, from small-scale home gardening kits to bulk orders for commercial operations. The ease of access to product information, customer reviews, and educational content further bolsters online sales.
- Offline Application: While online channels are surging, the offline segment, encompassing traditional garden centers, agricultural co-operatives, and specialty hydroponic stores, continues to hold a significant market share, estimated in the billions. This dominance is fueled by the desire for in-person advice from knowledgeable staff, the ability to physically inspect products, and the immediate availability of goods. Offline channels are particularly crucial for larger commercial operations that require bulk deliveries and personalized consultation. Economic policies supporting local businesses and agricultural infrastructure development indirectly benefit the offline segment.
Types: Indoor Plants vs. Outdoor Plants
- Indoor Plants: The indoor plant segment is a substantial and rapidly growing contributor to the organic nutrients market, projected to reach market sizes in the billions. This growth is propelled by the burgeoning popularity of urban gardening, the rise of the plant parent culture, and the increasing adoption of hydroponic and aeroponic systems for controlled environment agriculture. Consumers are actively seeking specialized organic nutrient formulations designed for specific indoor plant species and growth stages. The desire for aesthetically pleasing and healthy indoor greenery directly fuels demand.
- Outdoor Plants: The outdoor plant segment, encompassing traditional agriculture and home gardening, remains a cornerstone of the organic nutrients market, with market sizes estimated in the billions. Driven by a global imperative for sustainable food production and a renewed appreciation for soil health, the demand for organic fertilizers and soil amendments for outdoor cultivation is consistently strong. Economic policies promoting organic farming certifications, coupled with robust agricultural infrastructure, support the widespread adoption of organic nutrients in this segment. Consumer preferences for organic produce and a growing awareness of the environmental impact of conventional farming further bolster this segment.
Organic Nutrients Product Developments
Product development in the organic nutrients market is heavily focused on enhancing nutrient bioavailability, improving soil health, and promoting sustainable growing practices. Innovations include advanced liquid organic fertilizers derived from natural sources like fish emulsion and kelp, offering immediate nutrient uptake. The development of slow-release organic granular formulations ensures sustained nutrient availability for plants. Furthermore, there is a significant trend towards bio-stimulants and microbial inoculants, which enhance plant growth, improve stress tolerance, and boost nutrient absorption through symbiotic relationships with soil microbes. These developments offer a competitive advantage by providing growers with more effective, environmentally friendly, and yield-enhancing solutions that align with market demands for organic and sustainable produce.
Report Scope & Segmentation Analysis
This report provides a comprehensive analysis of the global organic nutrients market, segmented by application and product type. The Application segmentation includes Online sales channels, characterized by rapid growth driven by e-commerce penetration, and Offline sales channels, representing traditional retail and distribution networks. The Types segmentation distinguishes between formulations for Indoor Plants, catering to the growing indoor gardening and controlled environment agriculture sectors, and formulations for Outdoor Plants, serving the broader agricultural and home gardening markets. Each segment is analyzed for its current market size, projected growth rates, and competitive dynamics throughout the forecast period (2025–2033).
Key Drivers of Organic Nutrients Growth
Several interconnected factors are driving the growth of the organic nutrients market. Firstly, increasing consumer demand for organic and sustainably produced food is a paramount driver, compelling agricultural practices to shift towards organic inputs. Secondly, growing environmental awareness and concerns about the long-term impact of synthetic fertilizers on soil health and ecosystems are pushing growers towards organic alternatives. Thirdly, supportive government policies and regulatory frameworks promoting organic agriculture, including subsidies and certification programs, are significantly boosting market adoption. Technological advancements in organic nutrient formulations, such as enhanced bioavailability and the development of effective bio-stimulants, are also contributing to improved crop yields and plant health, making organic options more attractive.
Challenges in the Organic Nutrients Sector
Despite the positive growth trajectory, the organic nutrients sector faces several challenges. Regulatory hurdles can sometimes be complex and vary significantly across regions, impacting market entry and product standardization. Supply chain issues, including the sourcing of consistent and high-quality organic raw materials, can lead to price volatility and availability concerns. Furthermore, the higher initial cost of some organic nutrient products compared to synthetic alternatives can be a barrier for price-sensitive growers. Competitive pressures from established synthetic fertilizer manufacturers and the need for extensive consumer education on the benefits and application of organic nutrients also present ongoing challenges.
Emerging Opportunities in Organic Nutrients
The organic nutrients market is ripe with emerging opportunities. The expanding global market for controlled environment agriculture, including vertical farms and hydroponic systems, presents a significant demand for specialized organic nutrient solutions. The growing interest in regenerative agriculture practices, which focus on improving soil health and biodiversity, opens avenues for innovative organic soil amendments and microbial products. Furthermore, the increasing demand for organic inputs in developing economies, driven by rising disposable incomes and growing health consciousness, offers substantial untapped market potential. The development of smart nutrient delivery systems that optimize organic nutrient application based on real-time plant needs represents another promising area for innovation.
Leading Players in the Organic Nutrients Market
- Advanced Nutrients
- HydroGarden
- Botanicare Hydroponics
- Atami BV
- CANNA
- Emerald Harvest
- FoxFarm
- Grow Technology
- Plant Magic Plus
- Masterblend
- AeroGarden
Key Developments in Organic Nutrients Industry
- 2023/01: Advanced Nutrients launched a new line of organic microbial inoculants, enhancing soil biology and nutrient uptake for a wide range of crops.
- 2022/06: CANNA introduced a reformulated organic fertilizer specifically designed for hydroponic systems, improving nutrient solubility and plant response.
- 2021/11: FoxFarm expanded its product offerings with a new series of OMRI-listed liquid organic nutrients, catering to the increasing demand for certified organic inputs.
- 2020/04: Atami BV announced a strategic partnership with a European organic farming cooperative to promote the adoption of their organic nutrient solutions.
- 2019/09: Emerald Harvest unveiled an innovative organic compost tea brewer, enabling growers to easily produce nutrient-rich compost tea on-site.
Strategic Outlook for Organic Nutrients Market
The strategic outlook for the organic nutrients market remains exceptionally positive, driven by overarching trends towards sustainability and health. Future growth will likely be fueled by continued innovation in product formulation, with a focus on enhancing efficacy and simplifying application for a wider range of users. The expansion of online sales channels will democratize access to organic nutrients, while a growing emphasis on soil health and regenerative agriculture will open new market segments. Strategic partnerships, mergers, and acquisitions are expected to consolidate market share and drive geographical expansion. Overall, the market is poised for sustained growth as global consciousness shifts towards more environmentally responsible and healthier agricultural practices.
Organic Nutrients Segmentation
-
1. Application
- 1.1. Online
- 1.2. Offline
-
2. Types
- 2.1. Indoor Plants
- 2.2. Outdoor Plants
Organic Nutrients Segmentation By Geography
-
1. North America
- 1.1. United States
- 1.2. Canada
- 1.3. Mexico
-
2. South America
- 2.1. Brazil
- 2.2. Argentina
- 2.3. Rest of South America
-
3. Europe
- 3.1. United Kingdom
- 3.2. Germany
- 3.3. France
- 3.4. Italy
- 3.5. Spain
- 3.6. Russia
- 3.7. Benelux
- 3.8. Nordics
- 3.9. Rest of Europe
-
4. Middle East & Africa
- 4.1. Turkey
- 4.2. Israel
- 4.3. GCC
- 4.4. North Africa
- 4.5. South Africa
- 4.6. Rest of Middle East & Africa
-
5. Asia Pacific
- 5.1. China
- 5.2. India
- 5.3. Japan
- 5.4. South Korea
- 5.5. ASEAN
- 5.6. Oceania
- 5.7. Rest of Asia Pacific
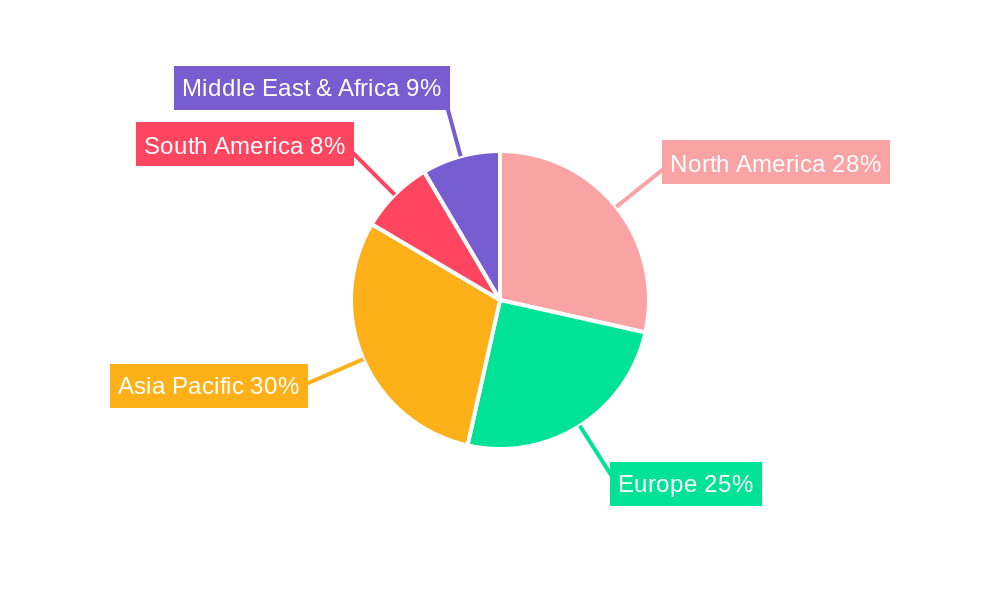
Organic Nutrients Regional Market Share
Geographic Coverage of Organic Nutrients
Organic Nutrients REPORT HIGHLIGHTS
| Aspects | Details |
|---|---|
| Study Period | 2020-2034 |
| Base Year | 2025 |
| Estimated Year | 2026 |
| Forecast Period | 2026-2034 |
| Historical Period | 2020-2025 |
| Growth Rate | CAGR of 8.2% from 2020-2034 |
| Segmentation |
|
Table of Contents
- 1. Introduction
- 1.1. Research Scope
- 1.2. Market Segmentation
- 1.3. Research Objective
- 1.4. Definitions and Assumptions
- 2. Executive Summary
- 2.1. Market Snapshot
- 3. Market Dynamics
- 3.1. Market Drivers
- 3.2. Market Restrains
- 3.3. Market Trends
- 3.4. Market Opportunities
- 4. Market Factor Analysis
- 4.1. Porters Five Forces
- 4.1.1. Bargaining Power of Suppliers
- 4.1.2. Bargaining Power of Buyers
- 4.1.3. Threat of New Entrants
- 4.1.4. Threat of Substitutes
- 4.1.5. Competitive Rivalry
- 4.2. PESTEL analysis
- 4.3. BCG Analysis
- 4.3.1. Stars (High Growth, High Market Share)
- 4.3.2. Cash Cows (Low Growth, High Market Share)
- 4.3.3. Question Mark (High Growth, Low Market Share)
- 4.3.4. Dogs (Low Growth, Low Market Share)
- 4.4. Ansoff Matrix Analysis
- 4.5. Supply Chain Analysis
- 4.6. Regulatory Landscape
- 4.7. Current Market Potential and Opportunity Assessment (TAM–SAM–SOM Framework)
- 4.8. RAX Analyst Note
- 4.1. Porters Five Forces
- 5. Market Analysis, Insights and Forecast 2021-2033
- 5.1. Market Analysis, Insights and Forecast - by Application
- 5.1.1. Online
- 5.1.2. Offline
- 5.2. Market Analysis, Insights and Forecast - by Types
- 5.2.1. Indoor Plants
- 5.2.2. Outdoor Plants
- 5.3. Market Analysis, Insights and Forecast - by Region
- 5.3.1. North America
- 5.3.2. South America
- 5.3.3. Europe
- 5.3.4. Middle East & Africa
- 5.3.5. Asia Pacific
- 5.1. Market Analysis, Insights and Forecast - by Application
- 6. Global Organic Nutrients Analysis, Insights and Forecast, 2021-2033
- 6.1. Market Analysis, Insights and Forecast - by Application
- 6.1.1. Online
- 6.1.2. Offline
- 6.2. Market Analysis, Insights and Forecast - by Types
- 6.2.1. Indoor Plants
- 6.2.2. Outdoor Plants
- 6.1. Market Analysis, Insights and Forecast - by Application
- 7. North America Organic Nutrients Analysis, Insights and Forecast, 2020-2032
- 7.1. Market Analysis, Insights and Forecast - by Application
- 7.1.1. Online
- 7.1.2. Offline
- 7.2. Market Analysis, Insights and Forecast - by Types
- 7.2.1. Indoor Plants
- 7.2.2. Outdoor Plants
- 7.1. Market Analysis, Insights and Forecast - by Application
- 8. South America Organic Nutrients Analysis, Insights and Forecast, 2020-2032
- 8.1. Market Analysis, Insights and Forecast - by Application
- 8.1.1. Online
- 8.1.2. Offline
- 8.2. Market Analysis, Insights and Forecast - by Types
- 8.2.1. Indoor Plants
- 8.2.2. Outdoor Plants
- 8.1. Market Analysis, Insights and Forecast - by Application
- 9. Europe Organic Nutrients Analysis, Insights and Forecast, 2020-2032
- 9.1. Market Analysis, Insights and Forecast - by Application
- 9.1.1. Online
- 9.1.2. Offline
- 9.2. Market Analysis, Insights and Forecast - by Types
- 9.2.1. Indoor Plants
- 9.2.2. Outdoor Plants
- 9.1. Market Analysis, Insights and Forecast - by Application
- 10. Middle East & Africa Organic Nutrients Analysis, Insights and Forecast, 2020-2032
- 10.1. Market Analysis, Insights and Forecast - by Application
- 10.1.1. Online
- 10.1.2. Offline
- 10.2. Market Analysis, Insights and Forecast - by Types
- 10.2.1. Indoor Plants
- 10.2.2. Outdoor Plants
- 10.1. Market Analysis, Insights and Forecast - by Application
- 11. Asia Pacific Organic Nutrients Analysis, Insights and Forecast, 2020-2032
- 11.1. Market Analysis, Insights and Forecast - by Application
- 11.1.1. Online
- 11.1.2. Offline
- 11.2. Market Analysis, Insights and Forecast - by Types
- 11.2.1. Indoor Plants
- 11.2.2. Outdoor Plants
- 11.1. Market Analysis, Insights and Forecast - by Application
- 12. Competitive Analysis
- 12.1. Company Profiles
- 12.1.1 Advanced Nutrients
- 12.1.1.1. Company Overview
- 12.1.1.2. Products
- 12.1.1.3. Company Financials
- 12.1.1.4. SWOT Analysis
- 12.1.2 HydroGarden
- 12.1.2.1. Company Overview
- 12.1.2.2. Products
- 12.1.2.3. Company Financials
- 12.1.2.4. SWOT Analysis
- 12.1.3 Botanicare Hydroponics
- 12.1.3.1. Company Overview
- 12.1.3.2. Products
- 12.1.3.3. Company Financials
- 12.1.3.4. SWOT Analysis
- 12.1.4 Atami BV
- 12.1.4.1. Company Overview
- 12.1.4.2. Products
- 12.1.4.3. Company Financials
- 12.1.4.4. SWOT Analysis
- 12.1.5 CANNA
- 12.1.5.1. Company Overview
- 12.1.5.2. Products
- 12.1.5.3. Company Financials
- 12.1.5.4. SWOT Analysis
- 12.1.6 Emerald Harvest
- 12.1.6.1. Company Overview
- 12.1.6.2. Products
- 12.1.6.3. Company Financials
- 12.1.6.4. SWOT Analysis
- 12.1.7 FoxFarm
- 12.1.7.1. Company Overview
- 12.1.7.2. Products
- 12.1.7.3. Company Financials
- 12.1.7.4. SWOT Analysis
- 12.1.8 Grow Technology
- 12.1.8.1. Company Overview
- 12.1.8.2. Products
- 12.1.8.3. Company Financials
- 12.1.8.4. SWOT Analysis
- 12.1.9 Plant Magic Plus
- 12.1.9.1. Company Overview
- 12.1.9.2. Products
- 12.1.9.3. Company Financials
- 12.1.9.4. SWOT Analysis
- 12.1.10 Masterblend
- 12.1.10.1. Company Overview
- 12.1.10.2. Products
- 12.1.10.3. Company Financials
- 12.1.10.4. SWOT Analysis
- 12.1.11 AeroGarden
- 12.1.11.1. Company Overview
- 12.1.11.2. Products
- 12.1.11.3. Company Financials
- 12.1.11.4. SWOT Analysis
- 12.1.1 Advanced Nutrients
- 12.2. Market Entropy
- 12.2.1 Company's Key Areas Served
- 12.2.2 Recent Developments
- 12.3. Company Market Share Analysis 2025
- 12.3.1 Top 5 Companies Market Share Analysis
- 12.3.2 Top 3 Companies Market Share Analysis
- 12.4. List of Potential Customers
- 13. Research Methodology
List of Figures
- Figure 1: Global Organic Nutrients Revenue Breakdown (undefined, %) by Region 2025 & 2033
- Figure 2: Global Organic Nutrients Volume Breakdown (K, %) by Region 2025 & 2033
- Figure 3: North America Organic Nutrients Revenue (undefined), by Application 2025 & 2033
- Figure 4: North America Organic Nutrients Volume (K), by Application 2025 & 2033
- Figure 5: North America Organic Nutrients Revenue Share (%), by Application 2025 & 2033
- Figure 6: North America Organic Nutrients Volume Share (%), by Application 2025 & 2033
- Figure 7: North America Organic Nutrients Revenue (undefined), by Types 2025 & 2033
- Figure 8: North America Organic Nutrients Volume (K), by Types 2025 & 2033
- Figure 9: North America Organic Nutrients Revenue Share (%), by Types 2025 & 2033
- Figure 10: North America Organic Nutrients Volume Share (%), by Types 2025 & 2033
- Figure 11: North America Organic Nutrients Revenue (undefined), by Country 2025 & 2033
- Figure 12: North America Organic Nutrients Volume (K), by Country 2025 & 2033
- Figure 13: North America Organic Nutrients Revenue Share (%), by Country 2025 & 2033
- Figure 14: North America Organic Nutrients Volume Share (%), by Country 2025 & 2033
- Figure 15: South America Organic Nutrients Revenue (undefined), by Application 2025 & 2033
- Figure 16: South America Organic Nutrients Volume (K), by Application 2025 & 2033
- Figure 17: South America Organic Nutrients Revenue Share (%), by Application 2025 & 2033
- Figure 18: South America Organic Nutrients Volume Share (%), by Application 2025 & 2033
- Figure 19: South America Organic Nutrients Revenue (undefined), by Types 2025 & 2033
- Figure 20: South America Organic Nutrients Volume (K), by Types 2025 & 2033
- Figure 21: South America Organic Nutrients Revenue Share (%), by Types 2025 & 2033
- Figure 22: South America Organic Nutrients Volume Share (%), by Types 2025 & 2033
- Figure 23: South America Organic Nutrients Revenue (undefined), by Country 2025 & 2033
- Figure 24: South America Organic Nutrients Volume (K), by Country 2025 & 2033
- Figure 25: South America Organic Nutrients Revenue Share (%), by Country 2025 & 2033
- Figure 26: South America Organic Nutrients Volume Share (%), by Country 2025 & 2033
- Figure 27: Europe Organic Nutrients Revenue (undefined), by Application 2025 & 2033
- Figure 28: Europe Organic Nutrients Volume (K), by Application 2025 & 2033
- Figure 29: Europe Organic Nutrients Revenue Share (%), by Application 2025 & 2033
- Figure 30: Europe Organic Nutrients Volume Share (%), by Application 2025 & 2033
- Figure 31: Europe Organic Nutrients Revenue (undefined), by Types 2025 & 2033
- Figure 32: Europe Organic Nutrients Volume (K), by Types 2025 & 2033
- Figure 33: Europe Organic Nutrients Revenue Share (%), by Types 2025 & 2033
- Figure 34: Europe Organic Nutrients Volume Share (%), by Types 2025 & 2033
- Figure 35: Europe Organic Nutrients Revenue (undefined), by Country 2025 & 2033
- Figure 36: Europe Organic Nutrients Volume (K), by Country 2025 & 2033
- Figure 37: Europe Organic Nutrients Revenue Share (%), by Country 2025 & 2033
- Figure 38: Europe Organic Nutrients Volume Share (%), by Country 2025 & 2033
- Figure 39: Middle East & Africa Organic Nutrients Revenue (undefined), by Application 2025 & 2033
- Figure 40: Middle East & Africa Organic Nutrients Volume (K), by Application 2025 & 2033
- Figure 41: Middle East & Africa Organic Nutrients Revenue Share (%), by Application 2025 & 2033
- Figure 42: Middle East & Africa Organic Nutrients Volume Share (%), by Application 2025 & 2033
- Figure 43: Middle East & Africa Organic Nutrients Revenue (undefined), by Types 2025 & 2033
- Figure 44: Middle East & Africa Organic Nutrients Volume (K), by Types 2025 & 2033
- Figure 45: Middle East & Africa Organic Nutrients Revenue Share (%), by Types 2025 & 2033
- Figure 46: Middle East & Africa Organic Nutrients Volume Share (%), by Types 2025 & 2033
- Figure 47: Middle East & Africa Organic Nutrients Revenue (undefined), by Country 2025 & 2033
- Figure 48: Middle East & Africa Organic Nutrients Volume (K), by Country 2025 & 2033
- Figure 49: Middle East & Africa Organic Nutrients Revenue Share (%), by Country 2025 & 2033
- Figure 50: Middle East & Africa Organic Nutrients Volume Share (%), by Country 2025 & 2033
- Figure 51: Asia Pacific Organic Nutrients Revenue (undefined), by Application 2025 & 2033
- Figure 52: Asia Pacific Organic Nutrients Volume (K), by Application 2025 & 2033
- Figure 53: Asia Pacific Organic Nutrients Revenue Share (%), by Application 2025 & 2033
- Figure 54: Asia Pacific Organic Nutrients Volume Share (%), by Application 2025 & 2033
- Figure 55: Asia Pacific Organic Nutrients Revenue (undefined), by Types 2025 & 2033
- Figure 56: Asia Pacific Organic Nutrients Volume (K), by Types 2025 & 2033
- Figure 57: Asia Pacific Organic Nutrients Revenue Share (%), by Types 2025 & 2033
- Figure 58: Asia Pacific Organic Nutrients Volume Share (%), by Types 2025 & 2033
- Figure 59: Asia Pacific Organic Nutrients Revenue (undefined), by Country 2025 & 2033
- Figure 60: Asia Pacific Organic Nutrients Volume (K), by Country 2025 & 2033
- Figure 61: Asia Pacific Organic Nutrients Revenue Share (%), by Country 2025 & 2033
- Figure 62: Asia Pacific Organic Nutrients Volume Share (%), by Country 2025 & 2033
List of Tables
- Table 1: Global Organic Nutrients Revenue undefined Forecast, by Application 2020 & 2033
- Table 2: Global Organic Nutrients Volume K Forecast, by Application 2020 & 2033
- Table 3: Global Organic Nutrients Revenue undefined Forecast, by Types 2020 & 2033
- Table 4: Global Organic Nutrients Volume K Forecast, by Types 2020 & 2033
- Table 5: Global Organic Nutrients Revenue undefined Forecast, by Region 2020 & 2033
- Table 6: Global Organic Nutrients Volume K Forecast, by Region 2020 & 2033
- Table 7: Global Organic Nutrients Revenue undefined Forecast, by Application 2020 & 2033
- Table 8: Global Organic Nutrients Volume K Forecast, by Application 2020 & 2033
- Table 9: Global Organic Nutrients Revenue undefined Forecast, by Types 2020 & 2033
- Table 10: Global Organic Nutrients Volume K Forecast, by Types 2020 & 2033
- Table 11: Global Organic Nutrients Revenue undefined Forecast, by Country 2020 & 2033
- Table 12: Global Organic Nutrients Volume K Forecast, by Country 2020 & 2033
- Table 13: United States Organic Nutrients Revenue (undefined) Forecast, by Application 2020 & 2033
- Table 14: United States Organic Nutrients Volume (K) Forecast, by Application 2020 & 2033
- Table 15: Canada Organic Nutrients Revenue (undefined) Forecast, by Application 2020 & 2033
- Table 16: Canada Organic Nutrients Volume (K) Forecast, by Application 2020 & 2033
- Table 17: Mexico Organic Nutrients Revenue (undefined) Forecast, by Application 2020 & 2033
- Table 18: Mexico Organic Nutrients Volume (K) Forecast, by Application 2020 & 2033
- Table 19: Global Organic Nutrients Revenue undefined Forecast, by Application 2020 & 2033
- Table 20: Global Organic Nutrients Volume K Forecast, by Application 2020 & 2033
- Table 21: Global Organic Nutrients Revenue undefined Forecast, by Types 2020 & 2033
- Table 22: Global Organic Nutrients Volume K Forecast, by Types 2020 & 2033
- Table 23: Global Organic Nutrients Revenue undefined Forecast, by Country 2020 & 2033
- Table 24: Global Organic Nutrients Volume K Forecast, by Country 2020 & 2033
- Table 25: Brazil Organic Nutrients Revenue (undefined) Forecast, by Application 2020 & 2033
- Table 26: Brazil Organic Nutrients Volume (K) Forecast, by Application 2020 & 2033
- Table 27: Argentina Organic Nutrients Revenue (undefined) Forecast, by Application 2020 & 2033
- Table 28: Argentina Organic Nutrients Volume (K) Forecast, by Application 2020 & 2033
- Table 29: Rest of South America Organic Nutrients Revenue (undefined) Forecast, by Application 2020 & 2033
- Table 30: Rest of South America Organic Nutrients Volume (K) Forecast, by Application 2020 & 2033
- Table 31: Global Organic Nutrients Revenue undefined Forecast, by Application 2020 & 2033
- Table 32: Global Organic Nutrients Volume K Forecast, by Application 2020 & 2033
- Table 33: Global Organic Nutrients Revenue undefined Forecast, by Types 2020 & 2033
- Table 34: Global Organic Nutrients Volume K Forecast, by Types 2020 & 2033
- Table 35: Global Organic Nutrients Revenue undefined Forecast, by Country 2020 & 2033
- Table 36: Global Organic Nutrients Volume K Forecast, by Country 2020 & 2033
- Table 37: United Kingdom Organic Nutrients Revenue (undefined) Forecast, by Application 2020 & 2033
- Table 38: United Kingdom Organic Nutrients Volume (K) Forecast, by Application 2020 & 2033
- Table 39: Germany Organic Nutrients Revenue (undefined) Forecast, by Application 2020 & 2033
- Table 40: Germany Organic Nutrients Volume (K) Forecast, by Application 2020 & 2033
- Table 41: France Organic Nutrients Revenue (undefined) Forecast, by Application 2020 & 2033
- Table 42: France Organic Nutrients Volume (K) Forecast, by Application 2020 & 2033
- Table 43: Italy Organic Nutrients Revenue (undefined) Forecast, by Application 2020 & 2033
- Table 44: Italy Organic Nutrients Volume (K) Forecast, by Application 2020 & 2033
- Table 45: Spain Organic Nutrients Revenue (undefined) Forecast, by Application 2020 & 2033
- Table 46: Spain Organic Nutrients Volume (K) Forecast, by Application 2020 & 2033
- Table 47: Russia Organic Nutrients Revenue (undefined) Forecast, by Application 2020 & 2033
- Table 48: Russia Organic Nutrients Volume (K) Forecast, by Application 2020 & 2033
- Table 49: Benelux Organic Nutrients Revenue (undefined) Forecast, by Application 2020 & 2033
- Table 50: Benelux Organic Nutrients Volume (K) Forecast, by Application 2020 & 2033
- Table 51: Nordics Organic Nutrients Revenue (undefined) Forecast, by Application 2020 & 2033
- Table 52: Nordics Organic Nutrients Volume (K) Forecast, by Application 2020 & 2033
- Table 53: Rest of Europe Organic Nutrients Revenue (undefined) Forecast, by Application 2020 & 2033
- Table 54: Rest of Europe Organic Nutrients Volume (K) Forecast, by Application 2020 & 2033
- Table 55: Global Organic Nutrients Revenue undefined Forecast, by Application 2020 & 2033
- Table 56: Global Organic Nutrients Volume K Forecast, by Application 2020 & 2033
- Table 57: Global Organic Nutrients Revenue undefined Forecast, by Types 2020 & 2033
- Table 58: Global Organic Nutrients Volume K Forecast, by Types 2020 & 2033
- Table 59: Global Organic Nutrients Revenue undefined Forecast, by Country 2020 & 2033
- Table 60: Global Organic Nutrients Volume K Forecast, by Country 2020 & 2033
- Table 61: Turkey Organic Nutrients Revenue (undefined) Forecast, by Application 2020 & 2033
- Table 62: Turkey Organic Nutrients Volume (K) Forecast, by Application 2020 & 2033
- Table 63: Israel Organic Nutrients Revenue (undefined) Forecast, by Application 2020 & 2033
- Table 64: Israel Organic Nutrients Volume (K) Forecast, by Application 2020 & 2033
- Table 65: GCC Organic Nutrients Revenue (undefined) Forecast, by Application 2020 & 2033
- Table 66: GCC Organic Nutrients Volume (K) Forecast, by Application 2020 & 2033
- Table 67: North Africa Organic Nutrients Revenue (undefined) Forecast, by Application 2020 & 2033
- Table 68: North Africa Organic Nutrients Volume (K) Forecast, by Application 2020 & 2033
- Table 69: South Africa Organic Nutrients Revenue (undefined) Forecast, by Application 2020 & 2033
- Table 70: South Africa Organic Nutrients Volume (K) Forecast, by Application 2020 & 2033
- Table 71: Rest of Middle East & Africa Organic Nutrients Revenue (undefined) Forecast, by Application 2020 & 2033
- Table 72: Rest of Middle East & Africa Organic Nutrients Volume (K) Forecast, by Application 2020 & 2033
- Table 73: Global Organic Nutrients Revenue undefined Forecast, by Application 2020 & 2033
- Table 74: Global Organic Nutrients Volume K Forecast, by Application 2020 & 2033
- Table 75: Global Organic Nutrients Revenue undefined Forecast, by Types 2020 & 2033
- Table 76: Global Organic Nutrients Volume K Forecast, by Types 2020 & 2033
- Table 77: Global Organic Nutrients Revenue undefined Forecast, by Country 2020 & 2033
- Table 78: Global Organic Nutrients Volume K Forecast, by Country 2020 & 2033
- Table 79: China Organic Nutrients Revenue (undefined) Forecast, by Application 2020 & 2033
- Table 80: China Organic Nutrients Volume (K) Forecast, by Application 2020 & 2033
- Table 81: India Organic Nutrients Revenue (undefined) Forecast, by Application 2020 & 2033
- Table 82: India Organic Nutrients Volume (K) Forecast, by Application 2020 & 2033
- Table 83: Japan Organic Nutrients Revenue (undefined) Forecast, by Application 2020 & 2033
- Table 84: Japan Organic Nutrients Volume (K) Forecast, by Application 2020 & 2033
- Table 85: South Korea Organic Nutrients Revenue (undefined) Forecast, by Application 2020 & 2033
- Table 86: South Korea Organic Nutrients Volume (K) Forecast, by Application 2020 & 2033
- Table 87: ASEAN Organic Nutrients Revenue (undefined) Forecast, by Application 2020 & 2033
- Table 88: ASEAN Organic Nutrients Volume (K) Forecast, by Application 2020 & 2033
- Table 89: Oceania Organic Nutrients Revenue (undefined) Forecast, by Application 2020 & 2033
- Table 90: Oceania Organic Nutrients Volume (K) Forecast, by Application 2020 & 2033
- Table 91: Rest of Asia Pacific Organic Nutrients Revenue (undefined) Forecast, by Application 2020 & 2033
- Table 92: Rest of Asia Pacific Organic Nutrients Volume (K) Forecast, by Application 2020 & 2033
Frequently Asked Questions
1. What is the projected Compound Annual Growth Rate (CAGR) of the Organic Nutrients?
The projected CAGR is approximately 8.2%.
2. Which companies are prominent players in the Organic Nutrients?
Key companies in the market include Advanced Nutrients, HydroGarden, Botanicare Hydroponics, Atami BV, CANNA, Emerald Harvest, FoxFarm, Grow Technology, Plant Magic Plus, Masterblend, AeroGarden.
3. What are the main segments of the Organic Nutrients?
The market segments include Application, Types.
4. Can you provide details about the market size?
The market size is estimated to be USD XXX N/A as of 2022.
5. What are some drivers contributing to market growth?
N/A
6. What are the notable trends driving market growth?
N/A
7. Are there any restraints impacting market growth?
N/A
8. Can you provide examples of recent developments in the market?
N/A
9. What pricing options are available for accessing the report?
Pricing options include single-user, multi-user, and enterprise licenses priced at USD 3350.00, USD 5025.00, and USD 6700.00 respectively.
10. Is the market size provided in terms of value or volume?
The market size is provided in terms of value, measured in N/A and volume, measured in K.
11. Are there any specific market keywords associated with the report?
Yes, the market keyword associated with the report is "Organic Nutrients," which aids in identifying and referencing the specific market segment covered.
12. How do I determine which pricing option suits my needs best?
The pricing options vary based on user requirements and access needs. Individual users may opt for single-user licenses, while businesses requiring broader access may choose multi-user or enterprise licenses for cost-effective access to the report.
13. Are there any additional resources or data provided in the Organic Nutrients report?
While the report offers comprehensive insights, it's advisable to review the specific contents or supplementary materials provided to ascertain if additional resources or data are available.
14. How can I stay updated on further developments or reports in the Organic Nutrients?
To stay informed about further developments, trends, and reports in the Organic Nutrients, consider subscribing to industry newsletters, following relevant companies and organizations, or regularly checking reputable industry news sources and publications.
Methodology
Step 1 - Identification of Relevant Samples Size from Population Database


Step 2 - Approaches for Defining Global Market Size (Value, Volume* & Price*)

Note*: In applicable scenarios
Step 3 - Data Sources
Primary Research
- Web Analytics
- Survey Reports
- Research Institute
- Latest Research Reports
- Opinion Leaders
Secondary Research
- Annual Reports
- White Paper
- Latest Press Release
- Industry Association
- Paid Database
- Investor Presentations

Step 4 - Data Triangulation
Involves using different sources of information in order to increase the validity of a study
These sources are likely to be stakeholders in a program - participants, other researchers, program staff, other community members, and so on.
Then we put all data in single framework & apply various statistical tools to find out the dynamic on the market.
During the analysis stage, feedback from the stakeholder groups would be compared to determine areas of agreement as well as areas of divergence

