


Key Insights
The organic sports nutrition foods and beverages market is experiencing robust growth, driven by the increasing awareness of health and wellness among consumers, coupled with a rising preference for natural and sustainably sourced products. The market's expansion is fueled by several key factors, including the increasing participation in fitness activities and sports, the growing popularity of plant-based diets, and a heightened focus on clean label ingredients. Consumers are actively seeking products that align with their health goals, free from artificial additives, preservatives, and genetically modified organisms (GMOs). This trend is particularly evident among millennials and Gen Z, who are highly influential in shaping consumer demand. Major players like Nestlé, Red Bull, and PepsiCo are strategically investing in this segment, recognizing its significant potential for future growth. While challenges exist, such as the higher cost of organic ingredients compared to conventional ones, this is often offset by the premium pricing consumers are willing to pay for perceived health benefits and superior quality. Further expansion is expected through product diversification, including the introduction of innovative formulations and convenient formats. The market's geographical distribution is likely diverse, with developed regions like North America and Europe leading the demand currently, but emerging markets in Asia-Pacific and Latin America showing promising growth potential.
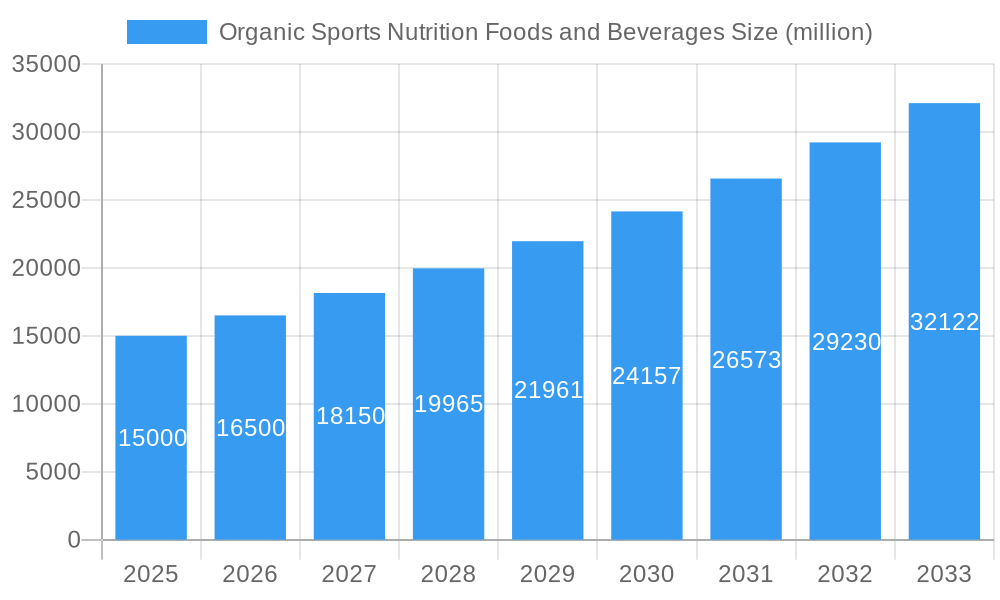
Organic Sports Nutrition Foods and Beverages Market Size (In Billion)

The forecast period (2025-2033) is expected to witness a considerable increase in market value, driven by sustained consumer interest in organic and healthy food and beverage choices. However, challenges remain, including supply chain complexities in sourcing organic ingredients and stringent regulations surrounding organic certification. Successful companies in this space will be those that can effectively manage these challenges while innovating to cater to the ever-evolving consumer preferences. This includes focusing on sustainable sourcing, transparent labeling, and the development of products tailored to specific dietary needs and athletic goals. The competition is fierce, with established players and emerging brands vying for market share. Successful strategies will focus on building strong brands, establishing robust distribution networks, and engaging in effective marketing campaigns that emphasize the unique value proposition of organic sports nutrition products.
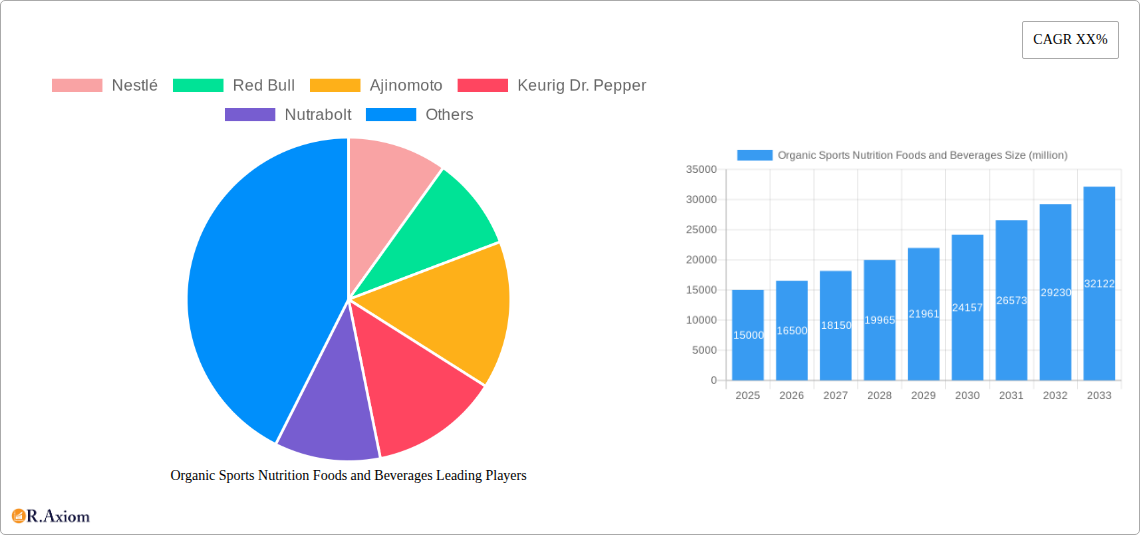
Organic Sports Nutrition Foods and Beverages Company Market Share
Organic Sports Nutrition Foods and Beverages Market Report: 2019-2033
This comprehensive report provides a detailed analysis of the global organic sports nutrition foods and beverages market, covering the historical period (2019-2024), base year (2025), estimated year (2025), and forecast period (2025-2033). Valued at $xx million in 2025, the market is projected to reach $xx million by 2033, exhibiting a CAGR of xx% during the forecast period. This report offers actionable insights for industry stakeholders, including manufacturers, distributors, retailers, and investors.
Organic Sports Nutrition Foods and Beverages Market Concentration & Innovation
The organic sports nutrition market is characterized by a moderately concentrated landscape, with key players like Nestlé, Red Bull, and Coca-Cola holding significant market share. However, smaller, specialized companies like Nutrabolt and Optimum Nutrition are also making significant contributions through innovation and niche market targeting. The combined market share of the top five players in 2025 is estimated at xx%. Mergers and acquisitions (M&A) have played a vital role in market consolidation, with deal values exceeding $xx million in the last five years. Innovation is driven by consumer demand for natural, high-performance products, leading to the development of novel formulations, functional ingredients, and sustainable packaging. Stringent regulatory frameworks regarding organic certification and labeling influence product development and market access. The emergence of plant-based alternatives and personalized nutrition further shapes the competitive landscape. Substitute products, such as conventional sports nutrition products, face increasing competition due to growing consumer awareness of organic benefits.
- Market Share (2025): Nestlé (xx%), Red Bull (xx%), Coca-Cola (xx%), Nutrabolt (xx%), Optimum Nutrition (xx%), Others (xx%)
- M&A Activity (2019-2024): Total deal value exceeding $xx million; average deal size of $xx million. Examples include [insert specific examples if available, otherwise remove this bullet point].
- Key Innovation Drivers: Consumer demand for clean labels, functional benefits, and sustainability.
Organic Sports Nutrition Foods and Beverages Industry Trends & Insights
The organic sports nutrition market is experiencing robust growth, propelled by several key factors. Rising consumer awareness of health and wellness, coupled with an increasing adoption of active lifestyles, fuels demand for nutritious and performance-enhancing products. Technological advancements in food processing and ingredient sourcing contribute to product diversification and improved functionality. Consumer preferences are shifting toward clean label products with natural ingredients, free from artificial additives and preservatives. This trend drives innovation in formulation and ingredient sourcing. The market exhibits intense competitive dynamics, with established players facing challenges from smaller, agile companies that cater to niche segments. The growing adoption of e-commerce and direct-to-consumer strategies is reshaping distribution channels. The market penetration rate for organic sports nutrition products is projected to increase from xx% in 2025 to xx% by 2033, driven by changing consumer preferences and increased product availability.
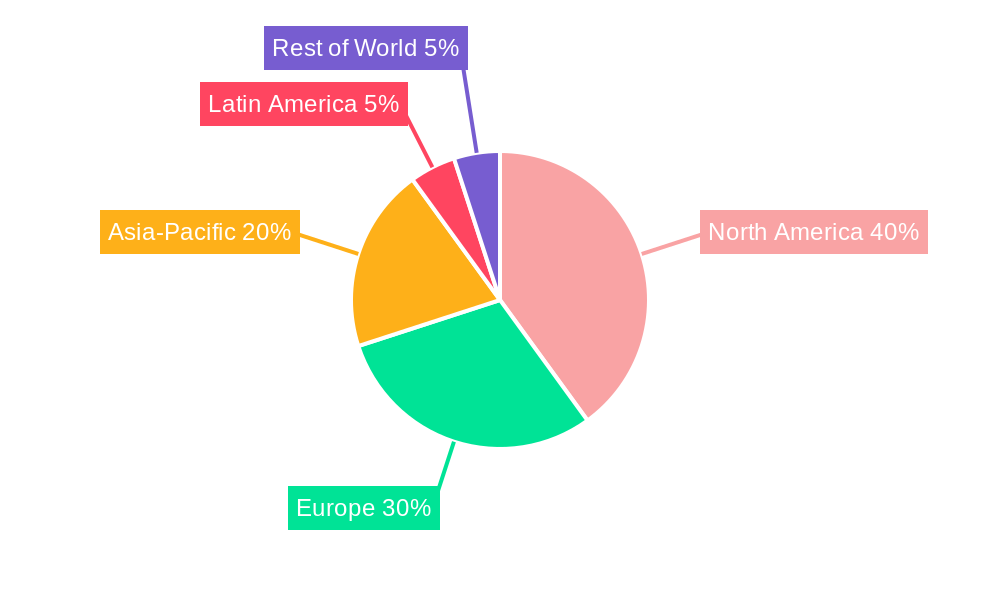
Dominant Markets & Segments in Organic Sports Nutrition Foods and Beverages
North America currently holds the leading position in the organic sports nutrition market, followed by Europe. The dominance of these regions is attributed to high levels of health consciousness, disposable income, and established distribution networks.
North America Dominance Drivers:
- High consumer awareness of health and wellness.
- Strong presence of established players and innovative startups.
- Well-developed retail infrastructure and e-commerce channels.
- Favorable regulatory environment for organic products.
Europe Dominance Drivers:
- Growing consumer interest in organic and natural products.
- Increasing participation in sports and fitness activities.
- Stringent regulatory standards for organic certification.
- Expanding distribution channels.
Within segments, protein powders, energy bars, and organic sports drinks dominate, collectively accounting for over xx% of market value. The increasing demand for plant-based protein sources and functional beverages is also driving significant segment growth.
Organic Sports Nutrition Foods and Beverages Product Developments
Recent product innovations focus on enhancing the functional benefits and taste profiles of organic sports nutrition products. This includes incorporating novel ingredients like adaptogens and superfoods to improve performance and recovery. Technological advances in formulation and processing enable the creation of products with improved texture, shelf-life, and nutritional value. Furthermore, sustainable packaging solutions are gaining traction, aligning with the growing consumer preference for environmentally friendly products.
Report Scope & Segmentation Analysis
This report segments the market based on product type (protein powders, energy bars, sports drinks, etc.), distribution channel (online, offline), and geography (North America, Europe, Asia-Pacific, etc.). Each segment is analyzed with respect to market size, growth rate, and competitive landscape. Growth projections vary across segments, with protein powders and plant-based products expected to outpace other segments in the coming years. Competitive dynamics are influenced by factors such as brand recognition, product innovation, and pricing strategies.
Key Drivers of Organic Sports Nutrition Foods and Beverages Growth
Several factors drive the growth of the organic sports nutrition market. Rising health consciousness and increasing participation in sports and fitness activities are significant drivers. Growing consumer preference for natural and clean label products fuels demand. Technological advancements in food processing, ingredient development, and packaging improve product quality and expand market opportunities. Favorable government policies and regulations supporting organic agriculture and food production also contribute to market expansion.
Challenges in the Organic Sports Nutrition Foods and Beverages Sector
The organic sports nutrition sector faces challenges such as high raw material costs, stringent regulatory compliance requirements, and maintaining consistent supply chain operations. Competition from established players and emerging brands also presents a significant challenge. Fluctuations in raw material prices can impact profitability, while stricter organic certifications increase production costs. Supply chain disruptions can affect product availability and negatively impact revenue streams.
Emerging Opportunities in Organic Sports Nutrition Foods and Beverages
Emerging opportunities lie in tapping into untapped markets, such as developing economies with rising disposable incomes and health-conscious consumers. Development and expansion of plant-based protein products and personalized nutrition solutions cater to growing consumer demand. Innovation in packaging and sustainability strategies can attract environmentally conscious consumers. Further exploring the potential of functional ingredients for improved performance and recovery offers significant growth potential.
Leading Players in the Organic Sports Nutrition Foods and Beverages Market
- Nestlé
- Red Bull
- Ajinomoto
- Keurig Dr Pepper
- Nutrabolt
- GlaxoSmithKline
- Optimum Nutrition
- Premier Nutrition
- Biothrive Sciences
- Coca-Cola
- Pepsi
- Now Foods
- INC Sports Nutrition
- Vitaco Health
- Uelzena Group
- GenTech Holdings
- Abott Nutrition
- GNC Holdings
- Reckitt Benckiser
- Monster Beverage
- Glanbia
- Maxinutrition
Key Developments in Organic Sports Nutrition Foods and Beverages Industry
- [Insert specific key developments with year/month and impact on market dynamics. For example: January 2023 - Nestlé launched a new line of organic protein bars, increasing competition in the protein bar segment.] Replace bracketed information with actual data.
Strategic Outlook for Organic Sports Nutrition Foods and Beverages Market
The organic sports nutrition market is poised for continued growth, driven by favorable consumer trends and technological advancements. The focus on sustainable practices, product diversification, and personalized nutrition solutions will shape future market dynamics. Companies that can effectively leverage innovation, efficient supply chains, and targeted marketing strategies are well-positioned to capitalize on the emerging opportunities in this dynamic sector.
Organic Sports Nutrition Foods and Beverages Segmentation
-
1. Application
- 1.1. Online Sales
- 1.2. Offline Sales
-
2. Types
- 2.1. Ready-To-Drink
- 2.2. Energy & Protein Bar
- 2.3. Powder
- 2.4. Tablets/Capsules
- 2.5. Others
Organic Sports Nutrition Foods and Beverages Segmentation By Geography
-
1. North America
- 1.1. United States
- 1.2. Canada
- 1.3. Mexico
-
2. South America
- 2.1. Brazil
- 2.2. Argentina
- 2.3. Rest of South America
-
3. Europe
- 3.1. United Kingdom
- 3.2. Germany
- 3.3. France
- 3.4. Italy
- 3.5. Spain
- 3.6. Russia
- 3.7. Benelux
- 3.8. Nordics
- 3.9. Rest of Europe
-
4. Middle East & Africa
- 4.1. Turkey
- 4.2. Israel
- 4.3. GCC
- 4.4. North Africa
- 4.5. South Africa
- 4.6. Rest of Middle East & Africa
-
5. Asia Pacific
- 5.1. China
- 5.2. India
- 5.3. Japan
- 5.4. South Korea
- 5.5. ASEAN
- 5.6. Oceania
- 5.7. Rest of Asia Pacific
Organic Sports Nutrition Foods and Beverages Regional Market Share
Geographic Coverage of Organic Sports Nutrition Foods and Beverages
Organic Sports Nutrition Foods and Beverages REPORT HIGHLIGHTS
| Aspects | Details |
|---|---|
| Study Period | 2020-2034 |
| Base Year | 2025 |
| Estimated Year | 2026 |
| Forecast Period | 2026-2034 |
| Historical Period | 2020-2025 |
| Growth Rate | CAGR of 10% from 2020-2034 |
| Segmentation |
|
Table of Contents
- 1. Introduction
- 1.1. Research Scope
- 1.2. Market Segmentation
- 1.3. Research Methodology
- 1.4. Definitions and Assumptions
- 2. Executive Summary
- 2.1. Introduction
- 3. Market Dynamics
- 3.1. Introduction
- 3.2. Market Drivers
- 3.3. Market Restrains
- 3.4. Market Trends
- 4. Market Factor Analysis
- 4.1. Porters Five Forces
- 4.2. Supply/Value Chain
- 4.3. PESTEL analysis
- 4.4. Market Entropy
- 4.5. Patent/Trademark Analysis
- 5. Global Organic Sports Nutrition Foods and Beverages Analysis, Insights and Forecast, 2020-2032
- 5.1. Market Analysis, Insights and Forecast - by Application
- 5.1.1. Online Sales
- 5.1.2. Offline Sales
- 5.2. Market Analysis, Insights and Forecast - by Types
- 5.2.1. Ready-To-Drink
- 5.2.2. Energy & Protein Bar
- 5.2.3. Powder
- 5.2.4. Tablets/Capsules
- 5.2.5. Others
- 5.3. Market Analysis, Insights and Forecast - by Region
- 5.3.1. North America
- 5.3.2. South America
- 5.3.3. Europe
- 5.3.4. Middle East & Africa
- 5.3.5. Asia Pacific
- 5.1. Market Analysis, Insights and Forecast - by Application
- 6. North America Organic Sports Nutrition Foods and Beverages Analysis, Insights and Forecast, 2020-2032
- 6.1. Market Analysis, Insights and Forecast - by Application
- 6.1.1. Online Sales
- 6.1.2. Offline Sales
- 6.2. Market Analysis, Insights and Forecast - by Types
- 6.2.1. Ready-To-Drink
- 6.2.2. Energy & Protein Bar
- 6.2.3. Powder
- 6.2.4. Tablets/Capsules
- 6.2.5. Others
- 6.1. Market Analysis, Insights and Forecast - by Application
- 7. South America Organic Sports Nutrition Foods and Beverages Analysis, Insights and Forecast, 2020-2032
- 7.1. Market Analysis, Insights and Forecast - by Application
- 7.1.1. Online Sales
- 7.1.2. Offline Sales
- 7.2. Market Analysis, Insights and Forecast - by Types
- 7.2.1. Ready-To-Drink
- 7.2.2. Energy & Protein Bar
- 7.2.3. Powder
- 7.2.4. Tablets/Capsules
- 7.2.5. Others
- 7.1. Market Analysis, Insights and Forecast - by Application
- 8. Europe Organic Sports Nutrition Foods and Beverages Analysis, Insights and Forecast, 2020-2032
- 8.1. Market Analysis, Insights and Forecast - by Application
- 8.1.1. Online Sales
- 8.1.2. Offline Sales
- 8.2. Market Analysis, Insights and Forecast - by Types
- 8.2.1. Ready-To-Drink
- 8.2.2. Energy & Protein Bar
- 8.2.3. Powder
- 8.2.4. Tablets/Capsules
- 8.2.5. Others
- 8.1. Market Analysis, Insights and Forecast - by Application
- 9. Middle East & Africa Organic Sports Nutrition Foods and Beverages Analysis, Insights and Forecast, 2020-2032
- 9.1. Market Analysis, Insights and Forecast - by Application
- 9.1.1. Online Sales
- 9.1.2. Offline Sales
- 9.2. Market Analysis, Insights and Forecast - by Types
- 9.2.1. Ready-To-Drink
- 9.2.2. Energy & Protein Bar
- 9.2.3. Powder
- 9.2.4. Tablets/Capsules
- 9.2.5. Others
- 9.1. Market Analysis, Insights and Forecast - by Application
- 10. Asia Pacific Organic Sports Nutrition Foods and Beverages Analysis, Insights and Forecast, 2020-2032
- 10.1. Market Analysis, Insights and Forecast - by Application
- 10.1.1. Online Sales
- 10.1.2. Offline Sales
- 10.2. Market Analysis, Insights and Forecast - by Types
- 10.2.1. Ready-To-Drink
- 10.2.2. Energy & Protein Bar
- 10.2.3. Powder
- 10.2.4. Tablets/Capsules
- 10.2.5. Others
- 10.1. Market Analysis, Insights and Forecast - by Application
- 11. Competitive Analysis
- 11.1. Global Market Share Analysis 2025
- 11.2. Company Profiles
- 11.2.1 Nestlé
- 11.2.1.1. Overview
- 11.2.1.2. Products
- 11.2.1.3. SWOT Analysis
- 11.2.1.4. Recent Developments
- 11.2.1.5. Financials (Based on Availability)
- 11.2.2 Red Bull
- 11.2.2.1. Overview
- 11.2.2.2. Products
- 11.2.2.3. SWOT Analysis
- 11.2.2.4. Recent Developments
- 11.2.2.5. Financials (Based on Availability)
- 11.2.3 Ajinomoto
- 11.2.3.1. Overview
- 11.2.3.2. Products
- 11.2.3.3. SWOT Analysis
- 11.2.3.4. Recent Developments
- 11.2.3.5. Financials (Based on Availability)
- 11.2.4 Keurig Dr. Pepper
- 11.2.4.1. Overview
- 11.2.4.2. Products
- 11.2.4.3. SWOT Analysis
- 11.2.4.4. Recent Developments
- 11.2.4.5. Financials (Based on Availability)
- 11.2.5 Nutrabolt
- 11.2.5.1. Overview
- 11.2.5.2. Products
- 11.2.5.3. SWOT Analysis
- 11.2.5.4. Recent Developments
- 11.2.5.5. Financials (Based on Availability)
- 11.2.6 GlaxoSmithKline
- 11.2.6.1. Overview
- 11.2.6.2. Products
- 11.2.6.3. SWOT Analysis
- 11.2.6.4. Recent Developments
- 11.2.6.5. Financials (Based on Availability)
- 11.2.7 Optimum Nutrition
- 11.2.7.1. Overview
- 11.2.7.2. Products
- 11.2.7.3. SWOT Analysis
- 11.2.7.4. Recent Developments
- 11.2.7.5. Financials (Based on Availability)
- 11.2.8 Premier Nutrition
- 11.2.8.1. Overview
- 11.2.8.2. Products
- 11.2.8.3. SWOT Analysis
- 11.2.8.4. Recent Developments
- 11.2.8.5. Financials (Based on Availability)
- 11.2.9 Biothrive Sciences
- 11.2.9.1. Overview
- 11.2.9.2. Products
- 11.2.9.3. SWOT Analysis
- 11.2.9.4. Recent Developments
- 11.2.9.5. Financials (Based on Availability)
- 11.2.10 Coca-Cola
- 11.2.10.1. Overview
- 11.2.10.2. Products
- 11.2.10.3. SWOT Analysis
- 11.2.10.4. Recent Developments
- 11.2.10.5. Financials (Based on Availability)
- 11.2.11 Pepsi
- 11.2.11.1. Overview
- 11.2.11.2. Products
- 11.2.11.3. SWOT Analysis
- 11.2.11.4. Recent Developments
- 11.2.11.5. Financials (Based on Availability)
- 11.2.12 Now Foods
- 11.2.12.1. Overview
- 11.2.12.2. Products
- 11.2.12.3. SWOT Analysis
- 11.2.12.4. Recent Developments
- 11.2.12.5. Financials (Based on Availability)
- 11.2.13 INC Sports Nutrition
- 11.2.13.1. Overview
- 11.2.13.2. Products
- 11.2.13.3. SWOT Analysis
- 11.2.13.4. Recent Developments
- 11.2.13.5. Financials (Based on Availability)
- 11.2.14 Vitaco Health
- 11.2.14.1. Overview
- 11.2.14.2. Products
- 11.2.14.3. SWOT Analysis
- 11.2.14.4. Recent Developments
- 11.2.14.5. Financials (Based on Availability)
- 11.2.15 Uelzena Group
- 11.2.15.1. Overview
- 11.2.15.2. Products
- 11.2.15.3. SWOT Analysis
- 11.2.15.4. Recent Developments
- 11.2.15.5. Financials (Based on Availability)
- 11.2.16 GenTech Holdings
- 11.2.16.1. Overview
- 11.2.16.2. Products
- 11.2.16.3. SWOT Analysis
- 11.2.16.4. Recent Developments
- 11.2.16.5. Financials (Based on Availability)
- 11.2.17 Abott Nutrition
- 11.2.17.1. Overview
- 11.2.17.2. Products
- 11.2.17.3. SWOT Analysis
- 11.2.17.4. Recent Developments
- 11.2.17.5. Financials (Based on Availability)
- 11.2.18 GNC Holdings
- 11.2.18.1. Overview
- 11.2.18.2. Products
- 11.2.18.3. SWOT Analysis
- 11.2.18.4. Recent Developments
- 11.2.18.5. Financials (Based on Availability)
- 11.2.19 Reckitt Benckiser
- 11.2.19.1. Overview
- 11.2.19.2. Products
- 11.2.19.3. SWOT Analysis
- 11.2.19.4. Recent Developments
- 11.2.19.5. Financials (Based on Availability)
- 11.2.20 Monster Beverage
- 11.2.20.1. Overview
- 11.2.20.2. Products
- 11.2.20.3. SWOT Analysis
- 11.2.20.4. Recent Developments
- 11.2.20.5. Financials (Based on Availability)
- 11.2.21 Glanbia
- 11.2.21.1. Overview
- 11.2.21.2. Products
- 11.2.21.3. SWOT Analysis
- 11.2.21.4. Recent Developments
- 11.2.21.5. Financials (Based on Availability)
- 11.2.22 Maxinutrition
- 11.2.22.1. Overview
- 11.2.22.2. Products
- 11.2.22.3. SWOT Analysis
- 11.2.22.4. Recent Developments
- 11.2.22.5. Financials (Based on Availability)
- 11.2.1 Nestlé
List of Figures
- Figure 1: Global Organic Sports Nutrition Foods and Beverages Revenue Breakdown (undefined, %) by Region 2025 & 2033
- Figure 2: North America Organic Sports Nutrition Foods and Beverages Revenue (undefined), by Application 2025 & 2033
- Figure 3: North America Organic Sports Nutrition Foods and Beverages Revenue Share (%), by Application 2025 & 2033
- Figure 4: North America Organic Sports Nutrition Foods and Beverages Revenue (undefined), by Types 2025 & 2033
- Figure 5: North America Organic Sports Nutrition Foods and Beverages Revenue Share (%), by Types 2025 & 2033
- Figure 6: North America Organic Sports Nutrition Foods and Beverages Revenue (undefined), by Country 2025 & 2033
- Figure 7: North America Organic Sports Nutrition Foods and Beverages Revenue Share (%), by Country 2025 & 2033
- Figure 8: South America Organic Sports Nutrition Foods and Beverages Revenue (undefined), by Application 2025 & 2033
- Figure 9: South America Organic Sports Nutrition Foods and Beverages Revenue Share (%), by Application 2025 & 2033
- Figure 10: South America Organic Sports Nutrition Foods and Beverages Revenue (undefined), by Types 2025 & 2033
- Figure 11: South America Organic Sports Nutrition Foods and Beverages Revenue Share (%), by Types 2025 & 2033
- Figure 12: South America Organic Sports Nutrition Foods and Beverages Revenue (undefined), by Country 2025 & 2033
- Figure 13: South America Organic Sports Nutrition Foods and Beverages Revenue Share (%), by Country 2025 & 2033
- Figure 14: Europe Organic Sports Nutrition Foods and Beverages Revenue (undefined), by Application 2025 & 2033
- Figure 15: Europe Organic Sports Nutrition Foods and Beverages Revenue Share (%), by Application 2025 & 2033
- Figure 16: Europe Organic Sports Nutrition Foods and Beverages Revenue (undefined), by Types 2025 & 2033
- Figure 17: Europe Organic Sports Nutrition Foods and Beverages Revenue Share (%), by Types 2025 & 2033
- Figure 18: Europe Organic Sports Nutrition Foods and Beverages Revenue (undefined), by Country 2025 & 2033
- Figure 19: Europe Organic Sports Nutrition Foods and Beverages Revenue Share (%), by Country 2025 & 2033
- Figure 20: Middle East & Africa Organic Sports Nutrition Foods and Beverages Revenue (undefined), by Application 2025 & 2033
- Figure 21: Middle East & Africa Organic Sports Nutrition Foods and Beverages Revenue Share (%), by Application 2025 & 2033
- Figure 22: Middle East & Africa Organic Sports Nutrition Foods and Beverages Revenue (undefined), by Types 2025 & 2033
- Figure 23: Middle East & Africa Organic Sports Nutrition Foods and Beverages Revenue Share (%), by Types 2025 & 2033
- Figure 24: Middle East & Africa Organic Sports Nutrition Foods and Beverages Revenue (undefined), by Country 2025 & 2033
- Figure 25: Middle East & Africa Organic Sports Nutrition Foods and Beverages Revenue Share (%), by Country 2025 & 2033
- Figure 26: Asia Pacific Organic Sports Nutrition Foods and Beverages Revenue (undefined), by Application 2025 & 2033
- Figure 27: Asia Pacific Organic Sports Nutrition Foods and Beverages Revenue Share (%), by Application 2025 & 2033
- Figure 28: Asia Pacific Organic Sports Nutrition Foods and Beverages Revenue (undefined), by Types 2025 & 2033
- Figure 29: Asia Pacific Organic Sports Nutrition Foods and Beverages Revenue Share (%), by Types 2025 & 2033
- Figure 30: Asia Pacific Organic Sports Nutrition Foods and Beverages Revenue (undefined), by Country 2025 & 2033
- Figure 31: Asia Pacific Organic Sports Nutrition Foods and Beverages Revenue Share (%), by Country 2025 & 2033
List of Tables
- Table 1: Global Organic Sports Nutrition Foods and Beverages Revenue undefined Forecast, by Application 2020 & 2033
- Table 2: Global Organic Sports Nutrition Foods and Beverages Revenue undefined Forecast, by Types 2020 & 2033
- Table 3: Global Organic Sports Nutrition Foods and Beverages Revenue undefined Forecast, by Region 2020 & 2033
- Table 4: Global Organic Sports Nutrition Foods and Beverages Revenue undefined Forecast, by Application 2020 & 2033
- Table 5: Global Organic Sports Nutrition Foods and Beverages Revenue undefined Forecast, by Types 2020 & 2033
- Table 6: Global Organic Sports Nutrition Foods and Beverages Revenue undefined Forecast, by Country 2020 & 2033
- Table 7: United States Organic Sports Nutrition Foods and Beverages Revenue (undefined) Forecast, by Application 2020 & 2033
- Table 8: Canada Organic Sports Nutrition Foods and Beverages Revenue (undefined) Forecast, by Application 2020 & 2033
- Table 9: Mexico Organic Sports Nutrition Foods and Beverages Revenue (undefined) Forecast, by Application 2020 & 2033
- Table 10: Global Organic Sports Nutrition Foods and Beverages Revenue undefined Forecast, by Application 2020 & 2033
- Table 11: Global Organic Sports Nutrition Foods and Beverages Revenue undefined Forecast, by Types 2020 & 2033
- Table 12: Global Organic Sports Nutrition Foods and Beverages Revenue undefined Forecast, by Country 2020 & 2033
- Table 13: Brazil Organic Sports Nutrition Foods and Beverages Revenue (undefined) Forecast, by Application 2020 & 2033
- Table 14: Argentina Organic Sports Nutrition Foods and Beverages Revenue (undefined) Forecast, by Application 2020 & 2033
- Table 15: Rest of South America Organic Sports Nutrition Foods and Beverages Revenue (undefined) Forecast, by Application 2020 & 2033
- Table 16: Global Organic Sports Nutrition Foods and Beverages Revenue undefined Forecast, by Application 2020 & 2033
- Table 17: Global Organic Sports Nutrition Foods and Beverages Revenue undefined Forecast, by Types 2020 & 2033
- Table 18: Global Organic Sports Nutrition Foods and Beverages Revenue undefined Forecast, by Country 2020 & 2033
- Table 19: United Kingdom Organic Sports Nutrition Foods and Beverages Revenue (undefined) Forecast, by Application 2020 & 2033
- Table 20: Germany Organic Sports Nutrition Foods and Beverages Revenue (undefined) Forecast, by Application 2020 & 2033
- Table 21: France Organic Sports Nutrition Foods and Beverages Revenue (undefined) Forecast, by Application 2020 & 2033
- Table 22: Italy Organic Sports Nutrition Foods and Beverages Revenue (undefined) Forecast, by Application 2020 & 2033
- Table 23: Spain Organic Sports Nutrition Foods and Beverages Revenue (undefined) Forecast, by Application 2020 & 2033
- Table 24: Russia Organic Sports Nutrition Foods and Beverages Revenue (undefined) Forecast, by Application 2020 & 2033
- Table 25: Benelux Organic Sports Nutrition Foods and Beverages Revenue (undefined) Forecast, by Application 2020 & 2033
- Table 26: Nordics Organic Sports Nutrition Foods and Beverages Revenue (undefined) Forecast, by Application 2020 & 2033
- Table 27: Rest of Europe Organic Sports Nutrition Foods and Beverages Revenue (undefined) Forecast, by Application 2020 & 2033
- Table 28: Global Organic Sports Nutrition Foods and Beverages Revenue undefined Forecast, by Application 2020 & 2033
- Table 29: Global Organic Sports Nutrition Foods and Beverages Revenue undefined Forecast, by Types 2020 & 2033
- Table 30: Global Organic Sports Nutrition Foods and Beverages Revenue undefined Forecast, by Country 2020 & 2033
- Table 31: Turkey Organic Sports Nutrition Foods and Beverages Revenue (undefined) Forecast, by Application 2020 & 2033
- Table 32: Israel Organic Sports Nutrition Foods and Beverages Revenue (undefined) Forecast, by Application 2020 & 2033
- Table 33: GCC Organic Sports Nutrition Foods and Beverages Revenue (undefined) Forecast, by Application 2020 & 2033
- Table 34: North Africa Organic Sports Nutrition Foods and Beverages Revenue (undefined) Forecast, by Application 2020 & 2033
- Table 35: South Africa Organic Sports Nutrition Foods and Beverages Revenue (undefined) Forecast, by Application 2020 & 2033
- Table 36: Rest of Middle East & Africa Organic Sports Nutrition Foods and Beverages Revenue (undefined) Forecast, by Application 2020 & 2033
- Table 37: Global Organic Sports Nutrition Foods and Beverages Revenue undefined Forecast, by Application 2020 & 2033
- Table 38: Global Organic Sports Nutrition Foods and Beverages Revenue undefined Forecast, by Types 2020 & 2033
- Table 39: Global Organic Sports Nutrition Foods and Beverages Revenue undefined Forecast, by Country 2020 & 2033
- Table 40: China Organic Sports Nutrition Foods and Beverages Revenue (undefined) Forecast, by Application 2020 & 2033
- Table 41: India Organic Sports Nutrition Foods and Beverages Revenue (undefined) Forecast, by Application 2020 & 2033
- Table 42: Japan Organic Sports Nutrition Foods and Beverages Revenue (undefined) Forecast, by Application 2020 & 2033
- Table 43: South Korea Organic Sports Nutrition Foods and Beverages Revenue (undefined) Forecast, by Application 2020 & 2033
- Table 44: ASEAN Organic Sports Nutrition Foods and Beverages Revenue (undefined) Forecast, by Application 2020 & 2033
- Table 45: Oceania Organic Sports Nutrition Foods and Beverages Revenue (undefined) Forecast, by Application 2020 & 2033
- Table 46: Rest of Asia Pacific Organic Sports Nutrition Foods and Beverages Revenue (undefined) Forecast, by Application 2020 & 2033
Frequently Asked Questions
1. What is the projected Compound Annual Growth Rate (CAGR) of the Organic Sports Nutrition Foods and Beverages?
The projected CAGR is approximately 10%.
2. Which companies are prominent players in the Organic Sports Nutrition Foods and Beverages?
Key companies in the market include Nestlé, Red Bull, Ajinomoto, Keurig Dr. Pepper, Nutrabolt, GlaxoSmithKline, Optimum Nutrition, Premier Nutrition, Biothrive Sciences, Coca-Cola, Pepsi, Now Foods, INC Sports Nutrition, Vitaco Health, Uelzena Group, GenTech Holdings, Abott Nutrition, GNC Holdings, Reckitt Benckiser, Monster Beverage, Glanbia, Maxinutrition.
3. What are the main segments of the Organic Sports Nutrition Foods and Beverages?
The market segments include Application, Types.
4. Can you provide details about the market size?
The market size is estimated to be USD XXX N/A as of 2022.
5. What are some drivers contributing to market growth?
N/A
6. What are the notable trends driving market growth?
N/A
7. Are there any restraints impacting market growth?
N/A
8. Can you provide examples of recent developments in the market?
N/A
9. What pricing options are available for accessing the report?
Pricing options include single-user, multi-user, and enterprise licenses priced at USD 2900.00, USD 4350.00, and USD 5800.00 respectively.
10. Is the market size provided in terms of value or volume?
The market size is provided in terms of value, measured in N/A.
11. Are there any specific market keywords associated with the report?
Yes, the market keyword associated with the report is "Organic Sports Nutrition Foods and Beverages," which aids in identifying and referencing the specific market segment covered.
12. How do I determine which pricing option suits my needs best?
The pricing options vary based on user requirements and access needs. Individual users may opt for single-user licenses, while businesses requiring broader access may choose multi-user or enterprise licenses for cost-effective access to the report.
13. Are there any additional resources or data provided in the Organic Sports Nutrition Foods and Beverages report?
While the report offers comprehensive insights, it's advisable to review the specific contents or supplementary materials provided to ascertain if additional resources or data are available.
14. How can I stay updated on further developments or reports in the Organic Sports Nutrition Foods and Beverages?
To stay informed about further developments, trends, and reports in the Organic Sports Nutrition Foods and Beverages, consider subscribing to industry newsletters, following relevant companies and organizations, or regularly checking reputable industry news sources and publications.
Methodology
Step 1 - Identification of Relevant Samples Size from Population Database


Step 2 - Approaches for Defining Global Market Size (Value, Volume* & Price*)

Note*: In applicable scenarios
Step 3 - Data Sources
Primary Research
- Web Analytics
- Survey Reports
- Research Institute
- Latest Research Reports
- Opinion Leaders
Secondary Research
- Annual Reports
- White Paper
- Latest Press Release
- Industry Association
- Paid Database
- Investor Presentations

Step 4 - Data Triangulation
Involves using different sources of information in order to increase the validity of a study
These sources are likely to be stakeholders in a program - participants, other researchers, program staff, other community members, and so on.
Then we put all data in single framework & apply various statistical tools to find out the dynamic on the market.
During the analysis stage, feedback from the stakeholder groups would be compared to determine areas of agreement as well as areas of divergence