

Key Insights
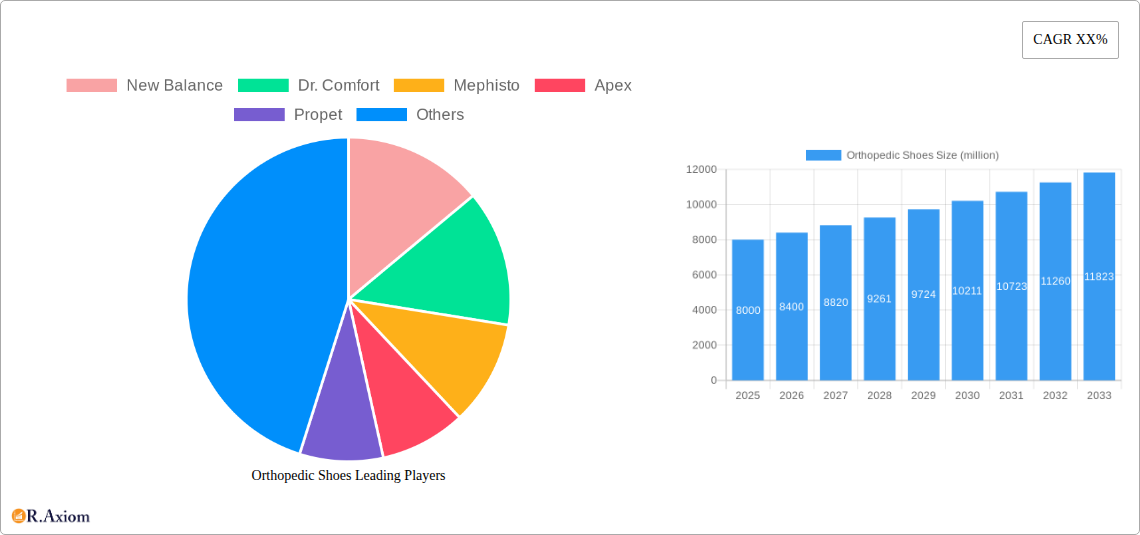
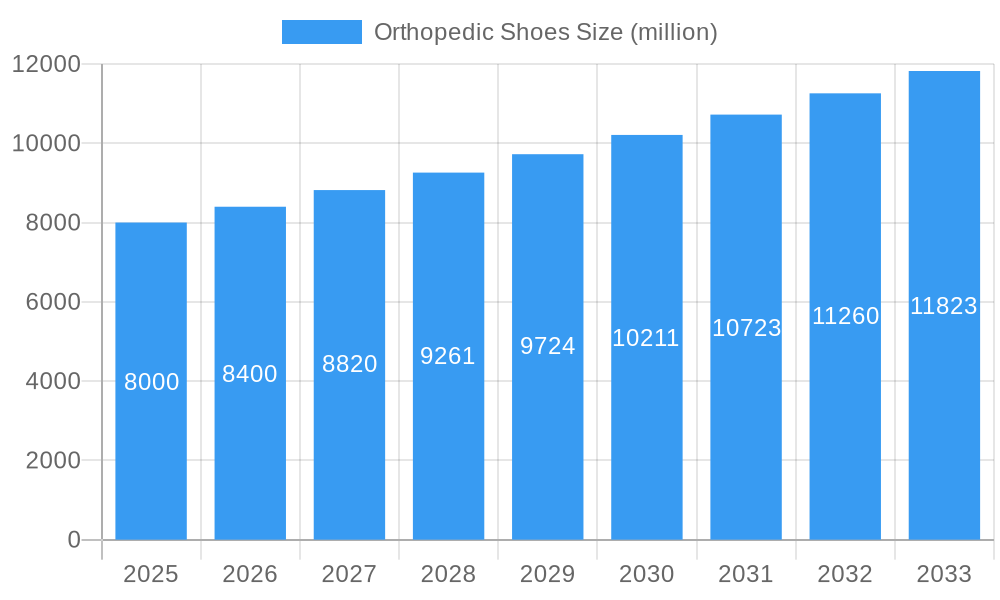
The global orthopedic shoes market is experiencing robust growth, driven by an aging population, rising prevalence of foot-related ailments like diabetes, arthritis, and plantar fasciitis, and increasing awareness of the importance of supportive footwear. The market, estimated at $8 billion in 2025, is projected to maintain a healthy Compound Annual Growth Rate (CAGR) of around 5% through 2033, reaching approximately $12 billion. This growth is fueled by several key trends, including the development of technologically advanced orthopedic shoes incorporating features such as enhanced cushioning, arch support, and adjustable features catering to individual needs. Furthermore, the increasing availability of custom-fit orthopedic shoes and the rising adoption of online sales channels contribute to the market's expansion. However, the high cost of these specialized shoes and the limited insurance coverage in some regions pose considerable restraints to wider adoption.
Orthopedic Shoes Market Size (In Billion)
The competitive landscape is marked by a mix of established brands like New Balance, Dr. Comfort, and Mephisto, alongside specialized companies such as Orthofeet and DARCO, each catering to different segments of the market based on price point, technology, and specific medical needs. Market segmentation is primarily based on shoe type (e.g., diabetic shoes, arthritis shoes), material, and distribution channels (online vs. retail). Regional variations are expected, with North America and Europe currently holding significant market shares due to higher disposable incomes and greater awareness of foot health. However, emerging markets in Asia-Pacific are predicted to demonstrate considerable growth potential over the forecast period, driven by rising health consciousness and increasing disposable incomes. Future innovations in materials science and manufacturing technologies are expected to further enhance the comfort, durability, and affordability of orthopedic shoes, thereby expanding the market’s overall reach and potential.
Orthopedic Shoes Company Market Share
Orthopedic Shoes Market Report: 2019-2033 - A Comprehensive Analysis
This comprehensive report provides an in-depth analysis of the global orthopedic shoes market, encompassing market size, growth drivers, key players, and future trends. The study period spans from 2019 to 2033, with 2025 serving as both the base and estimated year. The forecast period covers 2025-2033, and the historical period is 2019-2024. The report is crucial for industry stakeholders, including manufacturers like New Balance, Dr. Comfort, Mephisto, Apex, Propet, Vionic, Chaneco, Duna, Orthofeet, Piedro, DARCO, Drew Shoe, Sole, Rokab, and LXTD, seeking to understand market dynamics and capitalize on emerging opportunities. The market is projected to reach $XX million by 2033.
Orthopedic Shoes Market Concentration & Innovation
The orthopedic shoes market exhibits a moderately concentrated landscape, with a few dominant players holding significant market share. New Balance, Dr. Comfort, and Mephisto are estimated to collectively control approximately 30% of the market in 2025. However, several smaller players also contribute significantly, fostering competition and innovation. The market is driven by advancements in materials science, resulting in lighter, more comfortable, and supportive shoes. Regulatory frameworks, particularly regarding medical device classifications and safety standards, influence market dynamics. Product substitutes, such as custom orthotics, exert some competitive pressure. End-user trends favor increased comfort, style, and technological integration (e.g., smart shoe technology). M&A activity has been moderate in recent years, with deals totaling approximately $XX million between 2019 and 2024. This activity is anticipated to increase, fueled by the pursuit of market expansion and technological capabilities.
- Market Share (2025): New Balance (12%), Dr. Comfort (10%), Mephisto (8%), Others (70%)
- M&A Deal Value (2019-2024): $XX million
Orthopedic Shoes Industry Trends & Insights
The orthopedic shoes market is experiencing robust growth, driven by several key factors. The aging global population and increasing prevalence of foot-related conditions (diabetes, arthritis) are major catalysts. Technological advancements in materials, design, and manufacturing have led to more comfortable, durable, and functional shoes. Consumer preferences are shifting towards stylish and technologically advanced footwear, blurring the lines between medical and everyday wear. The market exhibits significant competitive dynamics, with companies investing in R&D, marketing, and distribution networks to gain market share. The CAGR for the period 2025-2033 is projected at XX%, with market penetration estimated to reach XX% by 2033. This growth is further fueled by increased awareness of foot health and rising disposable incomes in emerging economies. Specific technological disruptions include the use of 3D printing for customized shoe production and the incorporation of smart sensors for gait analysis and personalized feedback.
Dominant Markets & Segments in Orthopedic Shoes
The North American market holds the largest share of the global orthopedic shoes market, driven by factors including high healthcare expenditure, a large aging population, and high awareness of foot health. Within North America, the United States is the dominant country.
- Key Drivers in North America:
- High prevalence of chronic foot conditions
- Robust healthcare infrastructure
- Strong consumer spending power
- Advanced technological capabilities
The market is segmented by product type (e.g., diabetic shoes, arthritis shoes, athletic shoes), distribution channel (e.g., specialty stores, online retailers, pharmacies), and end-user (e.g., men, women, children). The diabetic shoes segment currently dominates the market, driven by the increasing prevalence of diabetes worldwide. This segment is expected to maintain strong growth throughout the forecast period.
Orthopedic Shoes Product Developments
Recent innovations in orthopedic shoes focus on enhancing comfort, support, and functionality. This includes the use of advanced materials like memory foam, breathable fabrics, and lightweight polymers. Technological integration, such as embedded sensors for gait analysis and pressure mapping, is gaining traction. These developments cater to the increasing demand for personalized and technologically advanced footwear, creating competitive advantages for manufacturers who can effectively integrate these innovations into their products. Moreover, there's a growing trend towards fashionable designs, addressing the consumer desire for stylish orthopedic shoes.
Report Scope & Segmentation Analysis
This report analyzes the global orthopedic shoes market across various segments, including: product type (diabetic, arthritis, athletic, general), material (leather, synthetic, others), distribution channel (online, offline), and end-user (men, women, children). Each segment's growth trajectory, market size, and competitive dynamics are thoroughly assessed, providing granular insights into market behavior and future potential. Growth projections vary across segments, with the diabetic shoe segment showing the highest growth rate due to the rising prevalence of diabetes. The online distribution channel is expected to experience significant growth due to increased online shopping and the convenience of e-commerce platforms.
Key Drivers of Orthopedic Shoes Growth
The growth of the orthopedic shoes market is fueled by a confluence of factors, including:
- Increasing prevalence of chronic diseases: Diabetes, arthritis, and other foot conditions are driving demand for specialized footwear.
- Aging global population: The growing elderly population requires footwear offering enhanced comfort and support.
- Technological advancements: New materials and manufacturing techniques are leading to better-performing and more comfortable shoes.
- Rising disposable incomes: Increased disposable incomes in emerging markets are boosting demand for higher-quality footwear.
Challenges in the Orthopedic Shoes Sector
The orthopedic shoes market faces challenges, including:
- Stringent regulatory requirements: Meeting stringent safety and efficacy standards can be costly and time-consuming.
- Supply chain disruptions: Global supply chain issues can impact the availability of raw materials and increase production costs.
- Intense competition: The market is characterized by intense competition, requiring continuous innovation and effective marketing strategies. This competition results in a pressure to keep prices competitive, affecting overall profit margins. The estimated impact of these factors on market growth is approximately XX% annually.
Emerging Opportunities in Orthopedic Shoes
Several emerging opportunities exist in the orthopedic shoes market, including:
- Expansion into emerging markets: Untapped potential exists in rapidly developing economies with growing middle classes.
- Development of smart shoes: Integration of technology into footwear can provide valuable health data and personalized support.
- Customization and personalization: Offering customized footwear to meet specific individual needs is a key area of growth.
Leading Players in the Orthopedic Shoes Market
- New Balance
- Dr. Comfort
- Mephisto
- Apex
- Propet
- Vionic
- Chaneco
- Duna
- Orthofeet
- Piedro
- DARCO
- Drew Shoe
- Sole
- Rokab
- LXTD
Key Developments in Orthopedic Shoes Industry
- Jan 2023: New Balance launches a new line of diabetic shoes incorporating advanced cushioning technology.
- Oct 2022: Dr. Comfort acquires a smaller competitor, expanding its market reach.
- Apr 2021: Mephisto introduces a new collection of stylish orthopedic sandals.
- (Further specific details would require access to industry-specific news and databases.)
Strategic Outlook for Orthopedic Shoes Market
The orthopedic shoes market is poised for continued growth, driven by increasing demand for comfortable and supportive footwear. Future market potential lies in leveraging technological advancements, expanding into new markets, and offering customized solutions to meet the specific needs of diverse consumer segments. This includes a focus on sustainable and ethically sourced materials, responding to growing consumer demand for environmentally responsible products. The market is expected to remain competitive, with successful players prioritizing innovation, marketing, and strong distribution networks.
Orthopedic Shoes Segmentation
-
1. Application
- 1.1. Children Less than 5 years old
- 1.2. Juveniles
- 1.3. Adults
-
2. Types
- 2.1. Flatfoot Orthopedic Shoes
- 2.2. Cavus Orthopedic Shoes
- 2.3. Calcaneal Spur Orthopedic Shoes
- 2.4. Varus Orthopedic Shoes and Valgus Orthopedic Shoes
- 2.5. Others
Orthopedic Shoes Segmentation By Geography
-
1. North America
- 1.1. United States
- 1.2. Canada
- 1.3. Mexico
-
2. South America
- 2.1. Brazil
- 2.2. Argentina
- 2.3. Rest of South America
-
3. Europe
- 3.1. United Kingdom
- 3.2. Germany
- 3.3. France
- 3.4. Italy
- 3.5. Spain
- 3.6. Russia
- 3.7. Benelux
- 3.8. Nordics
- 3.9. Rest of Europe
-
4. Middle East & Africa
- 4.1. Turkey
- 4.2. Israel
- 4.3. GCC
- 4.4. North Africa
- 4.5. South Africa
- 4.6. Rest of Middle East & Africa
-
5. Asia Pacific
- 5.1. China
- 5.2. India
- 5.3. Japan
- 5.4. South Korea
- 5.5. ASEAN
- 5.6. Oceania
- 5.7. Rest of Asia Pacific

Orthopedic Shoes Regional Market Share
Geographic Coverage of Orthopedic Shoes
Orthopedic Shoes REPORT HIGHLIGHTS
| Aspects | Details |
|---|---|
| Study Period | 2020-2034 |
| Base Year | 2025 |
| Estimated Year | 2026 |
| Forecast Period | 2026-2034 |
| Historical Period | 2020-2025 |
| Growth Rate | CAGR of XX% from 2020-2034 |
| Segmentation |
|
Table of Contents
- 1. Introduction
- 1.1. Research Scope
- 1.2. Market Segmentation
- 1.3. Research Methodology
- 1.4. Definitions and Assumptions
- 2. Executive Summary
- 2.1. Introduction
- 3. Market Dynamics
- 3.1. Introduction
- 3.2. Market Drivers
- 3.3. Market Restrains
- 3.4. Market Trends
- 4. Market Factor Analysis
- 4.1. Porters Five Forces
- 4.2. Supply/Value Chain
- 4.3. PESTEL analysis
- 4.4. Market Entropy
- 4.5. Patent/Trademark Analysis
- 5. Global Orthopedic Shoes Analysis, Insights and Forecast, 2020-2032
- 5.1. Market Analysis, Insights and Forecast - by Application
- 5.1.1. Children Less than 5 years old
- 5.1.2. Juveniles
- 5.1.3. Adults
- 5.2. Market Analysis, Insights and Forecast - by Types
- 5.2.1. Flatfoot Orthopedic Shoes
- 5.2.2. Cavus Orthopedic Shoes
- 5.2.3. Calcaneal Spur Orthopedic Shoes
- 5.2.4. Varus Orthopedic Shoes and Valgus Orthopedic Shoes
- 5.2.5. Others
- 5.3. Market Analysis, Insights and Forecast - by Region
- 5.3.1. North America
- 5.3.2. South America
- 5.3.3. Europe
- 5.3.4. Middle East & Africa
- 5.3.5. Asia Pacific
- 5.1. Market Analysis, Insights and Forecast - by Application
- 6. North America Orthopedic Shoes Analysis, Insights and Forecast, 2020-2032
- 6.1. Market Analysis, Insights and Forecast - by Application
- 6.1.1. Children Less than 5 years old
- 6.1.2. Juveniles
- 6.1.3. Adults
- 6.2. Market Analysis, Insights and Forecast - by Types
- 6.2.1. Flatfoot Orthopedic Shoes
- 6.2.2. Cavus Orthopedic Shoes
- 6.2.3. Calcaneal Spur Orthopedic Shoes
- 6.2.4. Varus Orthopedic Shoes and Valgus Orthopedic Shoes
- 6.2.5. Others
- 6.1. Market Analysis, Insights and Forecast - by Application
- 7. South America Orthopedic Shoes Analysis, Insights and Forecast, 2020-2032
- 7.1. Market Analysis, Insights and Forecast - by Application
- 7.1.1. Children Less than 5 years old
- 7.1.2. Juveniles
- 7.1.3. Adults
- 7.2. Market Analysis, Insights and Forecast - by Types
- 7.2.1. Flatfoot Orthopedic Shoes
- 7.2.2. Cavus Orthopedic Shoes
- 7.2.3. Calcaneal Spur Orthopedic Shoes
- 7.2.4. Varus Orthopedic Shoes and Valgus Orthopedic Shoes
- 7.2.5. Others
- 7.1. Market Analysis, Insights and Forecast - by Application
- 8. Europe Orthopedic Shoes Analysis, Insights and Forecast, 2020-2032
- 8.1. Market Analysis, Insights and Forecast - by Application
- 8.1.1. Children Less than 5 years old
- 8.1.2. Juveniles
- 8.1.3. Adults
- 8.2. Market Analysis, Insights and Forecast - by Types
- 8.2.1. Flatfoot Orthopedic Shoes
- 8.2.2. Cavus Orthopedic Shoes
- 8.2.3. Calcaneal Spur Orthopedic Shoes
- 8.2.4. Varus Orthopedic Shoes and Valgus Orthopedic Shoes
- 8.2.5. Others
- 8.1. Market Analysis, Insights and Forecast - by Application
- 9. Middle East & Africa Orthopedic Shoes Analysis, Insights and Forecast, 2020-2032
- 9.1. Market Analysis, Insights and Forecast - by Application
- 9.1.1. Children Less than 5 years old
- 9.1.2. Juveniles
- 9.1.3. Adults
- 9.2. Market Analysis, Insights and Forecast - by Types
- 9.2.1. Flatfoot Orthopedic Shoes
- 9.2.2. Cavus Orthopedic Shoes
- 9.2.3. Calcaneal Spur Orthopedic Shoes
- 9.2.4. Varus Orthopedic Shoes and Valgus Orthopedic Shoes
- 9.2.5. Others
- 9.1. Market Analysis, Insights and Forecast - by Application
- 10. Asia Pacific Orthopedic Shoes Analysis, Insights and Forecast, 2020-2032
- 10.1. Market Analysis, Insights and Forecast - by Application
- 10.1.1. Children Less than 5 years old
- 10.1.2. Juveniles
- 10.1.3. Adults
- 10.2. Market Analysis, Insights and Forecast - by Types
- 10.2.1. Flatfoot Orthopedic Shoes
- 10.2.2. Cavus Orthopedic Shoes
- 10.2.3. Calcaneal Spur Orthopedic Shoes
- 10.2.4. Varus Orthopedic Shoes and Valgus Orthopedic Shoes
- 10.2.5. Others
- 10.1. Market Analysis, Insights and Forecast - by Application
- 11. Competitive Analysis
- 11.1. Global Market Share Analysis 2025
- 11.2. Company Profiles
- 11.2.1 New Balance
- 11.2.1.1. Overview
- 11.2.1.2. Products
- 11.2.1.3. SWOT Analysis
- 11.2.1.4. Recent Developments
- 11.2.1.5. Financials (Based on Availability)
- 11.2.2 Dr. Comfort
- 11.2.2.1. Overview
- 11.2.2.2. Products
- 11.2.2.3. SWOT Analysis
- 11.2.2.4. Recent Developments
- 11.2.2.5. Financials (Based on Availability)
- 11.2.3 Mephisto
- 11.2.3.1. Overview
- 11.2.3.2. Products
- 11.2.3.3. SWOT Analysis
- 11.2.3.4. Recent Developments
- 11.2.3.5. Financials (Based on Availability)
- 11.2.4 Apex
- 11.2.4.1. Overview
- 11.2.4.2. Products
- 11.2.4.3. SWOT Analysis
- 11.2.4.4. Recent Developments
- 11.2.4.5. Financials (Based on Availability)
- 11.2.5 Propet
- 11.2.5.1. Overview
- 11.2.5.2. Products
- 11.2.5.3. SWOT Analysis
- 11.2.5.4. Recent Developments
- 11.2.5.5. Financials (Based on Availability)
- 11.2.6 Vionic
- 11.2.6.1. Overview
- 11.2.6.2. Products
- 11.2.6.3. SWOT Analysis
- 11.2.6.4. Recent Developments
- 11.2.6.5. Financials (Based on Availability)
- 11.2.7 Chaneco
- 11.2.7.1. Overview
- 11.2.7.2. Products
- 11.2.7.3. SWOT Analysis
- 11.2.7.4. Recent Developments
- 11.2.7.5. Financials (Based on Availability)
- 11.2.8 Duna
- 11.2.8.1. Overview
- 11.2.8.2. Products
- 11.2.8.3. SWOT Analysis
- 11.2.8.4. Recent Developments
- 11.2.8.5. Financials (Based on Availability)
- 11.2.9 Orthofeet
- 11.2.9.1. Overview
- 11.2.9.2. Products
- 11.2.9.3. SWOT Analysis
- 11.2.9.4. Recent Developments
- 11.2.9.5. Financials (Based on Availability)
- 11.2.10 Piedro
- 11.2.10.1. Overview
- 11.2.10.2. Products
- 11.2.10.3. SWOT Analysis
- 11.2.10.4. Recent Developments
- 11.2.10.5. Financials (Based on Availability)
- 11.2.11 DARCO
- 11.2.11.1. Overview
- 11.2.11.2. Products
- 11.2.11.3. SWOT Analysis
- 11.2.11.4. Recent Developments
- 11.2.11.5. Financials (Based on Availability)
- 11.2.12 Drew Shoe
- 11.2.12.1. Overview
- 11.2.12.2. Products
- 11.2.12.3. SWOT Analysis
- 11.2.12.4. Recent Developments
- 11.2.12.5. Financials (Based on Availability)
- 11.2.13 Sole
- 11.2.13.1. Overview
- 11.2.13.2. Products
- 11.2.13.3. SWOT Analysis
- 11.2.13.4. Recent Developments
- 11.2.13.5. Financials (Based on Availability)
- 11.2.14 Rokab
- 11.2.14.1. Overview
- 11.2.14.2. Products
- 11.2.14.3. SWOT Analysis
- 11.2.14.4. Recent Developments
- 11.2.14.5. Financials (Based on Availability)
- 11.2.15 LXTD
- 11.2.15.1. Overview
- 11.2.15.2. Products
- 11.2.15.3. SWOT Analysis
- 11.2.15.4. Recent Developments
- 11.2.15.5. Financials (Based on Availability)
- 11.2.1 New Balance
List of Figures
- Figure 1: Global Orthopedic Shoes Revenue Breakdown (million, %) by Region 2025 & 2033
- Figure 2: Global Orthopedic Shoes Volume Breakdown (K, %) by Region 2025 & 2033
- Figure 3: North America Orthopedic Shoes Revenue (million), by Application 2025 & 2033
- Figure 4: North America Orthopedic Shoes Volume (K), by Application 2025 & 2033
- Figure 5: North America Orthopedic Shoes Revenue Share (%), by Application 2025 & 2033
- Figure 6: North America Orthopedic Shoes Volume Share (%), by Application 2025 & 2033
- Figure 7: North America Orthopedic Shoes Revenue (million), by Types 2025 & 2033
- Figure 8: North America Orthopedic Shoes Volume (K), by Types 2025 & 2033
- Figure 9: North America Orthopedic Shoes Revenue Share (%), by Types 2025 & 2033
- Figure 10: North America Orthopedic Shoes Volume Share (%), by Types 2025 & 2033
- Figure 11: North America Orthopedic Shoes Revenue (million), by Country 2025 & 2033
- Figure 12: North America Orthopedic Shoes Volume (K), by Country 2025 & 2033
- Figure 13: North America Orthopedic Shoes Revenue Share (%), by Country 2025 & 2033
- Figure 14: North America Orthopedic Shoes Volume Share (%), by Country 2025 & 2033
- Figure 15: South America Orthopedic Shoes Revenue (million), by Application 2025 & 2033
- Figure 16: South America Orthopedic Shoes Volume (K), by Application 2025 & 2033
- Figure 17: South America Orthopedic Shoes Revenue Share (%), by Application 2025 & 2033
- Figure 18: South America Orthopedic Shoes Volume Share (%), by Application 2025 & 2033
- Figure 19: South America Orthopedic Shoes Revenue (million), by Types 2025 & 2033
- Figure 20: South America Orthopedic Shoes Volume (K), by Types 2025 & 2033
- Figure 21: South America Orthopedic Shoes Revenue Share (%), by Types 2025 & 2033
- Figure 22: South America Orthopedic Shoes Volume Share (%), by Types 2025 & 2033
- Figure 23: South America Orthopedic Shoes Revenue (million), by Country 2025 & 2033
- Figure 24: South America Orthopedic Shoes Volume (K), by Country 2025 & 2033
- Figure 25: South America Orthopedic Shoes Revenue Share (%), by Country 2025 & 2033
- Figure 26: South America Orthopedic Shoes Volume Share (%), by Country 2025 & 2033
- Figure 27: Europe Orthopedic Shoes Revenue (million), by Application 2025 & 2033
- Figure 28: Europe Orthopedic Shoes Volume (K), by Application 2025 & 2033
- Figure 29: Europe Orthopedic Shoes Revenue Share (%), by Application 2025 & 2033
- Figure 30: Europe Orthopedic Shoes Volume Share (%), by Application 2025 & 2033
- Figure 31: Europe Orthopedic Shoes Revenue (million), by Types 2025 & 2033
- Figure 32: Europe Orthopedic Shoes Volume (K), by Types 2025 & 2033
- Figure 33: Europe Orthopedic Shoes Revenue Share (%), by Types 2025 & 2033
- Figure 34: Europe Orthopedic Shoes Volume Share (%), by Types 2025 & 2033
- Figure 35: Europe Orthopedic Shoes Revenue (million), by Country 2025 & 2033
- Figure 36: Europe Orthopedic Shoes Volume (K), by Country 2025 & 2033
- Figure 37: Europe Orthopedic Shoes Revenue Share (%), by Country 2025 & 2033
- Figure 38: Europe Orthopedic Shoes Volume Share (%), by Country 2025 & 2033
- Figure 39: Middle East & Africa Orthopedic Shoes Revenue (million), by Application 2025 & 2033
- Figure 40: Middle East & Africa Orthopedic Shoes Volume (K), by Application 2025 & 2033
- Figure 41: Middle East & Africa Orthopedic Shoes Revenue Share (%), by Application 2025 & 2033
- Figure 42: Middle East & Africa Orthopedic Shoes Volume Share (%), by Application 2025 & 2033
- Figure 43: Middle East & Africa Orthopedic Shoes Revenue (million), by Types 2025 & 2033
- Figure 44: Middle East & Africa Orthopedic Shoes Volume (K), by Types 2025 & 2033
- Figure 45: Middle East & Africa Orthopedic Shoes Revenue Share (%), by Types 2025 & 2033
- Figure 46: Middle East & Africa Orthopedic Shoes Volume Share (%), by Types 2025 & 2033
- Figure 47: Middle East & Africa Orthopedic Shoes Revenue (million), by Country 2025 & 2033
- Figure 48: Middle East & Africa Orthopedic Shoes Volume (K), by Country 2025 & 2033
- Figure 49: Middle East & Africa Orthopedic Shoes Revenue Share (%), by Country 2025 & 2033
- Figure 50: Middle East & Africa Orthopedic Shoes Volume Share (%), by Country 2025 & 2033
- Figure 51: Asia Pacific Orthopedic Shoes Revenue (million), by Application 2025 & 2033
- Figure 52: Asia Pacific Orthopedic Shoes Volume (K), by Application 2025 & 2033
- Figure 53: Asia Pacific Orthopedic Shoes Revenue Share (%), by Application 2025 & 2033
- Figure 54: Asia Pacific Orthopedic Shoes Volume Share (%), by Application 2025 & 2033
- Figure 55: Asia Pacific Orthopedic Shoes Revenue (million), by Types 2025 & 2033
- Figure 56: Asia Pacific Orthopedic Shoes Volume (K), by Types 2025 & 2033
- Figure 57: Asia Pacific Orthopedic Shoes Revenue Share (%), by Types 2025 & 2033
- Figure 58: Asia Pacific Orthopedic Shoes Volume Share (%), by Types 2025 & 2033
- Figure 59: Asia Pacific Orthopedic Shoes Revenue (million), by Country 2025 & 2033
- Figure 60: Asia Pacific Orthopedic Shoes Volume (K), by Country 2025 & 2033
- Figure 61: Asia Pacific Orthopedic Shoes Revenue Share (%), by Country 2025 & 2033
- Figure 62: Asia Pacific Orthopedic Shoes Volume Share (%), by Country 2025 & 2033
List of Tables
- Table 1: Global Orthopedic Shoes Revenue million Forecast, by Application 2020 & 2033
- Table 2: Global Orthopedic Shoes Volume K Forecast, by Application 2020 & 2033
- Table 3: Global Orthopedic Shoes Revenue million Forecast, by Types 2020 & 2033
- Table 4: Global Orthopedic Shoes Volume K Forecast, by Types 2020 & 2033
- Table 5: Global Orthopedic Shoes Revenue million Forecast, by Region 2020 & 2033
- Table 6: Global Orthopedic Shoes Volume K Forecast, by Region 2020 & 2033
- Table 7: Global Orthopedic Shoes Revenue million Forecast, by Application 2020 & 2033
- Table 8: Global Orthopedic Shoes Volume K Forecast, by Application 2020 & 2033
- Table 9: Global Orthopedic Shoes Revenue million Forecast, by Types 2020 & 2033
- Table 10: Global Orthopedic Shoes Volume K Forecast, by Types 2020 & 2033
- Table 11: Global Orthopedic Shoes Revenue million Forecast, by Country 2020 & 2033
- Table 12: Global Orthopedic Shoes Volume K Forecast, by Country 2020 & 2033
- Table 13: United States Orthopedic Shoes Revenue (million) Forecast, by Application 2020 & 2033
- Table 14: United States Orthopedic Shoes Volume (K) Forecast, by Application 2020 & 2033
- Table 15: Canada Orthopedic Shoes Revenue (million) Forecast, by Application 2020 & 2033
- Table 16: Canada Orthopedic Shoes Volume (K) Forecast, by Application 2020 & 2033
- Table 17: Mexico Orthopedic Shoes Revenue (million) Forecast, by Application 2020 & 2033
- Table 18: Mexico Orthopedic Shoes Volume (K) Forecast, by Application 2020 & 2033
- Table 19: Global Orthopedic Shoes Revenue million Forecast, by Application 2020 & 2033
- Table 20: Global Orthopedic Shoes Volume K Forecast, by Application 2020 & 2033
- Table 21: Global Orthopedic Shoes Revenue million Forecast, by Types 2020 & 2033
- Table 22: Global Orthopedic Shoes Volume K Forecast, by Types 2020 & 2033
- Table 23: Global Orthopedic Shoes Revenue million Forecast, by Country 2020 & 2033
- Table 24: Global Orthopedic Shoes Volume K Forecast, by Country 2020 & 2033
- Table 25: Brazil Orthopedic Shoes Revenue (million) Forecast, by Application 2020 & 2033
- Table 26: Brazil Orthopedic Shoes Volume (K) Forecast, by Application 2020 & 2033
- Table 27: Argentina Orthopedic Shoes Revenue (million) Forecast, by Application 2020 & 2033
- Table 28: Argentina Orthopedic Shoes Volume (K) Forecast, by Application 2020 & 2033
- Table 29: Rest of South America Orthopedic Shoes Revenue (million) Forecast, by Application 2020 & 2033
- Table 30: Rest of South America Orthopedic Shoes Volume (K) Forecast, by Application 2020 & 2033
- Table 31: Global Orthopedic Shoes Revenue million Forecast, by Application 2020 & 2033
- Table 32: Global Orthopedic Shoes Volume K Forecast, by Application 2020 & 2033
- Table 33: Global Orthopedic Shoes Revenue million Forecast, by Types 2020 & 2033
- Table 34: Global Orthopedic Shoes Volume K Forecast, by Types 2020 & 2033
- Table 35: Global Orthopedic Shoes Revenue million Forecast, by Country 2020 & 2033
- Table 36: Global Orthopedic Shoes Volume K Forecast, by Country 2020 & 2033
- Table 37: United Kingdom Orthopedic Shoes Revenue (million) Forecast, by Application 2020 & 2033
- Table 38: United Kingdom Orthopedic Shoes Volume (K) Forecast, by Application 2020 & 2033
- Table 39: Germany Orthopedic Shoes Revenue (million) Forecast, by Application 2020 & 2033
- Table 40: Germany Orthopedic Shoes Volume (K) Forecast, by Application 2020 & 2033
- Table 41: France Orthopedic Shoes Revenue (million) Forecast, by Application 2020 & 2033
- Table 42: France Orthopedic Shoes Volume (K) Forecast, by Application 2020 & 2033
- Table 43: Italy Orthopedic Shoes Revenue (million) Forecast, by Application 2020 & 2033
- Table 44: Italy Orthopedic Shoes Volume (K) Forecast, by Application 2020 & 2033
- Table 45: Spain Orthopedic Shoes Revenue (million) Forecast, by Application 2020 & 2033
- Table 46: Spain Orthopedic Shoes Volume (K) Forecast, by Application 2020 & 2033
- Table 47: Russia Orthopedic Shoes Revenue (million) Forecast, by Application 2020 & 2033
- Table 48: Russia Orthopedic Shoes Volume (K) Forecast, by Application 2020 & 2033
- Table 49: Benelux Orthopedic Shoes Revenue (million) Forecast, by Application 2020 & 2033
- Table 50: Benelux Orthopedic Shoes Volume (K) Forecast, by Application 2020 & 2033
- Table 51: Nordics Orthopedic Shoes Revenue (million) Forecast, by Application 2020 & 2033
- Table 52: Nordics Orthopedic Shoes Volume (K) Forecast, by Application 2020 & 2033
- Table 53: Rest of Europe Orthopedic Shoes Revenue (million) Forecast, by Application 2020 & 2033
- Table 54: Rest of Europe Orthopedic Shoes Volume (K) Forecast, by Application 2020 & 2033
- Table 55: Global Orthopedic Shoes Revenue million Forecast, by Application 2020 & 2033
- Table 56: Global Orthopedic Shoes Volume K Forecast, by Application 2020 & 2033
- Table 57: Global Orthopedic Shoes Revenue million Forecast, by Types 2020 & 2033
- Table 58: Global Orthopedic Shoes Volume K Forecast, by Types 2020 & 2033
- Table 59: Global Orthopedic Shoes Revenue million Forecast, by Country 2020 & 2033
- Table 60: Global Orthopedic Shoes Volume K Forecast, by Country 2020 & 2033
- Table 61: Turkey Orthopedic Shoes Revenue (million) Forecast, by Application 2020 & 2033
- Table 62: Turkey Orthopedic Shoes Volume (K) Forecast, by Application 2020 & 2033
- Table 63: Israel Orthopedic Shoes Revenue (million) Forecast, by Application 2020 & 2033
- Table 64: Israel Orthopedic Shoes Volume (K) Forecast, by Application 2020 & 2033
- Table 65: GCC Orthopedic Shoes Revenue (million) Forecast, by Application 2020 & 2033
- Table 66: GCC Orthopedic Shoes Volume (K) Forecast, by Application 2020 & 2033
- Table 67: North Africa Orthopedic Shoes Revenue (million) Forecast, by Application 2020 & 2033
- Table 68: North Africa Orthopedic Shoes Volume (K) Forecast, by Application 2020 & 2033
- Table 69: South Africa Orthopedic Shoes Revenue (million) Forecast, by Application 2020 & 2033
- Table 70: South Africa Orthopedic Shoes Volume (K) Forecast, by Application 2020 & 2033
- Table 71: Rest of Middle East & Africa Orthopedic Shoes Revenue (million) Forecast, by Application 2020 & 2033
- Table 72: Rest of Middle East & Africa Orthopedic Shoes Volume (K) Forecast, by Application 2020 & 2033
- Table 73: Global Orthopedic Shoes Revenue million Forecast, by Application 2020 & 2033
- Table 74: Global Orthopedic Shoes Volume K Forecast, by Application 2020 & 2033
- Table 75: Global Orthopedic Shoes Revenue million Forecast, by Types 2020 & 2033
- Table 76: Global Orthopedic Shoes Volume K Forecast, by Types 2020 & 2033
- Table 77: Global Orthopedic Shoes Revenue million Forecast, by Country 2020 & 2033
- Table 78: Global Orthopedic Shoes Volume K Forecast, by Country 2020 & 2033
- Table 79: China Orthopedic Shoes Revenue (million) Forecast, by Application 2020 & 2033
- Table 80: China Orthopedic Shoes Volume (K) Forecast, by Application 2020 & 2033
- Table 81: India Orthopedic Shoes Revenue (million) Forecast, by Application 2020 & 2033
- Table 82: India Orthopedic Shoes Volume (K) Forecast, by Application 2020 & 2033
- Table 83: Japan Orthopedic Shoes Revenue (million) Forecast, by Application 2020 & 2033
- Table 84: Japan Orthopedic Shoes Volume (K) Forecast, by Application 2020 & 2033
- Table 85: South Korea Orthopedic Shoes Revenue (million) Forecast, by Application 2020 & 2033
- Table 86: South Korea Orthopedic Shoes Volume (K) Forecast, by Application 2020 & 2033
- Table 87: ASEAN Orthopedic Shoes Revenue (million) Forecast, by Application 2020 & 2033
- Table 88: ASEAN Orthopedic Shoes Volume (K) Forecast, by Application 2020 & 2033
- Table 89: Oceania Orthopedic Shoes Revenue (million) Forecast, by Application 2020 & 2033
- Table 90: Oceania Orthopedic Shoes Volume (K) Forecast, by Application 2020 & 2033
- Table 91: Rest of Asia Pacific Orthopedic Shoes Revenue (million) Forecast, by Application 2020 & 2033
- Table 92: Rest of Asia Pacific Orthopedic Shoes Volume (K) Forecast, by Application 2020 & 2033
Frequently Asked Questions
1. What is the projected Compound Annual Growth Rate (CAGR) of the Orthopedic Shoes?
The projected CAGR is approximately XX%.
2. Which companies are prominent players in the Orthopedic Shoes?
Key companies in the market include New Balance, Dr. Comfort, Mephisto, Apex, Propet, Vionic, Chaneco, Duna, Orthofeet, Piedro, DARCO, Drew Shoe, Sole, Rokab, LXTD.
3. What are the main segments of the Orthopedic Shoes?
The market segments include Application, Types.
4. Can you provide details about the market size?
The market size is estimated to be USD XXX million as of 2022.
5. What are some drivers contributing to market growth?
N/A
6. What are the notable trends driving market growth?
N/A
7. Are there any restraints impacting market growth?
N/A
8. Can you provide examples of recent developments in the market?
N/A
9. What pricing options are available for accessing the report?
Pricing options include single-user, multi-user, and enterprise licenses priced at USD 3350.00, USD 5025.00, and USD 6700.00 respectively.
10. Is the market size provided in terms of value or volume?
The market size is provided in terms of value, measured in million and volume, measured in K.
11. Are there any specific market keywords associated with the report?
Yes, the market keyword associated with the report is "Orthopedic Shoes," which aids in identifying and referencing the specific market segment covered.
12. How do I determine which pricing option suits my needs best?
The pricing options vary based on user requirements and access needs. Individual users may opt for single-user licenses, while businesses requiring broader access may choose multi-user or enterprise licenses for cost-effective access to the report.
13. Are there any additional resources or data provided in the Orthopedic Shoes report?
While the report offers comprehensive insights, it's advisable to review the specific contents or supplementary materials provided to ascertain if additional resources or data are available.
14. How can I stay updated on further developments or reports in the Orthopedic Shoes?
To stay informed about further developments, trends, and reports in the Orthopedic Shoes, consider subscribing to industry newsletters, following relevant companies and organizations, or regularly checking reputable industry news sources and publications.
Methodology
Step 1 - Identification of Relevant Samples Size from Population Database


Step 2 - Approaches for Defining Global Market Size (Value, Volume* & Price*)

Note*: In applicable scenarios
Step 3 - Data Sources
Primary Research
- Web Analytics
- Survey Reports
- Research Institute
- Latest Research Reports
- Opinion Leaders
Secondary Research
- Annual Reports
- White Paper
- Latest Press Release
- Industry Association
- Paid Database
- Investor Presentations

Step 4 - Data Triangulation
Involves using different sources of information in order to increase the validity of a study
These sources are likely to be stakeholders in a program - participants, other researchers, program staff, other community members, and so on.
Then we put all data in single framework & apply various statistical tools to find out the dynamic on the market.
During the analysis stage, feedback from the stakeholder groups would be compared to determine areas of agreement as well as areas of divergence