

Key Insights
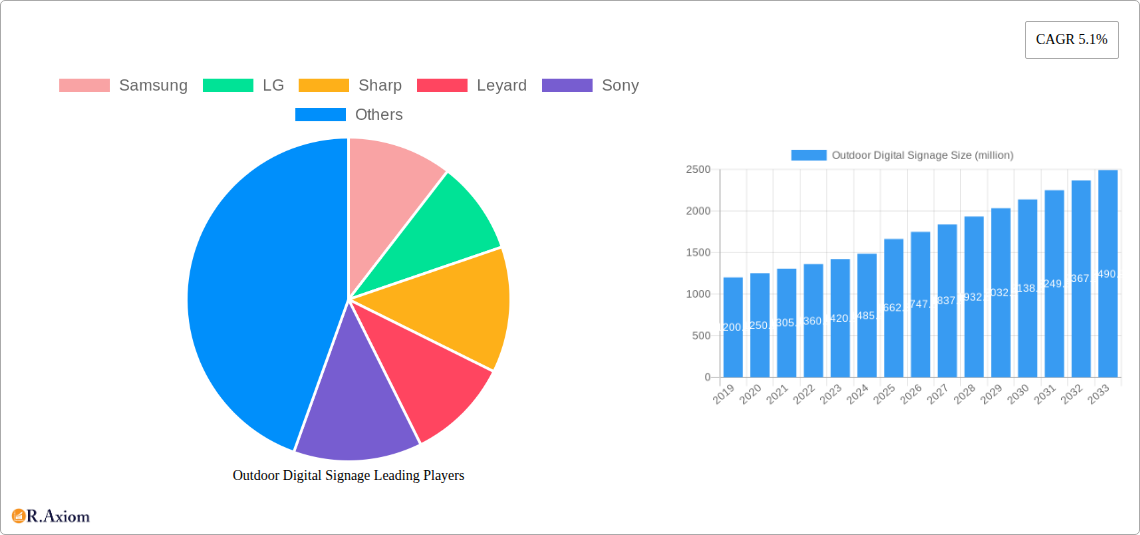
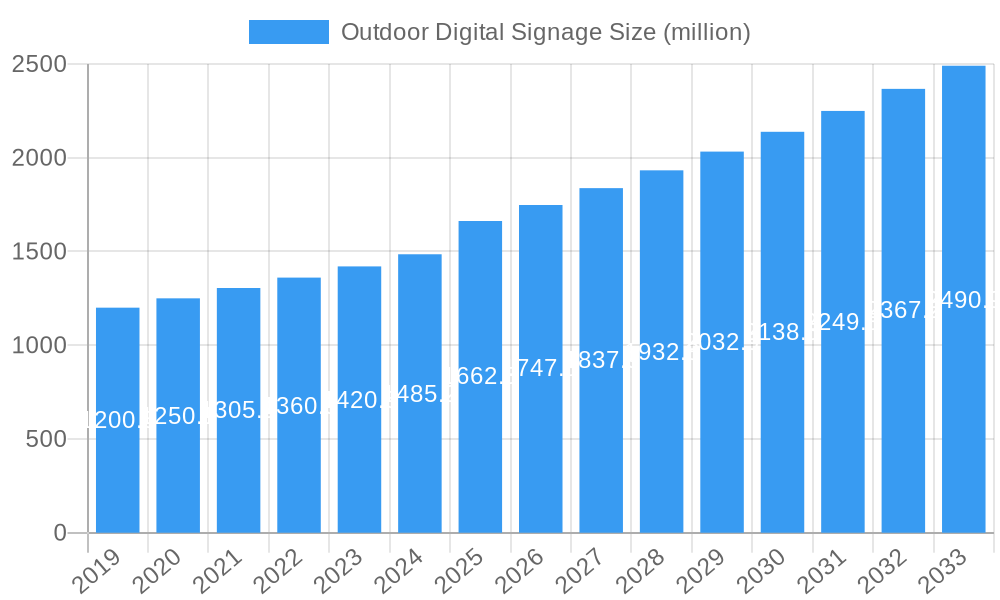
The global Outdoor Digital Signage market is poised for robust expansion, projected to reach a significant valuation of USD 1662.5 million. Driven by an estimated Compound Annual Growth Rate (CAGR) of 5.1%, the market is expected to witness sustained and steady growth throughout the forecast period of 2019-2033, with the base and estimated year of 2025 serving as a pivotal point for current and future projections. This upward trajectory is fueled by a convergence of factors, including the increasing demand for dynamic and engaging advertising solutions across various sectors. The commercial segment, encompassing retail environments and public spaces, is a primary growth engine, leveraging digital signage for promotions, information dissemination, and enhanced customer experiences. Similarly, the institutional sector, including educational facilities and government buildings, is adopting these solutions for internal communications and public announcements. Infrastructure projects are also increasingly incorporating outdoor digital signage for wayfinding, traffic management, and public service announcements, further solidifying its market presence.
Outdoor Digital Signage Market Size (In Billion)
Further amplifying market growth are technological advancements and evolving consumer preferences for visually compelling content. The market segmentation by screen size indicates a balanced demand across different display dimensions, with "Between 32 and 52 inches" likely representing a sweet spot for widespread adoption due to its versatility. However, the "Above 52 inch" segment is expected to see accelerated growth, particularly in large-scale advertising and public display applications. Key players such as Samsung, LG, Sharp, Leyard, and Sony are at the forefront of innovation, introducing more durable, energy-efficient, and high-resolution displays designed for outdoor resilience. The Asia Pacific region, particularly China and India, is anticipated to be a significant contributor to market expansion due to rapid urbanization, a burgeoning advertising industry, and substantial investments in public infrastructure. While the market presents a promising outlook, potential restraints such as high initial investment costs and the need for robust maintenance infrastructure for outdoor installations will need to be strategically addressed by market participants to ensure continued, sustainable growth.
Outdoor Digital Signage Company Market Share
This comprehensive report offers an in-depth analysis of the global Outdoor Digital Signage market, covering the historical period from 2019 to 2024, the base year of 2025, and an extensive forecast period extending to 2033. We delve into market concentration, innovation drivers, regulatory landscapes, and emerging trends, providing actionable insights for industry stakeholders, including manufacturers, advertisers, and investors. The study meticulously segments the market by application (Commercial, Institutional, Infrastructure, Industrial) and product type (Below 32 inch, Between 32 and 52 inches, Above 52 inch). With a focus on high-traffic keywords like "outdoor LED displays," "digital billboards," "public display screens," and "digital signage solutions," this report aims to enhance search visibility and provide a definitive resource for understanding the dynamic outdoor digital signage industry.
Outdoor Digital Signage Market Concentration & Innovation
The outdoor digital signage market exhibits a moderate to high concentration, with leading players like Samsung, LG, and Sharp holding significant market shares. Innovation is a key differentiator, driven by advancements in LED technology, high-brightness displays, and integrated software solutions for content management and analytics. Regulatory frameworks, particularly concerning public safety, advertising content, and environmental impact, play a crucial role in shaping market entry and product development. The threat of product substitutes, while present from traditional static signage, is diminishing as the benefits of dynamic content and interactivity become more apparent. End-user trends are increasingly favoring integrated solutions that offer seamless deployment and remote management. Merger and acquisition (M&A) activities, estimated to be in the range of several hundred million dollars annually, are consolidating market share and fostering technological integration, with significant deals expected to continue throughout the forecast period. Key innovation drivers include the demand for energy-efficient displays, enhanced durability against environmental factors, and the integration of AI for personalized content delivery. The market's focus on innovation is directly linked to increasing adoption across various sectors, seeking to enhance customer engagement and operational efficiency.
Outdoor Digital Signage Industry Trends & Insights
The global outdoor digital signage market is experiencing robust growth, projected to achieve a compound annual growth rate (CAGR) of approximately xx percent from 2025 to 2033. This expansion is propelled by a confluence of factors, including the escalating demand for captivating advertising mediums, the increasing digitization of public spaces, and the inherent advantages of digital displays over traditional static formats. Technological disruptions are at the forefront, with continuous improvements in LED brightness, resolution, and energy efficiency making outdoor digital signage more viable and cost-effective. The integration of Internet of Things (IoT) capabilities and artificial intelligence (AI) is further revolutionizing the sector, enabling dynamic content adaptation based on real-time data, audience demographics, and environmental conditions. Consumer preferences are shifting towards immersive and interactive experiences, with outdoor digital signage offering unparalleled potential for engagement through touchscreens, augmented reality (AR) overlays, and personalized content delivery. Market penetration is steadily increasing across various verticals, including retail, transportation, and entertainment, as businesses recognize the power of outdoor digital displays to attract attention, convey vital information, and drive sales. Competitive dynamics are intense, characterized by fierce competition among established global brands and emerging regional players, fostering a culture of continuous innovation and strategic partnerships to capture market share. The increasing adoption of programmatic advertising for digital out-of-home (DOOH) media further fuels market growth by enhancing targeting capabilities and ROI for advertisers.
Dominant Markets & Segments in Outdoor Digital Signage
The Commercial segment consistently dominates the outdoor digital signage market, driven by its widespread application in retail, quick-service restaurants, and entertainment venues. The demand for vibrant, attention-grabbing displays to promote products, enhance customer experiences, and drive foot traffic is paramount. Economic policies encouraging business growth and consumer spending directly correlate with increased investment in commercial signage solutions. Infrastructure development, particularly in urban centers, also plays a significant role, with digital billboards and public display screens becoming integral to cityscapes.
Within product types, displays Above 52 inch command the largest market share due to their impact and visibility in outdoor environments. These large-format displays are ideal for delivering impactful messages across wider audiences, making them a preferred choice for major advertising campaigns and public information systems. The continued decrease in the cost of large-format LED panels and advancements in their resolution and brightness further solidify their dominance.
North America currently leads as the dominant region, fueled by a mature advertising market, significant investment in smart city initiatives, and a high concentration of major outdoor digital signage manufacturers and adopters. The United States, in particular, showcases high market penetration due to extensive advertising budgets and widespread adoption across commercial and infrastructure sectors.
Key drivers for the dominance of these segments include:
- Commercial: High return on investment (ROI) through increased sales and brand visibility.
- Above 52 inch: Superior visual impact and broader audience reach.
- North America: Favorable regulatory environments, strong economic performance, and advanced technological adoption.
- Infrastructure Applications: Government initiatives for smart cities, public transportation upgrades, and safety information dissemination.
Outdoor Digital Signage Product Developments
Recent product developments in outdoor digital signage are characterized by an increased focus on enhanced durability, energy efficiency, and smart functionalities. Manufacturers are incorporating advanced weatherproofing technologies, ensuring resilience against extreme temperatures, humidity, and UV exposure. Innovations in high-brightness LED panels and anti-glare coatings improve visibility even in direct sunlight. Furthermore, the integration of AI-powered content management systems and IoT sensors allows for dynamic content optimization, real-time performance monitoring, and personalized advertising. These advancements offer significant competitive advantages by reducing maintenance costs, increasing operational efficiency, and delivering more impactful customer engagement.
Report Scope & Segmentation Analysis
This report encompasses a comprehensive segmentation of the outdoor digital signage market. The Commercial segment is projected to exhibit strong growth, driven by retail and entertainment sectors. Institutional applications, including schools and government buildings, are expected to see steady adoption for public announcements and information dissemination. The Infrastructure segment, encompassing transportation hubs and public spaces, will witness significant expansion due to smart city initiatives and an increasing need for real-time information. The Industrial segment, though smaller, presents opportunities in factories and construction sites for safety and operational communication. In terms of size, displays Below 32 inch are gaining traction for niche applications, while Between 32 and 52 inches offer a versatile balance. The Above 52 inch segment will continue to lead in terms of market share, owing to their impactful visual presence.
Key Drivers of Outdoor Digital Signage Growth
Several key factors are driving the growth of the outdoor digital signage market. Technologically, advancements in LED displays, including higher brightness, better resolution, and increased energy efficiency, make these solutions more attractive and cost-effective. Economically, the growing global advertising expenditure, particularly in out-of-home (OOH) media, fuels demand for dynamic and engaging display solutions. Regulatory factors, such as government initiatives for smart cities and urban development, are creating new deployment opportunities. Furthermore, the increasing need for real-time information dissemination in public spaces, coupled with the desire for enhanced customer engagement and brand visibility across sectors like retail, transportation, and entertainment, are significant growth catalysts.
Challenges in the Outdoor Digital Signage Sector
Despite its robust growth, the outdoor digital signage sector faces several challenges. Regulatory hurdles, including stringent advertising guidelines and local zoning laws, can impede deployment in certain areas. High initial investment costs for premium digital displays and installation can be a barrier for smaller businesses. Supply chain disruptions and the cost of raw materials, particularly for LED components, can impact pricing and availability. Intense competition among manufacturers and the rapid pace of technological obsolescence necessitate continuous innovation, which can be resource-intensive. Additionally, ensuring content relevance and managing diverse advertising campaigns across numerous screens presents operational complexities for many organizations.
Emerging Opportunities in Outdoor Digital Signage
Emerging opportunities in the outdoor digital signage market are abundant and diverse. The integration of AI and machine learning for predictive analytics and personalized content delivery presents a significant avenue for growth. The expansion of smart city initiatives globally creates demand for digital signage in public transportation, traffic management, and community information systems. The rise of programmatic advertising in the DOOH space allows for more targeted and efficient campaigns, attracting new advertisers. Furthermore, the increasing demand for interactive digital experiences, such as touchscreens and augmented reality integrations, opens up new engagement possibilities. Exploring niche applications in event management, tourism, and emergency communication also offers untapped potential.
Leading Players in the Outdoor Digital Signage Market
- Samsung
- LG
- Sharp
- Leyard
- Sony
Key Developments in Outdoor Digital Signage Industry
- 2023/08: Samsung launches new outdoor LED signage series with enhanced brightness and durability, targeting high-impact advertising.
- 2023/10: LG introduces AI-powered content management solutions for outdoor digital displays, enabling dynamic ad delivery.
- 2024/01: Leyard announces expansion of its transparent LED display capabilities for architectural integration in outdoor environments.
- 2024/03: Sharp showcases energy-efficient outdoor display technology at a major industry exhibition.
- 2024/06: Sony demonstrates advanced color reproduction technologies for outdoor digital billboards.
Strategic Outlook for Outdoor Digital Signage Market
The strategic outlook for the outdoor digital signage market remains highly positive, driven by ongoing technological advancements and increasing global demand for dynamic visual communication. Key growth catalysts include the continued expansion of smart city infrastructure, the growing adoption of DOOH advertising, and the integration of advanced features like AI and interactivity. Businesses across all sectors are recognizing the immense potential of outdoor digital signage to enhance brand visibility, drive customer engagement, and deliver measurable ROI. Strategic focus on developing more sustainable and energy-efficient solutions, alongside robust content management platforms, will be crucial for market leaders. The market is poised for sustained innovation and significant expansion in the coming years.
Outdoor Digital Signage Segmentation
-
1. Application
- 1.1. Commercial
- 1.2. Institutional
- 1.3. Infrastructure
- 1.4. Industrial
-
2. Types
- 2.1. Below 32 inch
- 2.2. Between 32 and 52 inches
- 2.3. Above 52 inch
Outdoor Digital Signage Segmentation By Geography
-
1. North America
- 1.1. United States
- 1.2. Canada
- 1.3. Mexico
-
2. South America
- 2.1. Brazil
- 2.2. Argentina
- 2.3. Rest of South America
-
3. Europe
- 3.1. United Kingdom
- 3.2. Germany
- 3.3. France
- 3.4. Italy
- 3.5. Spain
- 3.6. Russia
- 3.7. Benelux
- 3.8. Nordics
- 3.9. Rest of Europe
-
4. Middle East & Africa
- 4.1. Turkey
- 4.2. Israel
- 4.3. GCC
- 4.4. North Africa
- 4.5. South Africa
- 4.6. Rest of Middle East & Africa
-
5. Asia Pacific
- 5.1. China
- 5.2. India
- 5.3. Japan
- 5.4. South Korea
- 5.5. ASEAN
- 5.6. Oceania
- 5.7. Rest of Asia Pacific
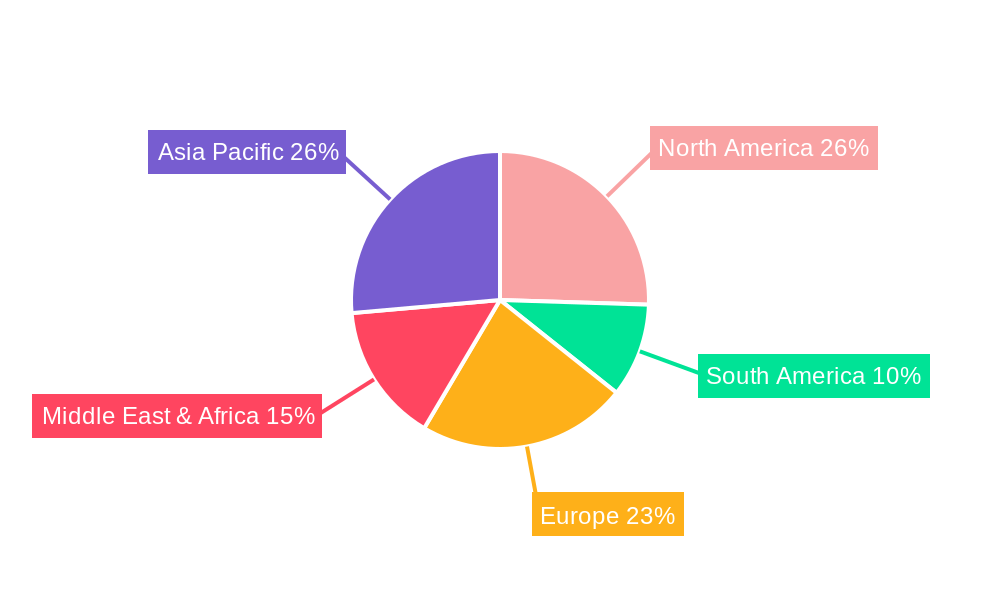
Outdoor Digital Signage Regional Market Share
Geographic Coverage of Outdoor Digital Signage
Outdoor Digital Signage REPORT HIGHLIGHTS
| Aspects | Details |
|---|---|
| Study Period | 2020-2034 |
| Base Year | 2025 |
| Estimated Year | 2026 |
| Forecast Period | 2026-2034 |
| Historical Period | 2020-2025 |
| Growth Rate | CAGR of 8% from 2020-2034 |
| Segmentation |
|
Table of Contents
- 1. Introduction
- 1.1. Research Scope
- 1.2. Market Segmentation
- 1.3. Research Objective
- 1.4. Definitions and Assumptions
- 2. Executive Summary
- 2.1. Market Snapshot
- 3. Market Dynamics
- 3.1. Market Drivers
- 3.2. Market Restrains
- 3.3. Market Trends
- 3.4. Market Opportunities
- 4. Market Factor Analysis
- 4.1. Porters Five Forces
- 4.1.1. Bargaining Power of Suppliers
- 4.1.2. Bargaining Power of Buyers
- 4.1.3. Threat of New Entrants
- 4.1.4. Threat of Substitutes
- 4.1.5. Competitive Rivalry
- 4.2. PESTEL analysis
- 4.3. BCG Analysis
- 4.3.1. Stars (High Growth, High Market Share)
- 4.3.2. Cash Cows (Low Growth, High Market Share)
- 4.3.3. Question Mark (High Growth, Low Market Share)
- 4.3.4. Dogs (Low Growth, Low Market Share)
- 4.4. Ansoff Matrix Analysis
- 4.5. Supply Chain Analysis
- 4.6. Regulatory Landscape
- 4.7. Current Market Potential and Opportunity Assessment (TAM–SAM–SOM Framework)
- 4.8. RAX Analyst Note
- 4.1. Porters Five Forces
- 5. Market Analysis, Insights and Forecast 2021-2033
- 5.1. Market Analysis, Insights and Forecast - by Application
- 5.1.1. Commercial
- 5.1.2. Institutional
- 5.1.3. Infrastructure
- 5.1.4. Industrial
- 5.2. Market Analysis, Insights and Forecast - by Types
- 5.2.1. Below 32 inch
- 5.2.2. Between 32 and 52 inches
- 5.2.3. Above 52 inch
- 5.3. Market Analysis, Insights and Forecast - by Region
- 5.3.1. North America
- 5.3.2. South America
- 5.3.3. Europe
- 5.3.4. Middle East & Africa
- 5.3.5. Asia Pacific
- 5.1. Market Analysis, Insights and Forecast - by Application
- 6. Global Outdoor Digital Signage Analysis, Insights and Forecast, 2021-2033
- 6.1. Market Analysis, Insights and Forecast - by Application
- 6.1.1. Commercial
- 6.1.2. Institutional
- 6.1.3. Infrastructure
- 6.1.4. Industrial
- 6.2. Market Analysis, Insights and Forecast - by Types
- 6.2.1. Below 32 inch
- 6.2.2. Between 32 and 52 inches
- 6.2.3. Above 52 inch
- 6.1. Market Analysis, Insights and Forecast - by Application
- 7. North America Outdoor Digital Signage Analysis, Insights and Forecast, 2020-2032
- 7.1. Market Analysis, Insights and Forecast - by Application
- 7.1.1. Commercial
- 7.1.2. Institutional
- 7.1.3. Infrastructure
- 7.1.4. Industrial
- 7.2. Market Analysis, Insights and Forecast - by Types
- 7.2.1. Below 32 inch
- 7.2.2. Between 32 and 52 inches
- 7.2.3. Above 52 inch
- 7.1. Market Analysis, Insights and Forecast - by Application
- 8. South America Outdoor Digital Signage Analysis, Insights and Forecast, 2020-2032
- 8.1. Market Analysis, Insights and Forecast - by Application
- 8.1.1. Commercial
- 8.1.2. Institutional
- 8.1.3. Infrastructure
- 8.1.4. Industrial
- 8.2. Market Analysis, Insights and Forecast - by Types
- 8.2.1. Below 32 inch
- 8.2.2. Between 32 and 52 inches
- 8.2.3. Above 52 inch
- 8.1. Market Analysis, Insights and Forecast - by Application
- 9. Europe Outdoor Digital Signage Analysis, Insights and Forecast, 2020-2032
- 9.1. Market Analysis, Insights and Forecast - by Application
- 9.1.1. Commercial
- 9.1.2. Institutional
- 9.1.3. Infrastructure
- 9.1.4. Industrial
- 9.2. Market Analysis, Insights and Forecast - by Types
- 9.2.1. Below 32 inch
- 9.2.2. Between 32 and 52 inches
- 9.2.3. Above 52 inch
- 9.1. Market Analysis, Insights and Forecast - by Application
- 10. Middle East & Africa Outdoor Digital Signage Analysis, Insights and Forecast, 2020-2032
- 10.1. Market Analysis, Insights and Forecast - by Application
- 10.1.1. Commercial
- 10.1.2. Institutional
- 10.1.3. Infrastructure
- 10.1.4. Industrial
- 10.2. Market Analysis, Insights and Forecast - by Types
- 10.2.1. Below 32 inch
- 10.2.2. Between 32 and 52 inches
- 10.2.3. Above 52 inch
- 10.1. Market Analysis, Insights and Forecast - by Application
- 11. Asia Pacific Outdoor Digital Signage Analysis, Insights and Forecast, 2020-2032
- 11.1. Market Analysis, Insights and Forecast - by Application
- 11.1.1. Commercial
- 11.1.2. Institutional
- 11.1.3. Infrastructure
- 11.1.4. Industrial
- 11.2. Market Analysis, Insights and Forecast - by Types
- 11.2.1. Below 32 inch
- 11.2.2. Between 32 and 52 inches
- 11.2.3. Above 52 inch
- 11.1. Market Analysis, Insights and Forecast - by Application
- 12. Competitive Analysis
- 12.1. Company Profiles
- 12.1.1 Samsung
- 12.1.1.1. Company Overview
- 12.1.1.2. Products
- 12.1.1.3. Company Financials
- 12.1.1.4. SWOT Analysis
- 12.1.2 LG
- 12.1.2.1. Company Overview
- 12.1.2.2. Products
- 12.1.2.3. Company Financials
- 12.1.2.4. SWOT Analysis
- 12.1.3 Sharp
- 12.1.3.1. Company Overview
- 12.1.3.2. Products
- 12.1.3.3. Company Financials
- 12.1.3.4. SWOT Analysis
- 12.1.4 Leyard
- 12.1.4.1. Company Overview
- 12.1.4.2. Products
- 12.1.4.3. Company Financials
- 12.1.4.4. SWOT Analysis
- 12.1.5 Sony
- 12.1.5.1. Company Overview
- 12.1.5.2. Products
- 12.1.5.3. Company Financials
- 12.1.5.4. SWOT Analysis
- 12.1.1 Samsung
- 12.2. Market Entropy
- 12.2.1 Company's Key Areas Served
- 12.2.2 Recent Developments
- 12.3. Company Market Share Analysis 2025
- 12.3.1 Top 5 Companies Market Share Analysis
- 12.3.2 Top 3 Companies Market Share Analysis
- 12.4. List of Potential Customers
- 13. Research Methodology
List of Figures
- Figure 1: Global Outdoor Digital Signage Revenue Breakdown (undefined, %) by Region 2025 & 2033
- Figure 2: Global Outdoor Digital Signage Volume Breakdown (K, %) by Region 2025 & 2033
- Figure 3: North America Outdoor Digital Signage Revenue (undefined), by Application 2025 & 2033
- Figure 4: North America Outdoor Digital Signage Volume (K), by Application 2025 & 2033
- Figure 5: North America Outdoor Digital Signage Revenue Share (%), by Application 2025 & 2033
- Figure 6: North America Outdoor Digital Signage Volume Share (%), by Application 2025 & 2033
- Figure 7: North America Outdoor Digital Signage Revenue (undefined), by Types 2025 & 2033
- Figure 8: North America Outdoor Digital Signage Volume (K), by Types 2025 & 2033
- Figure 9: North America Outdoor Digital Signage Revenue Share (%), by Types 2025 & 2033
- Figure 10: North America Outdoor Digital Signage Volume Share (%), by Types 2025 & 2033
- Figure 11: North America Outdoor Digital Signage Revenue (undefined), by Country 2025 & 2033
- Figure 12: North America Outdoor Digital Signage Volume (K), by Country 2025 & 2033
- Figure 13: North America Outdoor Digital Signage Revenue Share (%), by Country 2025 & 2033
- Figure 14: North America Outdoor Digital Signage Volume Share (%), by Country 2025 & 2033
- Figure 15: South America Outdoor Digital Signage Revenue (undefined), by Application 2025 & 2033
- Figure 16: South America Outdoor Digital Signage Volume (K), by Application 2025 & 2033
- Figure 17: South America Outdoor Digital Signage Revenue Share (%), by Application 2025 & 2033
- Figure 18: South America Outdoor Digital Signage Volume Share (%), by Application 2025 & 2033
- Figure 19: South America Outdoor Digital Signage Revenue (undefined), by Types 2025 & 2033
- Figure 20: South America Outdoor Digital Signage Volume (K), by Types 2025 & 2033
- Figure 21: South America Outdoor Digital Signage Revenue Share (%), by Types 2025 & 2033
- Figure 22: South America Outdoor Digital Signage Volume Share (%), by Types 2025 & 2033
- Figure 23: South America Outdoor Digital Signage Revenue (undefined), by Country 2025 & 2033
- Figure 24: South America Outdoor Digital Signage Volume (K), by Country 2025 & 2033
- Figure 25: South America Outdoor Digital Signage Revenue Share (%), by Country 2025 & 2033
- Figure 26: South America Outdoor Digital Signage Volume Share (%), by Country 2025 & 2033
- Figure 27: Europe Outdoor Digital Signage Revenue (undefined), by Application 2025 & 2033
- Figure 28: Europe Outdoor Digital Signage Volume (K), by Application 2025 & 2033
- Figure 29: Europe Outdoor Digital Signage Revenue Share (%), by Application 2025 & 2033
- Figure 30: Europe Outdoor Digital Signage Volume Share (%), by Application 2025 & 2033
- Figure 31: Europe Outdoor Digital Signage Revenue (undefined), by Types 2025 & 2033
- Figure 32: Europe Outdoor Digital Signage Volume (K), by Types 2025 & 2033
- Figure 33: Europe Outdoor Digital Signage Revenue Share (%), by Types 2025 & 2033
- Figure 34: Europe Outdoor Digital Signage Volume Share (%), by Types 2025 & 2033
- Figure 35: Europe Outdoor Digital Signage Revenue (undefined), by Country 2025 & 2033
- Figure 36: Europe Outdoor Digital Signage Volume (K), by Country 2025 & 2033
- Figure 37: Europe Outdoor Digital Signage Revenue Share (%), by Country 2025 & 2033
- Figure 38: Europe Outdoor Digital Signage Volume Share (%), by Country 2025 & 2033
- Figure 39: Middle East & Africa Outdoor Digital Signage Revenue (undefined), by Application 2025 & 2033
- Figure 40: Middle East & Africa Outdoor Digital Signage Volume (K), by Application 2025 & 2033
- Figure 41: Middle East & Africa Outdoor Digital Signage Revenue Share (%), by Application 2025 & 2033
- Figure 42: Middle East & Africa Outdoor Digital Signage Volume Share (%), by Application 2025 & 2033
- Figure 43: Middle East & Africa Outdoor Digital Signage Revenue (undefined), by Types 2025 & 2033
- Figure 44: Middle East & Africa Outdoor Digital Signage Volume (K), by Types 2025 & 2033
- Figure 45: Middle East & Africa Outdoor Digital Signage Revenue Share (%), by Types 2025 & 2033
- Figure 46: Middle East & Africa Outdoor Digital Signage Volume Share (%), by Types 2025 & 2033
- Figure 47: Middle East & Africa Outdoor Digital Signage Revenue (undefined), by Country 2025 & 2033
- Figure 48: Middle East & Africa Outdoor Digital Signage Volume (K), by Country 2025 & 2033
- Figure 49: Middle East & Africa Outdoor Digital Signage Revenue Share (%), by Country 2025 & 2033
- Figure 50: Middle East & Africa Outdoor Digital Signage Volume Share (%), by Country 2025 & 2033
- Figure 51: Asia Pacific Outdoor Digital Signage Revenue (undefined), by Application 2025 & 2033
- Figure 52: Asia Pacific Outdoor Digital Signage Volume (K), by Application 2025 & 2033
- Figure 53: Asia Pacific Outdoor Digital Signage Revenue Share (%), by Application 2025 & 2033
- Figure 54: Asia Pacific Outdoor Digital Signage Volume Share (%), by Application 2025 & 2033
- Figure 55: Asia Pacific Outdoor Digital Signage Revenue (undefined), by Types 2025 & 2033
- Figure 56: Asia Pacific Outdoor Digital Signage Volume (K), by Types 2025 & 2033
- Figure 57: Asia Pacific Outdoor Digital Signage Revenue Share (%), by Types 2025 & 2033
- Figure 58: Asia Pacific Outdoor Digital Signage Volume Share (%), by Types 2025 & 2033
- Figure 59: Asia Pacific Outdoor Digital Signage Revenue (undefined), by Country 2025 & 2033
- Figure 60: Asia Pacific Outdoor Digital Signage Volume (K), by Country 2025 & 2033
- Figure 61: Asia Pacific Outdoor Digital Signage Revenue Share (%), by Country 2025 & 2033
- Figure 62: Asia Pacific Outdoor Digital Signage Volume Share (%), by Country 2025 & 2033
List of Tables
- Table 1: Global Outdoor Digital Signage Revenue undefined Forecast, by Application 2020 & 2033
- Table 2: Global Outdoor Digital Signage Volume K Forecast, by Application 2020 & 2033
- Table 3: Global Outdoor Digital Signage Revenue undefined Forecast, by Types 2020 & 2033
- Table 4: Global Outdoor Digital Signage Volume K Forecast, by Types 2020 & 2033
- Table 5: Global Outdoor Digital Signage Revenue undefined Forecast, by Region 2020 & 2033
- Table 6: Global Outdoor Digital Signage Volume K Forecast, by Region 2020 & 2033
- Table 7: Global Outdoor Digital Signage Revenue undefined Forecast, by Application 2020 & 2033
- Table 8: Global Outdoor Digital Signage Volume K Forecast, by Application 2020 & 2033
- Table 9: Global Outdoor Digital Signage Revenue undefined Forecast, by Types 2020 & 2033
- Table 10: Global Outdoor Digital Signage Volume K Forecast, by Types 2020 & 2033
- Table 11: Global Outdoor Digital Signage Revenue undefined Forecast, by Country 2020 & 2033
- Table 12: Global Outdoor Digital Signage Volume K Forecast, by Country 2020 & 2033
- Table 13: United States Outdoor Digital Signage Revenue (undefined) Forecast, by Application 2020 & 2033
- Table 14: United States Outdoor Digital Signage Volume (K) Forecast, by Application 2020 & 2033
- Table 15: Canada Outdoor Digital Signage Revenue (undefined) Forecast, by Application 2020 & 2033
- Table 16: Canada Outdoor Digital Signage Volume (K) Forecast, by Application 2020 & 2033
- Table 17: Mexico Outdoor Digital Signage Revenue (undefined) Forecast, by Application 2020 & 2033
- Table 18: Mexico Outdoor Digital Signage Volume (K) Forecast, by Application 2020 & 2033
- Table 19: Global Outdoor Digital Signage Revenue undefined Forecast, by Application 2020 & 2033
- Table 20: Global Outdoor Digital Signage Volume K Forecast, by Application 2020 & 2033
- Table 21: Global Outdoor Digital Signage Revenue undefined Forecast, by Types 2020 & 2033
- Table 22: Global Outdoor Digital Signage Volume K Forecast, by Types 2020 & 2033
- Table 23: Global Outdoor Digital Signage Revenue undefined Forecast, by Country 2020 & 2033
- Table 24: Global Outdoor Digital Signage Volume K Forecast, by Country 2020 & 2033
- Table 25: Brazil Outdoor Digital Signage Revenue (undefined) Forecast, by Application 2020 & 2033
- Table 26: Brazil Outdoor Digital Signage Volume (K) Forecast, by Application 2020 & 2033
- Table 27: Argentina Outdoor Digital Signage Revenue (undefined) Forecast, by Application 2020 & 2033
- Table 28: Argentina Outdoor Digital Signage Volume (K) Forecast, by Application 2020 & 2033
- Table 29: Rest of South America Outdoor Digital Signage Revenue (undefined) Forecast, by Application 2020 & 2033
- Table 30: Rest of South America Outdoor Digital Signage Volume (K) Forecast, by Application 2020 & 2033
- Table 31: Global Outdoor Digital Signage Revenue undefined Forecast, by Application 2020 & 2033
- Table 32: Global Outdoor Digital Signage Volume K Forecast, by Application 2020 & 2033
- Table 33: Global Outdoor Digital Signage Revenue undefined Forecast, by Types 2020 & 2033
- Table 34: Global Outdoor Digital Signage Volume K Forecast, by Types 2020 & 2033
- Table 35: Global Outdoor Digital Signage Revenue undefined Forecast, by Country 2020 & 2033
- Table 36: Global Outdoor Digital Signage Volume K Forecast, by Country 2020 & 2033
- Table 37: United Kingdom Outdoor Digital Signage Revenue (undefined) Forecast, by Application 2020 & 2033
- Table 38: United Kingdom Outdoor Digital Signage Volume (K) Forecast, by Application 2020 & 2033
- Table 39: Germany Outdoor Digital Signage Revenue (undefined) Forecast, by Application 2020 & 2033
- Table 40: Germany Outdoor Digital Signage Volume (K) Forecast, by Application 2020 & 2033
- Table 41: France Outdoor Digital Signage Revenue (undefined) Forecast, by Application 2020 & 2033
- Table 42: France Outdoor Digital Signage Volume (K) Forecast, by Application 2020 & 2033
- Table 43: Italy Outdoor Digital Signage Revenue (undefined) Forecast, by Application 2020 & 2033
- Table 44: Italy Outdoor Digital Signage Volume (K) Forecast, by Application 2020 & 2033
- Table 45: Spain Outdoor Digital Signage Revenue (undefined) Forecast, by Application 2020 & 2033
- Table 46: Spain Outdoor Digital Signage Volume (K) Forecast, by Application 2020 & 2033
- Table 47: Russia Outdoor Digital Signage Revenue (undefined) Forecast, by Application 2020 & 2033
- Table 48: Russia Outdoor Digital Signage Volume (K) Forecast, by Application 2020 & 2033
- Table 49: Benelux Outdoor Digital Signage Revenue (undefined) Forecast, by Application 2020 & 2033
- Table 50: Benelux Outdoor Digital Signage Volume (K) Forecast, by Application 2020 & 2033
- Table 51: Nordics Outdoor Digital Signage Revenue (undefined) Forecast, by Application 2020 & 2033
- Table 52: Nordics Outdoor Digital Signage Volume (K) Forecast, by Application 2020 & 2033
- Table 53: Rest of Europe Outdoor Digital Signage Revenue (undefined) Forecast, by Application 2020 & 2033
- Table 54: Rest of Europe Outdoor Digital Signage Volume (K) Forecast, by Application 2020 & 2033
- Table 55: Global Outdoor Digital Signage Revenue undefined Forecast, by Application 2020 & 2033
- Table 56: Global Outdoor Digital Signage Volume K Forecast, by Application 2020 & 2033
- Table 57: Global Outdoor Digital Signage Revenue undefined Forecast, by Types 2020 & 2033
- Table 58: Global Outdoor Digital Signage Volume K Forecast, by Types 2020 & 2033
- Table 59: Global Outdoor Digital Signage Revenue undefined Forecast, by Country 2020 & 2033
- Table 60: Global Outdoor Digital Signage Volume K Forecast, by Country 2020 & 2033
- Table 61: Turkey Outdoor Digital Signage Revenue (undefined) Forecast, by Application 2020 & 2033
- Table 62: Turkey Outdoor Digital Signage Volume (K) Forecast, by Application 2020 & 2033
- Table 63: Israel Outdoor Digital Signage Revenue (undefined) Forecast, by Application 2020 & 2033
- Table 64: Israel Outdoor Digital Signage Volume (K) Forecast, by Application 2020 & 2033
- Table 65: GCC Outdoor Digital Signage Revenue (undefined) Forecast, by Application 2020 & 2033
- Table 66: GCC Outdoor Digital Signage Volume (K) Forecast, by Application 2020 & 2033
- Table 67: North Africa Outdoor Digital Signage Revenue (undefined) Forecast, by Application 2020 & 2033
- Table 68: North Africa Outdoor Digital Signage Volume (K) Forecast, by Application 2020 & 2033
- Table 69: South Africa Outdoor Digital Signage Revenue (undefined) Forecast, by Application 2020 & 2033
- Table 70: South Africa Outdoor Digital Signage Volume (K) Forecast, by Application 2020 & 2033
- Table 71: Rest of Middle East & Africa Outdoor Digital Signage Revenue (undefined) Forecast, by Application 2020 & 2033
- Table 72: Rest of Middle East & Africa Outdoor Digital Signage Volume (K) Forecast, by Application 2020 & 2033
- Table 73: Global Outdoor Digital Signage Revenue undefined Forecast, by Application 2020 & 2033
- Table 74: Global Outdoor Digital Signage Volume K Forecast, by Application 2020 & 2033
- Table 75: Global Outdoor Digital Signage Revenue undefined Forecast, by Types 2020 & 2033
- Table 76: Global Outdoor Digital Signage Volume K Forecast, by Types 2020 & 2033
- Table 77: Global Outdoor Digital Signage Revenue undefined Forecast, by Country 2020 & 2033
- Table 78: Global Outdoor Digital Signage Volume K Forecast, by Country 2020 & 2033
- Table 79: China Outdoor Digital Signage Revenue (undefined) Forecast, by Application 2020 & 2033
- Table 80: China Outdoor Digital Signage Volume (K) Forecast, by Application 2020 & 2033
- Table 81: India Outdoor Digital Signage Revenue (undefined) Forecast, by Application 2020 & 2033
- Table 82: India Outdoor Digital Signage Volume (K) Forecast, by Application 2020 & 2033
- Table 83: Japan Outdoor Digital Signage Revenue (undefined) Forecast, by Application 2020 & 2033
- Table 84: Japan Outdoor Digital Signage Volume (K) Forecast, by Application 2020 & 2033
- Table 85: South Korea Outdoor Digital Signage Revenue (undefined) Forecast, by Application 2020 & 2033
- Table 86: South Korea Outdoor Digital Signage Volume (K) Forecast, by Application 2020 & 2033
- Table 87: ASEAN Outdoor Digital Signage Revenue (undefined) Forecast, by Application 2020 & 2033
- Table 88: ASEAN Outdoor Digital Signage Volume (K) Forecast, by Application 2020 & 2033
- Table 89: Oceania Outdoor Digital Signage Revenue (undefined) Forecast, by Application 2020 & 2033
- Table 90: Oceania Outdoor Digital Signage Volume (K) Forecast, by Application 2020 & 2033
- Table 91: Rest of Asia Pacific Outdoor Digital Signage Revenue (undefined) Forecast, by Application 2020 & 2033
- Table 92: Rest of Asia Pacific Outdoor Digital Signage Volume (K) Forecast, by Application 2020 & 2033
Frequently Asked Questions
1. What is the projected Compound Annual Growth Rate (CAGR) of the Outdoor Digital Signage?
The projected CAGR is approximately 8%.
2. Which companies are prominent players in the Outdoor Digital Signage?
Key companies in the market include Samsung, LG, Sharp, Leyard, Sony.
3. What are the main segments of the Outdoor Digital Signage?
The market segments include Application, Types.
4. Can you provide details about the market size?
The market size is estimated to be USD XXX N/A as of 2022.
5. What are some drivers contributing to market growth?
N/A
6. What are the notable trends driving market growth?
N/A
7. Are there any restraints impacting market growth?
N/A
8. Can you provide examples of recent developments in the market?
N/A
9. What pricing options are available for accessing the report?
Pricing options include single-user, multi-user, and enterprise licenses priced at USD 3350.00, USD 5025.00, and USD 6700.00 respectively.
10. Is the market size provided in terms of value or volume?
The market size is provided in terms of value, measured in N/A and volume, measured in K.
11. Are there any specific market keywords associated with the report?
Yes, the market keyword associated with the report is "Outdoor Digital Signage," which aids in identifying and referencing the specific market segment covered.
12. How do I determine which pricing option suits my needs best?
The pricing options vary based on user requirements and access needs. Individual users may opt for single-user licenses, while businesses requiring broader access may choose multi-user or enterprise licenses for cost-effective access to the report.
13. Are there any additional resources or data provided in the Outdoor Digital Signage report?
While the report offers comprehensive insights, it's advisable to review the specific contents or supplementary materials provided to ascertain if additional resources or data are available.
14. How can I stay updated on further developments or reports in the Outdoor Digital Signage?
To stay informed about further developments, trends, and reports in the Outdoor Digital Signage, consider subscribing to industry newsletters, following relevant companies and organizations, or regularly checking reputable industry news sources and publications.
Methodology
Step 1 - Identification of Relevant Samples Size from Population Database


Step 2 - Approaches for Defining Global Market Size (Value, Volume* & Price*)

Note*: In applicable scenarios
Step 3 - Data Sources
Primary Research
- Web Analytics
- Survey Reports
- Research Institute
- Latest Research Reports
- Opinion Leaders
Secondary Research
- Annual Reports
- White Paper
- Latest Press Release
- Industry Association
- Paid Database
- Investor Presentations

Step 4 - Data Triangulation
Involves using different sources of information in order to increase the validity of a study
These sources are likely to be stakeholders in a program - participants, other researchers, program staff, other community members, and so on.
Then we put all data in single framework & apply various statistical tools to find out the dynamic on the market.
During the analysis stage, feedback from the stakeholder groups would be compared to determine areas of agreement as well as areas of divergence