Key Insights
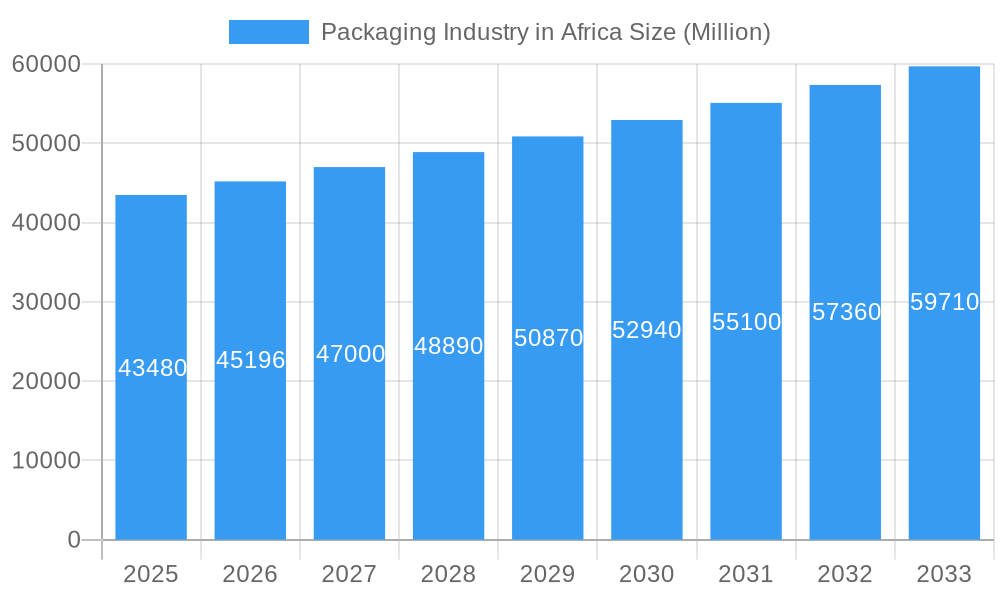
The African packaging industry, valued at $43.48 billion in 2025, is experiencing robust growth, projected to expand at a compound annual growth rate (CAGR) of 3.85% from 2025 to 2033. This expansion is fueled by several key drivers. A burgeoning population, rising disposable incomes, and the increasing adoption of packaged goods across various sectors – notably food and beverage, pharmaceuticals, and personal care – are significantly boosting demand. Furthermore, the growth of e-commerce and the associated need for efficient and safe product delivery are creating additional opportunities. The industry's segmentation reveals diverse opportunities. While plastic packaging remains dominant due to its cost-effectiveness and versatility, there's a growing interest in sustainable alternatives like paper and paperboard, driven by increasing environmental awareness and regulatory pressures. Regional variations exist, with South Africa, Nigeria, Kenya, and Egypt representing major markets, while other African nations demonstrate significant growth potential. Challenges include infrastructural limitations in certain regions and fluctuations in raw material prices, particularly for imported materials. However, the long-term outlook for the African packaging market remains positive, driven by sustained economic growth and evolving consumer preferences.
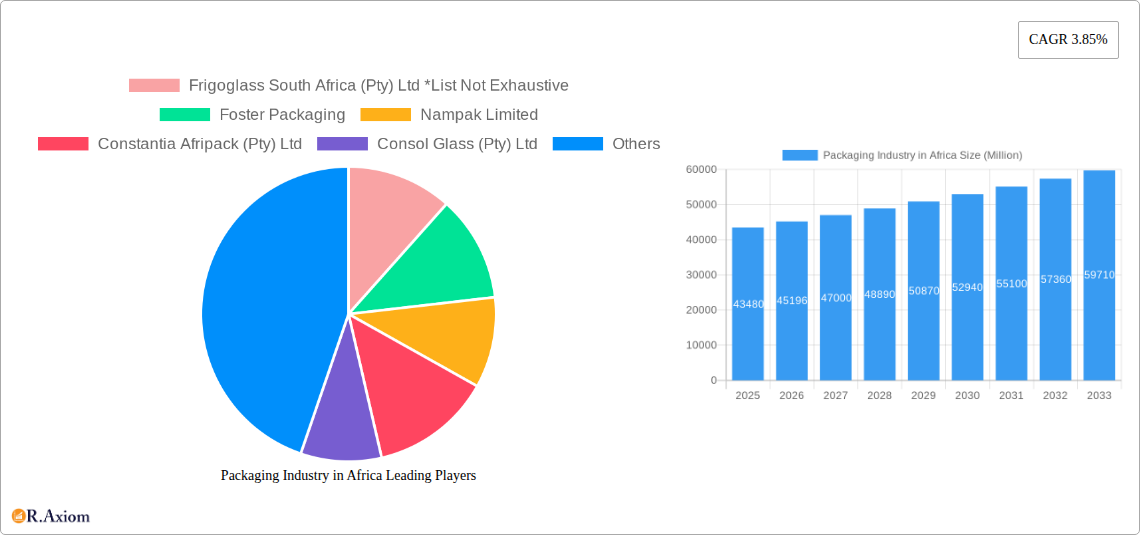
Packaging Industry in Africa Market Size (In Billion)
The leading players in the African packaging market – including Frigoglass South Africa, Foster Packaging, Nampak Limited, Constantia Afripack, Consol Glass, Mondi Group, Tetra Pak SA, Astrapak, East African Packaging Industries, Mpact Pty Ltd, and Bonpak – are strategically positioned to benefit from this expansion. Their success hinges on adapting to changing consumer needs, embracing sustainable practices, and investing in advanced technologies to enhance efficiency and product quality. This includes exploring innovative packaging solutions to meet the demands of the growing e-commerce sector and addressing the challenges posed by fluctuating raw material costs. The market's dynamic nature necessitates a keen focus on innovation, supply chain optimization, and strategic partnerships to effectively navigate the growth trajectory and address the evolving challenges within this rapidly expanding market.
Packaging Industry in Africa Company Market Share
Packaging Industry in Africa: A Comprehensive Market Report (2019-2033)
This comprehensive report provides an in-depth analysis of the Packaging Industry in Africa, covering market size, growth drivers, key players, and future trends. The study period spans from 2019 to 2033, with 2025 serving as the base and estimated year. The report offers invaluable insights for industry stakeholders, investors, and businesses seeking to navigate this dynamic market. With a focus on actionable intelligence and detailed segmentation, this report is an indispensable resource for understanding the current landscape and future potential of African packaging.
Packaging Industry in Africa Market Concentration & Innovation
This section analyzes the level of market concentration within the African packaging industry, identifying key players and their market share. Innovation drivers, regulatory landscapes, substitute products, end-user trends, and significant mergers & acquisitions (M&A) activities are also explored.
The African packaging market exhibits a moderate level of concentration, with a few large players holding significant market share, while numerous smaller companies cater to niche segments. Nampak Limited and Mpact Pty Ltd are among the leading players, collectively accounting for approximately xx% of the market share in 2025. However, the market is characterized by significant fragmentation, with numerous regional players competing across various segments.
Key Market Concentration Indicators (2025):
- Top 5 Players Market Share: xx%
- Average Market Share of Top 10 Players: xx%
- Number of Players: xx
Innovation Drivers:
- Growing demand for sustainable and eco-friendly packaging solutions.
- Advancements in packaging materials and technologies.
- Increasing focus on food safety and preservation.
Regulatory Framework:
- Varying regulatory standards across African countries impact packaging material choices and labeling requirements.
- Growing emphasis on waste management and recycling regulations.
M&A Activity: Significant M&A activity has been observed, notably the Ardagh Group's USD 1 Billion acquisition of Consol Holdings in 2022, highlighting the potential for consolidation in the sector. Further investments are expected, driving industry consolidation and influencing market dynamics. Total M&A deal value between 2019 and 2024 is estimated at USD xx Billion.
Packaging Industry in Africa Industry Trends & Insights
This section delves into the key trends shaping the African packaging industry, including market growth drivers, technological disruptions, consumer preferences, and competitive dynamics. The analysis utilizes comprehensive data and insights to provide a clear picture of the current and future landscape.
The African packaging market is experiencing robust growth, driven by factors such as rising population, increasing urbanization, and a growing middle class with changing consumption patterns. The market's Compound Annual Growth Rate (CAGR) during the forecast period (2025-2033) is estimated to be xx%, exceeding the global average. This growth is primarily fueled by the burgeoning food and beverage, pharmaceutical, and household & personal care sectors.
Key Growth Drivers:
- Rising Disposable Incomes: Increased purchasing power fuels demand for packaged goods across various sectors.
- Urbanization: Concentration of population in urban centers increases demand for convenient packaging.
- E-commerce Boom: Growth of online retail necessitates robust packaging solutions for efficient delivery.
- Government Initiatives: Investments in infrastructure and favorable economic policies further stimulate market expansion.
Technological Disruptions:
- Adoption of smart packaging technologies is gradually increasing.
- Automation and Industry 4.0 initiatives are improving efficiency and productivity.
- Use of lightweight materials and sustainable packaging options are gaining traction.
Market Penetration:
- The penetration rate of flexible packaging is high due to cost-effectiveness and versatility.
- Growth in demand for sustainable packaging materials is driving penetration of eco-friendly options.
Competitive Dynamics:
- Intense competition among both domestic and multinational companies for market share.
- Pricing strategies and product differentiation are crucial for success in this competitive market.
Dominant Markets & Segments in Packaging Industry in Africa
This section identifies the leading regions, countries, and segments within the African packaging market, providing a detailed analysis of their dominance factors. Specific drivers (economic policies, infrastructure development, rising consumerism, and technological adoption) are highlighted.
By Material:
- Plastic: Continues to be the dominant material due to its unparalleled versatility, cost-effectiveness, lightweight nature, and widespread availability across various applications. Innovations are focusing on enhancing its recyclability and incorporating bio-based alternatives.
- Paper and Paperboard: Maintains a significant share, primarily driven by the robust demand for corrugated boxes and cartons. This is particularly evident in the food and beverage sector for primary and secondary packaging, as well as in the burgeoning e-commerce industry.
- Metal: Holds a strong position, especially in the beverage sector with a consistent demand for aluminum and steel cans. Growth is also seen in canned food products, leveraging the material's durability and protective qualities.
- Glass: Demonstrates steady and growing demand, particularly in the food and beverage sector for products requiring premium presentation and inertness. While growth may be slower than plastics, its role in certain premium segments remains vital.
By Product Type:
- Plastic Bottles and Containers: Represent the largest segment, fueled by their extensive use in beverages, personal care products, household chemicals, and pharmaceuticals. Innovations are focusing on lighter designs and improved barrier properties.
- Corrugated Boxes and Cartons: Experience high demand, largely propelled by the growth of the food and beverage industry and the rapid expansion of e-commerce across the continent, necessitating efficient and protective shipping solutions.
- Metal Cans: Remain a dominant product type, particularly within the beverage industry for soft drinks, beer, and energy drinks, and also for certain food items.
- Flexible Packaging: Witnessing substantial growth due to its cost-effectiveness, convenience, and ability to provide excellent barrier properties. This is particularly prevalent in food packaging, sachets, and pouches.
By End-user Industry:
- Food & Beverage: The largest and most dynamic segment, accounting for a substantial portion (estimated to be over 50% in 2025) of the total market value. This is driven by a growing population, urbanization, and increasing disposable incomes leading to higher consumption of packaged goods.
- Pharmaceuticals: Shows consistent and robust growth, underpinned by increasing healthcare spending, a rising prevalence of chronic diseases, and a growing demand for safe and compliant packaging solutions to meet stricter regulatory requirements.
- Personal Care & Cosmetics: A significant and expanding segment driven by increasing disposable incomes and a growing middle class with a rising demand for beauty and hygiene products.
- Homecare: Another growing sector driven by the demand for cleaning products and household essentials, often packaged in plastic bottles and containers.
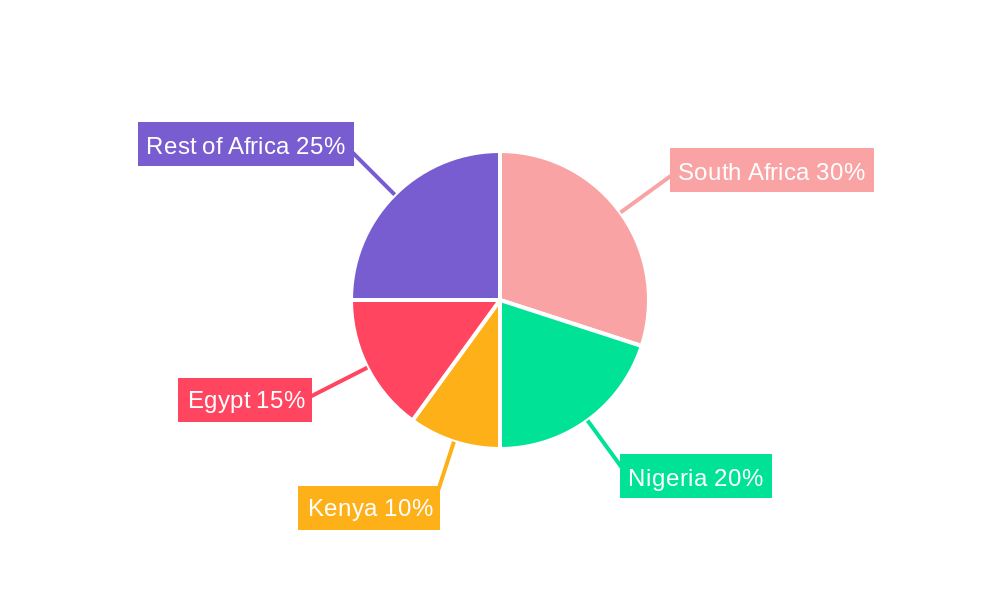
By Country:
- South Africa: Continues to be the largest national market, boasting established industrial infrastructure, high consumption levels, and advanced manufacturing capabilities. Its well-developed economy and sophisticated retail sector drive significant packaging demand.
- Egypt & Nigeria: Stand out as significant and rapidly growing markets, propelled by substantial population growth, a burgeoning middle class, and increasing urbanization which fuels demand for packaged consumer goods.
- Kenya: Displays promising and consistent growth, with an increasing demand for packaged goods across diverse sectors. This is supported by a thriving FMCG sector, a rising consumer awareness of branded products, and improving distribution networks.
- North Africa (excluding Egypt) & West Africa (excluding Nigeria): These regions collectively represent diverse and fragmented markets with considerable untapped growth potential, although challenges related to infrastructure development, logistics, and varying regulatory frameworks persist in many nations.
Rest of Africa: This vast and diverse region presents a fragmented market characterized by significant growth potential across various countries. However, challenges such as infrastructure deficits, complex logistics, and disparate regulatory environments in many nations continue to influence the pace and nature of market development.
Packaging Industry in Africa Product Developments
Product innovation in the African packaging market is intensely focused on developing sustainable, cost-effective, and highly functional packaging solutions tailored to the continent's unique logistical, economic, and environmental considerations. Key areas of development include the creation of lightweight materials to reduce transportation costs and carbon footprint, enhanced barrier properties to extend shelf life and minimize spoilage, and improved recyclability to address growing environmental concerns. A significant trend is the increasing integration of smart packaging technologies, encompassing features like QR codes for traceability, anti-counterfeiting measures, and interactive brand engagement elements. The market is also witnessing a notable surge in the adoption of flexible packaging solutions, appreciated for their cost efficiency, convenience, and suitability for a wide range of products, particularly within the food and beverage categories.
Report Scope & Segmentation Analysis
This report comprehensively segments the African packaging market by material (paper and paperboard, plastic, metal, glass), product type (plastic bottles, glass bottles, corrugated boxes, metal cans, other applications), end-user industry (beverage, food, pharmaceuticals, household and personal care, other), and country (Egypt, Nigeria, Kenya, South Africa, Rest of Africa). Each segment's growth projections, market sizes, and competitive dynamics are detailed, providing a granular understanding of the market. For example, the plastic segment is projected to maintain its dominant position driven by its versatility, while the paper and paperboard segment is experiencing growth due to increasing demand for eco-friendly alternatives.
Key Drivers of Packaging Industry in Africa Growth
The African packaging industry is propelled by several factors: the expanding consumer base due to population growth and rising disposable incomes, urbanization leading to increased demand for packaged goods, the rise of e-commerce boosting demand for logistics-friendly packaging, and governmental initiatives promoting economic growth and infrastructure development. Technological advancements such as automation and sustainable packaging solutions are also contributing to industry growth.
Challenges in the Packaging Industry in Africa Sector
The African packaging sector grapples with several persistent challenges. The inconsistent and often fragmented regulatory landscape across different countries creates significant complexities in ensuring compliance and adhering to varied standards, impacting market entry and operational efficiency. Supply chain inefficiencies, particularly in areas of logistics and transportation infrastructure, present substantial hurdles in ensuring timely and cost-effective delivery of raw materials and finished goods. Furthermore, intense competition, both from established domestic players and aggressive international entrants, exerts considerable pricing pressure, necessitating continuous innovation and operational optimization to maintain profitability. Fluctuations in the availability and cost of key raw materials also pose significant challenges to cost management and consistent production.
Emerging Opportunities in Packaging Industry in Africa
The African packaging market is ripe with emerging opportunities, particularly in the realm of sustainable packaging solutions. There is a rapidly growing demand for eco-friendly materials, including biodegradable plastics, compostable packaging, and recycled paperboard, as both consumers and regulators push for greener alternatives. Opportunities also abound in developing innovative packaging designs that are specifically tailored to the unique product requirements and consumer preferences of different regions and niche markets within Africa. Furthermore, the burgeoning e-commerce sector presents a significant avenue for growth in specialized e-commerce packaging solutions designed for resilience and optimized shipping. The increasing adoption of smart packaging technologies, offering enhanced traceability, security, and consumer engagement, also represents a key area for future development and investment.
Leading Players in the Packaging Industry in Africa Market
- Frigoglass South Africa (Pty) Ltd
- Foster Packaging
- Nampak Limited
- Constantia Afripack (Pty) Ltd
- Consol Glass (Pty) Ltd
- Mondi Group
- Tetra Pak SA
- Astrapak Ltd (RPC Group)
- East African Packaging Industries Ltd (EAPI)
- Mpact Pty Ltd
- Bonpak (Pty) Ltd
Key Developments in Packaging Industry in Africa Industry
- April 2022: Ardagh Group's acquisition of Consol Holdings Proprietary Limited for USD 1 Billion (including net debt), coupled with a planned USD 200 Million investment, significantly reshaped the South African glass packaging market and impacted other regions where Consol has a presence. This move indicates consolidation and strategic investment in key packaging segments.
- June 2022: Dow's expansion of its Project REFLEX flexible packaging recycling initiative to Egypt and Guinea, in collaboration with WasteAid, underscores the growing industry-wide commitment to advancing waste recovery and recycling efforts across the continent. This initiative highlights a critical focus on circular economy principles and environmental sustainability.
- Ongoing: Increased investment in local manufacturing capabilities and the adoption of advanced processing technologies by both domestic and international packaging companies are enhancing production efficiency and the availability of sophisticated packaging solutions across various African markets.
- Strategic Partnerships: A rise in strategic collaborations between raw material suppliers, packaging converters, and brand owners is facilitating the development and implementation of tailored packaging solutions, including those focused on sustainability and performance enhancement.
Strategic Outlook for Packaging Industry in Africa Market
The African packaging industry is poised for substantial growth in the coming years, driven by sustained economic expansion, rising consumer demand, and the increasing adoption of advanced packaging technologies. Opportunities exist for players to capitalize on the growing demand for sustainable, innovative, and cost-effective packaging solutions. Strategic partnerships, investments in infrastructure, and a focus on sustainability will be crucial for success in this dynamic market.
Packaging Industry in Africa Segmentation
-
1. Material
- 1.1. Paper and Paperboard
- 1.2. Plastic
- 1.3. Metal
- 1.4. Glass
-
2. Product Type
- 2.1. Plastic Bottles
- 2.2. Glass Bottles
- 2.3. Corrugated Boxes
- 2.4. Metal Cans
- 2.5. Other Applications
-
3. End-user Industry
- 3.1. Beverage
- 3.2. Food
- 3.3. Pharmaceuticals
- 3.4. Household and Personal Care
- 3.5. Other
Packaging Industry in Africa Segmentation By Geography
-
1. North America
- 1.1. United States
- 1.2. Canada
- 1.3. Mexico
-
2. South America
- 2.1. Brazil
- 2.2. Argentina
- 2.3. Rest of South America
-
3. Europe
- 3.1. United Kingdom
- 3.2. Germany
- 3.3. France
- 3.4. Italy
- 3.5. Spain
- 3.6. Russia
- 3.7. Benelux
- 3.8. Nordics
- 3.9. Rest of Europe
-
4. Middle East & Africa
- 4.1. Turkey
- 4.2. Israel
- 4.3. GCC
- 4.4. North Africa
- 4.5. South Africa
- 4.6. Rest of Middle East & Africa
-
5. Asia Pacific
- 5.1. China
- 5.2. India
- 5.3. Japan
- 5.4. South Korea
- 5.5. ASEAN
- 5.6. Oceania
- 5.7. Rest of Asia Pacific
Packaging Industry in Africa Regional Market Share
Geographic Coverage of Packaging Industry in Africa
Packaging Industry in Africa REPORT HIGHLIGHTS
| Aspects | Details |
|---|---|
| Study Period | 2020-2034 |
| Base Year | 2025 |
| Estimated Year | 2026 |
| Forecast Period | 2026-2034 |
| Historical Period | 2020-2025 |
| Growth Rate | CAGR of 3.85% from 2020-2034 |
| Segmentation |
|
Table of Contents
- 1. Introduction
- 1.1. Research Scope
- 1.2. Market Segmentation
- 1.3. Research Objective
- 1.4. Definitions and Assumptions
- 2. Executive Summary
- 2.1. Market Snapshot
- 3. Market Dynamics
- 3.1. Market Drivers
- 3.2. Market Restrains
- 3.3. Market Trends
- 3.4. Market Opportunities
- 4. Market Factor Analysis
- 4.1. Porters Five Forces
- 4.1.1. Bargaining Power of Suppliers
- 4.1.2. Bargaining Power of Buyers
- 4.1.3. Threat of New Entrants
- 4.1.4. Threat of Substitutes
- 4.1.5. Competitive Rivalry
- 4.2. PESTEL analysis
- 4.3. BCG Analysis
- 4.3.1. Stars (High Growth, High Market Share)
- 4.3.2. Cash Cows (Low Growth, High Market Share)
- 4.3.3. Question Mark (High Growth, Low Market Share)
- 4.3.4. Dogs (Low Growth, Low Market Share)
- 4.4. Ansoff Matrix Analysis
- 4.5. Supply Chain Analysis
- 4.6. Regulatory Landscape
- 4.7. Current Market Potential and Opportunity Assessment (TAM–SAM–SOM Framework)
- 4.8. RAX Analyst Note
- 4.1. Porters Five Forces
- 5. Market Analysis, Insights and Forecast 2021-2033
- 5.1. Market Analysis, Insights and Forecast - by Material
- 5.1.1. Paper and Paperboard
- 5.1.2. Plastic
- 5.1.3. Metal
- 5.1.4. Glass
- 5.2. Market Analysis, Insights and Forecast - by Product Type
- 5.2.1. Plastic Bottles
- 5.2.2. Glass Bottles
- 5.2.3. Corrugated Boxes
- 5.2.4. Metal Cans
- 5.2.5. Other Applications
- 5.3. Market Analysis, Insights and Forecast - by End-user Industry
- 5.3.1. Beverage
- 5.3.2. Food
- 5.3.3. Pharmaceuticals
- 5.3.4. Household and Personal Care
- 5.3.5. Other
- 5.4. Market Analysis, Insights and Forecast - by Region
- 5.4.1. North America
- 5.4.2. South America
- 5.4.3. Europe
- 5.4.4. Middle East & Africa
- 5.4.5. Asia Pacific
- 5.1. Market Analysis, Insights and Forecast - by Material
- 6. Global Packaging Industry in Africa Analysis, Insights and Forecast, 2021-2033
- 6.1. Market Analysis, Insights and Forecast - by Material
- 6.1.1. Paper and Paperboard
- 6.1.2. Plastic
- 6.1.3. Metal
- 6.1.4. Glass
- 6.2. Market Analysis, Insights and Forecast - by Product Type
- 6.2.1. Plastic Bottles
- 6.2.2. Glass Bottles
- 6.2.3. Corrugated Boxes
- 6.2.4. Metal Cans
- 6.2.5. Other Applications
- 6.3. Market Analysis, Insights and Forecast - by End-user Industry
- 6.3.1. Beverage
- 6.3.2. Food
- 6.3.3. Pharmaceuticals
- 6.3.4. Household and Personal Care
- 6.3.5. Other
- 6.1. Market Analysis, Insights and Forecast - by Material
- 7. North America Packaging Industry in Africa Analysis, Insights and Forecast, 2020-2032
- 7.1. Market Analysis, Insights and Forecast - by Material
- 7.1.1. Paper and Paperboard
- 7.1.2. Plastic
- 7.1.3. Metal
- 7.1.4. Glass
- 7.2. Market Analysis, Insights and Forecast - by Product Type
- 7.2.1. Plastic Bottles
- 7.2.2. Glass Bottles
- 7.2.3. Corrugated Boxes
- 7.2.4. Metal Cans
- 7.2.5. Other Applications
- 7.3. Market Analysis, Insights and Forecast - by End-user Industry
- 7.3.1. Beverage
- 7.3.2. Food
- 7.3.3. Pharmaceuticals
- 7.3.4. Household and Personal Care
- 7.3.5. Other
- 7.1. Market Analysis, Insights and Forecast - by Material
- 8. South America Packaging Industry in Africa Analysis, Insights and Forecast, 2020-2032
- 8.1. Market Analysis, Insights and Forecast - by Material
- 8.1.1. Paper and Paperboard
- 8.1.2. Plastic
- 8.1.3. Metal
- 8.1.4. Glass
- 8.2. Market Analysis, Insights and Forecast - by Product Type
- 8.2.1. Plastic Bottles
- 8.2.2. Glass Bottles
- 8.2.3. Corrugated Boxes
- 8.2.4. Metal Cans
- 8.2.5. Other Applications
- 8.3. Market Analysis, Insights and Forecast - by End-user Industry
- 8.3.1. Beverage
- 8.3.2. Food
- 8.3.3. Pharmaceuticals
- 8.3.4. Household and Personal Care
- 8.3.5. Other
- 8.1. Market Analysis, Insights and Forecast - by Material
- 9. Europe Packaging Industry in Africa Analysis, Insights and Forecast, 2020-2032
- 9.1. Market Analysis, Insights and Forecast - by Material
- 9.1.1. Paper and Paperboard
- 9.1.2. Plastic
- 9.1.3. Metal
- 9.1.4. Glass
- 9.2. Market Analysis, Insights and Forecast - by Product Type
- 9.2.1. Plastic Bottles
- 9.2.2. Glass Bottles
- 9.2.3. Corrugated Boxes
- 9.2.4. Metal Cans
- 9.2.5. Other Applications
- 9.3. Market Analysis, Insights and Forecast - by End-user Industry
- 9.3.1. Beverage
- 9.3.2. Food
- 9.3.3. Pharmaceuticals
- 9.3.4. Household and Personal Care
- 9.3.5. Other
- 9.1. Market Analysis, Insights and Forecast - by Material
- 10. Middle East & Africa Packaging Industry in Africa Analysis, Insights and Forecast, 2020-2032
- 10.1. Market Analysis, Insights and Forecast - by Material
- 10.1.1. Paper and Paperboard
- 10.1.2. Plastic
- 10.1.3. Metal
- 10.1.4. Glass
- 10.2. Market Analysis, Insights and Forecast - by Product Type
- 10.2.1. Plastic Bottles
- 10.2.2. Glass Bottles
- 10.2.3. Corrugated Boxes
- 10.2.4. Metal Cans
- 10.2.5. Other Applications
- 10.3. Market Analysis, Insights and Forecast - by End-user Industry
- 10.3.1. Beverage
- 10.3.2. Food
- 10.3.3. Pharmaceuticals
- 10.3.4. Household and Personal Care
- 10.3.5. Other
- 10.1. Market Analysis, Insights and Forecast - by Material
- 11. Asia Pacific Packaging Industry in Africa Analysis, Insights and Forecast, 2020-2032
- 11.1. Market Analysis, Insights and Forecast - by Material
- 11.1.1. Paper and Paperboard
- 11.1.2. Plastic
- 11.1.3. Metal
- 11.1.4. Glass
- 11.2. Market Analysis, Insights and Forecast - by Product Type
- 11.2.1. Plastic Bottles
- 11.2.2. Glass Bottles
- 11.2.3. Corrugated Boxes
- 11.2.4. Metal Cans
- 11.2.5. Other Applications
- 11.3. Market Analysis, Insights and Forecast - by End-user Industry
- 11.3.1. Beverage
- 11.3.2. Food
- 11.3.3. Pharmaceuticals
- 11.3.4. Household and Personal Care
- 11.3.5. Other
- 11.1. Market Analysis, Insights and Forecast - by Material
- 12. Competitive Analysis
- 12.1. Company Profiles
- 12.1.1 Frigoglass South Africa (Pty) Ltd *List Not Exhaustive
- 12.1.1.1. Company Overview
- 12.1.1.2. Products
- 12.1.1.3. Company Financials
- 12.1.1.4. SWOT Analysis
- 12.1.2 Foster Packaging
- 12.1.2.1. Company Overview
- 12.1.2.2. Products
- 12.1.2.3. Company Financials
- 12.1.2.4. SWOT Analysis
- 12.1.3 Nampak Limited
- 12.1.3.1. Company Overview
- 12.1.3.2. Products
- 12.1.3.3. Company Financials
- 12.1.3.4. SWOT Analysis
- 12.1.4 Constantia Afripack (Pty) Ltd
- 12.1.4.1. Company Overview
- 12.1.4.2. Products
- 12.1.4.3. Company Financials
- 12.1.4.4. SWOT Analysis
- 12.1.5 Consol Glass (Pty) Ltd
- 12.1.5.1. Company Overview
- 12.1.5.2. Products
- 12.1.5.3. Company Financials
- 12.1.5.4. SWOT Analysis
- 12.1.6 Mondi Group
- 12.1.6.1. Company Overview
- 12.1.6.2. Products
- 12.1.6.3. Company Financials
- 12.1.6.4. SWOT Analysis
- 12.1.7 Tetra Pak SA
- 12.1.7.1. Company Overview
- 12.1.7.2. Products
- 12.1.7.3. Company Financials
- 12.1.7.4. SWOT Analysis
- 12.1.8 Astrapak Ltd (RPC Group)
- 12.1.8.1. Company Overview
- 12.1.8.2. Products
- 12.1.8.3. Company Financials
- 12.1.8.4. SWOT Analysis
- 12.1.9 East African Packaging Industries Ltd (EAPI)
- 12.1.9.1. Company Overview
- 12.1.9.2. Products
- 12.1.9.3. Company Financials
- 12.1.9.4. SWOT Analysis
- 12.1.10 Mpact Pty Ltd
- 12.1.10.1. Company Overview
- 12.1.10.2. Products
- 12.1.10.3. Company Financials
- 12.1.10.4. SWOT Analysis
- 12.1.11 Bonpak (Pty) Ltd
- 12.1.11.1. Company Overview
- 12.1.11.2. Products
- 12.1.11.3. Company Financials
- 12.1.11.4. SWOT Analysis
- 12.1.1 Frigoglass South Africa (Pty) Ltd *List Not Exhaustive
- 12.2. Market Entropy
- 12.2.1 Company's Key Areas Served
- 12.2.2 Recent Developments
- 12.3. Company Market Share Analysis 2025
- 12.3.1 Top 5 Companies Market Share Analysis
- 12.3.2 Top 3 Companies Market Share Analysis
- 12.4. List of Potential Customers
- 13. Research Methodology
List of Figures
- Figure 1: Global Packaging Industry in Africa Revenue Breakdown (Million, %) by Region 2025 & 2033
- Figure 2: North America Packaging Industry in Africa Revenue (Million), by Material 2025 & 2033
- Figure 3: North America Packaging Industry in Africa Revenue Share (%), by Material 2025 & 2033
- Figure 4: North America Packaging Industry in Africa Revenue (Million), by Product Type 2025 & 2033
- Figure 5: North America Packaging Industry in Africa Revenue Share (%), by Product Type 2025 & 2033
- Figure 6: North America Packaging Industry in Africa Revenue (Million), by End-user Industry 2025 & 2033
- Figure 7: North America Packaging Industry in Africa Revenue Share (%), by End-user Industry 2025 & 2033
- Figure 8: North America Packaging Industry in Africa Revenue (Million), by Country 2025 & 2033
- Figure 9: North America Packaging Industry in Africa Revenue Share (%), by Country 2025 & 2033
- Figure 10: South America Packaging Industry in Africa Revenue (Million), by Material 2025 & 2033
- Figure 11: South America Packaging Industry in Africa Revenue Share (%), by Material 2025 & 2033
- Figure 12: South America Packaging Industry in Africa Revenue (Million), by Product Type 2025 & 2033
- Figure 13: South America Packaging Industry in Africa Revenue Share (%), by Product Type 2025 & 2033
- Figure 14: South America Packaging Industry in Africa Revenue (Million), by End-user Industry 2025 & 2033
- Figure 15: South America Packaging Industry in Africa Revenue Share (%), by End-user Industry 2025 & 2033
- Figure 16: South America Packaging Industry in Africa Revenue (Million), by Country 2025 & 2033
- Figure 17: South America Packaging Industry in Africa Revenue Share (%), by Country 2025 & 2033
- Figure 18: Europe Packaging Industry in Africa Revenue (Million), by Material 2025 & 2033
- Figure 19: Europe Packaging Industry in Africa Revenue Share (%), by Material 2025 & 2033
- Figure 20: Europe Packaging Industry in Africa Revenue (Million), by Product Type 2025 & 2033
- Figure 21: Europe Packaging Industry in Africa Revenue Share (%), by Product Type 2025 & 2033
- Figure 22: Europe Packaging Industry in Africa Revenue (Million), by End-user Industry 2025 & 2033
- Figure 23: Europe Packaging Industry in Africa Revenue Share (%), by End-user Industry 2025 & 2033
- Figure 24: Europe Packaging Industry in Africa Revenue (Million), by Country 2025 & 2033
- Figure 25: Europe Packaging Industry in Africa Revenue Share (%), by Country 2025 & 2033
- Figure 26: Middle East & Africa Packaging Industry in Africa Revenue (Million), by Material 2025 & 2033
- Figure 27: Middle East & Africa Packaging Industry in Africa Revenue Share (%), by Material 2025 & 2033
- Figure 28: Middle East & Africa Packaging Industry in Africa Revenue (Million), by Product Type 2025 & 2033
- Figure 29: Middle East & Africa Packaging Industry in Africa Revenue Share (%), by Product Type 2025 & 2033
- Figure 30: Middle East & Africa Packaging Industry in Africa Revenue (Million), by End-user Industry 2025 & 2033
- Figure 31: Middle East & Africa Packaging Industry in Africa Revenue Share (%), by End-user Industry 2025 & 2033
- Figure 32: Middle East & Africa Packaging Industry in Africa Revenue (Million), by Country 2025 & 2033
- Figure 33: Middle East & Africa Packaging Industry in Africa Revenue Share (%), by Country 2025 & 2033
- Figure 34: Asia Pacific Packaging Industry in Africa Revenue (Million), by Material 2025 & 2033
- Figure 35: Asia Pacific Packaging Industry in Africa Revenue Share (%), by Material 2025 & 2033
- Figure 36: Asia Pacific Packaging Industry in Africa Revenue (Million), by Product Type 2025 & 2033
- Figure 37: Asia Pacific Packaging Industry in Africa Revenue Share (%), by Product Type 2025 & 2033
- Figure 38: Asia Pacific Packaging Industry in Africa Revenue (Million), by End-user Industry 2025 & 2033
- Figure 39: Asia Pacific Packaging Industry in Africa Revenue Share (%), by End-user Industry 2025 & 2033
- Figure 40: Asia Pacific Packaging Industry in Africa Revenue (Million), by Country 2025 & 2033
- Figure 41: Asia Pacific Packaging Industry in Africa Revenue Share (%), by Country 2025 & 2033
List of Tables
- Table 1: Global Packaging Industry in Africa Revenue Million Forecast, by Material 2020 & 2033
- Table 2: Global Packaging Industry in Africa Revenue Million Forecast, by Product Type 2020 & 2033
- Table 3: Global Packaging Industry in Africa Revenue Million Forecast, by End-user Industry 2020 & 2033
- Table 4: Global Packaging Industry in Africa Revenue Million Forecast, by Region 2020 & 2033
- Table 5: Global Packaging Industry in Africa Revenue Million Forecast, by Material 2020 & 2033
- Table 6: Global Packaging Industry in Africa Revenue Million Forecast, by Product Type 2020 & 2033
- Table 7: Global Packaging Industry in Africa Revenue Million Forecast, by End-user Industry 2020 & 2033
- Table 8: Global Packaging Industry in Africa Revenue Million Forecast, by Country 2020 & 2033
- Table 9: United States Packaging Industry in Africa Revenue (Million) Forecast, by Application 2020 & 2033
- Table 10: Canada Packaging Industry in Africa Revenue (Million) Forecast, by Application 2020 & 2033
- Table 11: Mexico Packaging Industry in Africa Revenue (Million) Forecast, by Application 2020 & 2033
- Table 12: Global Packaging Industry in Africa Revenue Million Forecast, by Material 2020 & 2033
- Table 13: Global Packaging Industry in Africa Revenue Million Forecast, by Product Type 2020 & 2033
- Table 14: Global Packaging Industry in Africa Revenue Million Forecast, by End-user Industry 2020 & 2033
- Table 15: Global Packaging Industry in Africa Revenue Million Forecast, by Country 2020 & 2033
- Table 16: Brazil Packaging Industry in Africa Revenue (Million) Forecast, by Application 2020 & 2033
- Table 17: Argentina Packaging Industry in Africa Revenue (Million) Forecast, by Application 2020 & 2033
- Table 18: Rest of South America Packaging Industry in Africa Revenue (Million) Forecast, by Application 2020 & 2033
- Table 19: Global Packaging Industry in Africa Revenue Million Forecast, by Material 2020 & 2033
- Table 20: Global Packaging Industry in Africa Revenue Million Forecast, by Product Type 2020 & 2033
- Table 21: Global Packaging Industry in Africa Revenue Million Forecast, by End-user Industry 2020 & 2033
- Table 22: Global Packaging Industry in Africa Revenue Million Forecast, by Country 2020 & 2033
- Table 23: United Kingdom Packaging Industry in Africa Revenue (Million) Forecast, by Application 2020 & 2033
- Table 24: Germany Packaging Industry in Africa Revenue (Million) Forecast, by Application 2020 & 2033
- Table 25: France Packaging Industry in Africa Revenue (Million) Forecast, by Application 2020 & 2033
- Table 26: Italy Packaging Industry in Africa Revenue (Million) Forecast, by Application 2020 & 2033
- Table 27: Spain Packaging Industry in Africa Revenue (Million) Forecast, by Application 2020 & 2033
- Table 28: Russia Packaging Industry in Africa Revenue (Million) Forecast, by Application 2020 & 2033
- Table 29: Benelux Packaging Industry in Africa Revenue (Million) Forecast, by Application 2020 & 2033
- Table 30: Nordics Packaging Industry in Africa Revenue (Million) Forecast, by Application 2020 & 2033
- Table 31: Rest of Europe Packaging Industry in Africa Revenue (Million) Forecast, by Application 2020 & 2033
- Table 32: Global Packaging Industry in Africa Revenue Million Forecast, by Material 2020 & 2033
- Table 33: Global Packaging Industry in Africa Revenue Million Forecast, by Product Type 2020 & 2033
- Table 34: Global Packaging Industry in Africa Revenue Million Forecast, by End-user Industry 2020 & 2033
- Table 35: Global Packaging Industry in Africa Revenue Million Forecast, by Country 2020 & 2033
- Table 36: Turkey Packaging Industry in Africa Revenue (Million) Forecast, by Application 2020 & 2033
- Table 37: Israel Packaging Industry in Africa Revenue (Million) Forecast, by Application 2020 & 2033
- Table 38: GCC Packaging Industry in Africa Revenue (Million) Forecast, by Application 2020 & 2033
- Table 39: North Africa Packaging Industry in Africa Revenue (Million) Forecast, by Application 2020 & 2033
- Table 40: South Africa Packaging Industry in Africa Revenue (Million) Forecast, by Application 2020 & 2033
- Table 41: Rest of Middle East & Africa Packaging Industry in Africa Revenue (Million) Forecast, by Application 2020 & 2033
- Table 42: Global Packaging Industry in Africa Revenue Million Forecast, by Material 2020 & 2033
- Table 43: Global Packaging Industry in Africa Revenue Million Forecast, by Product Type 2020 & 2033
- Table 44: Global Packaging Industry in Africa Revenue Million Forecast, by End-user Industry 2020 & 2033
- Table 45: Global Packaging Industry in Africa Revenue Million Forecast, by Country 2020 & 2033
- Table 46: China Packaging Industry in Africa Revenue (Million) Forecast, by Application 2020 & 2033
- Table 47: India Packaging Industry in Africa Revenue (Million) Forecast, by Application 2020 & 2033
- Table 48: Japan Packaging Industry in Africa Revenue (Million) Forecast, by Application 2020 & 2033
- Table 49: South Korea Packaging Industry in Africa Revenue (Million) Forecast, by Application 2020 & 2033
- Table 50: ASEAN Packaging Industry in Africa Revenue (Million) Forecast, by Application 2020 & 2033
- Table 51: Oceania Packaging Industry in Africa Revenue (Million) Forecast, by Application 2020 & 2033
- Table 52: Rest of Asia Pacific Packaging Industry in Africa Revenue (Million) Forecast, by Application 2020 & 2033
Frequently Asked Questions
1. What is the projected Compound Annual Growth Rate (CAGR) of the Packaging Industry in Africa?
The projected CAGR is approximately 3.85%.
2. Which companies are prominent players in the Packaging Industry in Africa?
Key companies in the market include Frigoglass South Africa (Pty) Ltd *List Not Exhaustive, Foster Packaging, Nampak Limited, Constantia Afripack (Pty) Ltd, Consol Glass (Pty) Ltd, Mondi Group, Tetra Pak SA, Astrapak Ltd (RPC Group), East African Packaging Industries Ltd (EAPI), Mpact Pty Ltd, Bonpak (Pty) Ltd.
3. What are the main segments of the Packaging Industry in Africa?
The market segments include Material, Product Type, End-user Industry.
4. Can you provide details about the market size?
The market size is estimated to be USD 43.48 Million as of 2022.
5. What are some drivers contributing to market growth?
Glass Bottles to Drive the Market Growth; Beverage Industry to Lead the Market Growth.
6. What are the notable trends driving market growth?
Glass Bottles to Drive the Market Growth.
7. Are there any restraints impacting market growth?
Fluctuation in Raw Material Price can Hinder the Growth of the Market..
8. Can you provide examples of recent developments in the market?
June 2022: Dow expanded the flexible packaging recycling initiative to new African markets. Dow announced that its flexible packaging recycling initiative, project REFLEX, will be expanded to Egypt and Guinea. The expansion of Project REFLEX into Egypt began in December 2021, with Dow entering an 18-month partnership with the international non-government organization, WasteAid, which shares waste management and recycling skills with lower- and middle-income countries. WasteAid will work with Dow to advance waste recovery and recycling in Aswan, a city located in southern Egypt.
9. What pricing options are available for accessing the report?
Pricing options include single-user, multi-user, and enterprise licenses priced at USD 4750, USD 5250, and USD 8750 respectively.
10. Is the market size provided in terms of value or volume?
The market size is provided in terms of value, measured in Million.
11. Are there any specific market keywords associated with the report?
Yes, the market keyword associated with the report is "Packaging Industry in Africa," which aids in identifying and referencing the specific market segment covered.
12. How do I determine which pricing option suits my needs best?
The pricing options vary based on user requirements and access needs. Individual users may opt for single-user licenses, while businesses requiring broader access may choose multi-user or enterprise licenses for cost-effective access to the report.
13. Are there any additional resources or data provided in the Packaging Industry in Africa report?
While the report offers comprehensive insights, it's advisable to review the specific contents or supplementary materials provided to ascertain if additional resources or data are available.
14. How can I stay updated on further developments or reports in the Packaging Industry in Africa?
To stay informed about further developments, trends, and reports in the Packaging Industry in Africa, consider subscribing to industry newsletters, following relevant companies and organizations, or regularly checking reputable industry news sources and publications.
Methodology
Step 1 - Identification of Relevant Samples Size from Population Database


Step 2 - Approaches for Defining Global Market Size (Value, Volume* & Price*)

Note*: In applicable scenarios
Step 3 - Data Sources
Primary Research
- Web Analytics
- Survey Reports
- Research Institute
- Latest Research Reports
- Opinion Leaders
Secondary Research
- Annual Reports
- White Paper
- Latest Press Release
- Industry Association
- Paid Database
- Investor Presentations

Step 4 - Data Triangulation
Involves using different sources of information in order to increase the validity of a study
These sources are likely to be stakeholders in a program - participants, other researchers, program staff, other community members, and so on.
Then we put all data in single framework & apply various statistical tools to find out the dynamic on the market.
During the analysis stage, feedback from the stakeholder groups would be compared to determine areas of agreement as well as areas of divergence

