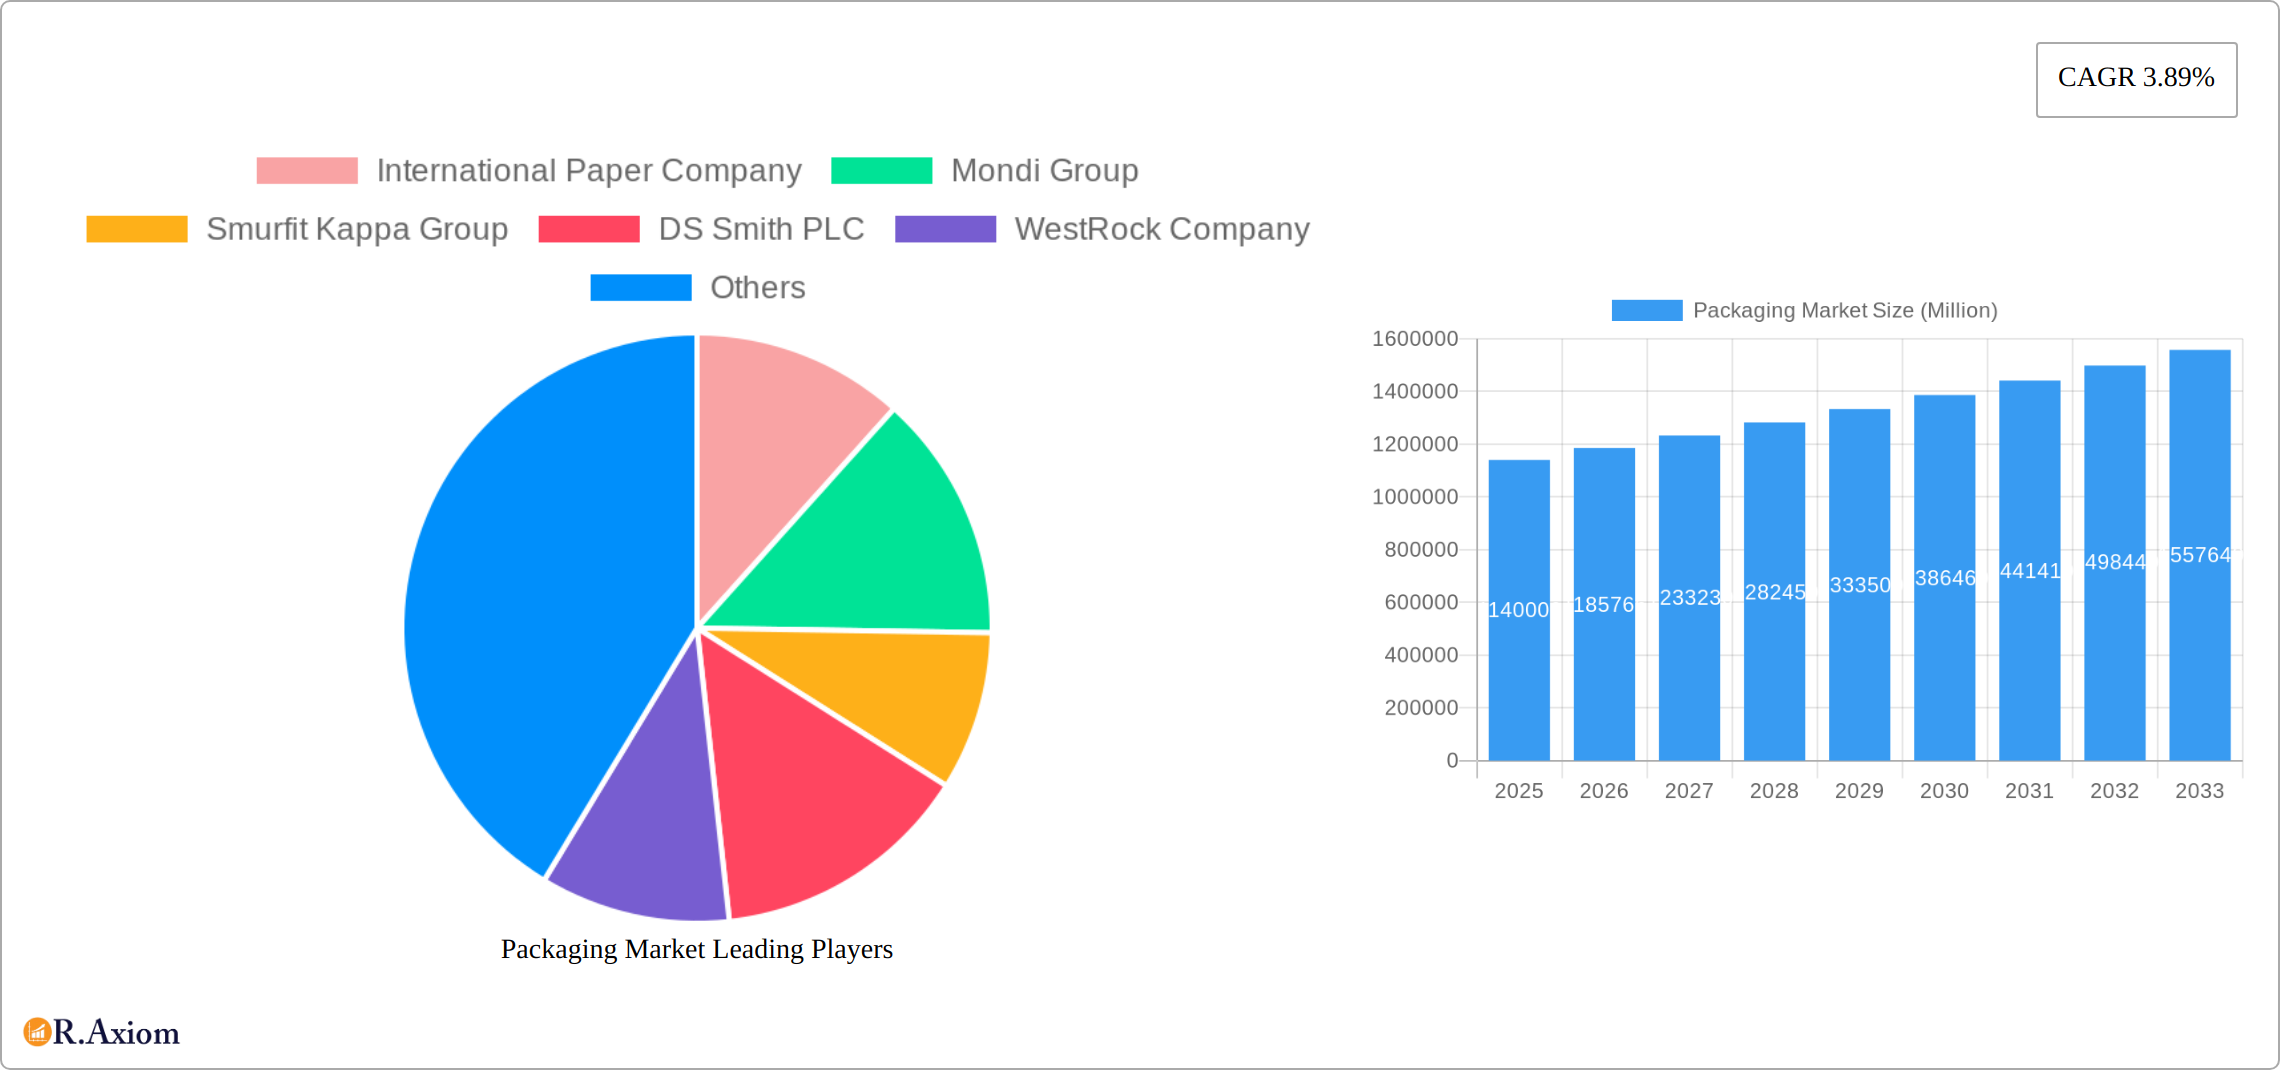
Key Insights
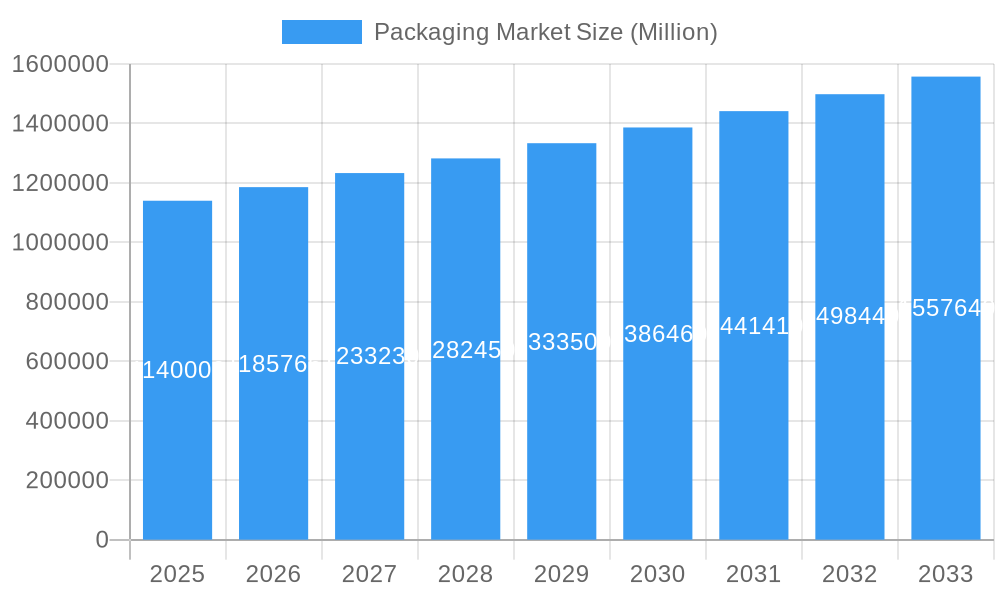
The global packaging market, valued at $1.14 trillion in 2025, is projected to experience robust growth, driven by a compound annual growth rate (CAGR) of 3.89% from 2025 to 2033. This expansion is fueled by several key factors. The e-commerce boom necessitates increased demand for protective and convenient packaging solutions. Simultaneously, the growing focus on sustainability is pushing manufacturers towards eco-friendly materials and designs, creating opportunities for biodegradable and recyclable packaging options. Furthermore, advancements in packaging technology, such as active and intelligent packaging, are enhancing product shelf life and improving consumer experience, thereby driving market growth. Increased disposable incomes in developing economies also contribute to higher consumption and packaging demand. However, fluctuating raw material prices and stringent environmental regulations pose potential challenges. The market is segmented by material type (paperboard, plastics, metals, etc.), packaging type (flexible, rigid), and end-use industry (food & beverage, pharmaceuticals, cosmetics, etc.). Leading players such as International Paper, Mondi Group, and Smurfit Kappa are strategically investing in innovation and expansion to maintain market share. This dynamic landscape indicates substantial growth potential for businesses involved in developing and supplying innovative, sustainable, and cost-effective packaging solutions across various sectors.
Packaging Market Market Size (In Million)
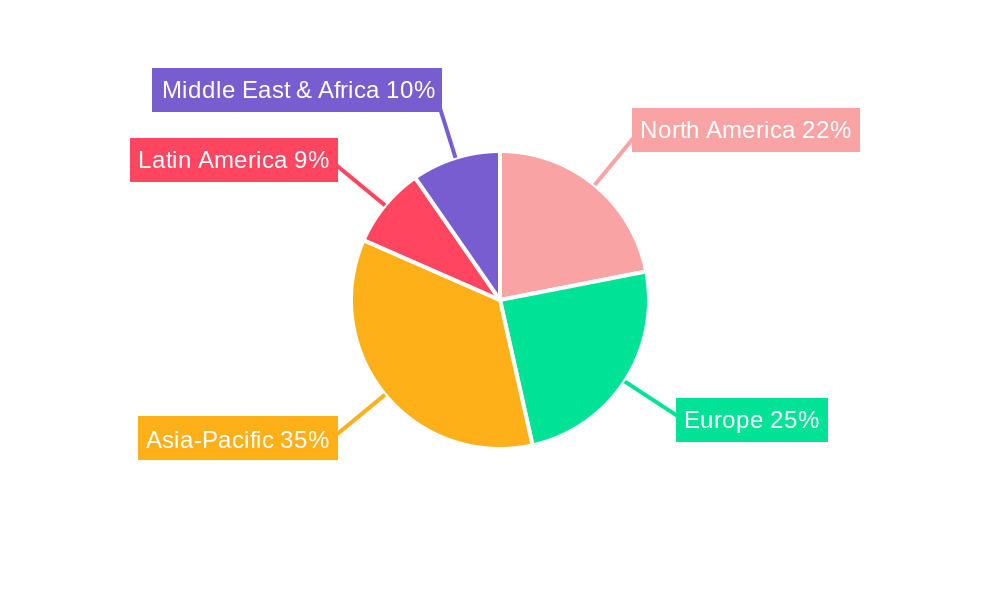
The competitive landscape is marked by both large multinational corporations and specialized regional players. These companies are actively engaged in mergers, acquisitions, and strategic partnerships to expand their market presence and product portfolio. The focus on sustainability is not merely a trend but a necessity, driving innovation in bio-based and recycled materials. Technological advancements continue to improve efficiency and reduce waste in packaging production. Regional variations in growth rates are expected, with developing economies in Asia-Pacific and Latin America projected to experience faster growth compared to more mature markets in North America and Europe. This will present unique opportunities for companies that can effectively navigate local regulations and consumer preferences. The long-term outlook remains positive, with continued growth predicated on consistent innovation and the ongoing demand for efficient and sustainable packaging solutions across all industries.
Packaging Market Company Market Share
This detailed report provides a comprehensive analysis of the global packaging market, encompassing market size, growth projections, key players, industry trends, and future outlook. The study period covers 2019-2033, with 2025 as the base year and forecast period spanning 2025-2033. The report utilizes data from the historical period of 2019-2024 and offers actionable insights for industry stakeholders. The report value is predicted to be xx Million.
Packaging Market Market Concentration & Innovation
The global packaging market presents a moderately consolidated landscape, dominated by several key players commanding significant market share. Industry giants such as International Paper Company, Mondi Group, Smurfit Kappa Group, and DS Smith PLC are among the leading companies, collectively accounting for an estimated [Insert Updated Percentage Here]% of the market in 2025. However, a vibrant ecosystem of smaller companies also contributes substantially, creating a fiercely competitive environment that fuels rapid innovation.
Market Concentration Metrics (2025 Estimates):
- Top 5 Players Market Share: [Insert Updated Percentage Here]%
- Top 10 Players Market Share: [Insert Updated Percentage Here]%
- Herfindahl-Hirschman Index (HHI): [Insert Updated HHI Value Here]
Innovation Drivers: A Multifaceted Approach
- Sustainable Packaging: The escalating demand for eco-conscious packaging solutions is a primary driver of innovation, fostering the development and adoption of biodegradable, compostable, and recycled materials. This trend is amplified by stricter environmental regulations and growing consumer awareness.
- E-commerce Boom and Enhanced Consumer Experience: The explosive growth of e-commerce necessitates innovative packaging designs that prioritize robust product protection during transit, while simultaneously elevating the unboxing experience to enhance customer satisfaction and brand loyalty.
- Technological Advancements: Smart and Efficient Packaging: Advancements in automation, digital printing, and smart packaging technologies are revolutionizing packaging production, enhancing efficiency, and unlocking new functionalities such as track-and-trace capabilities and improved product shelf life.
- Personalized and Customized Packaging: Consumers increasingly desire personalized and customized packaging experiences, driving demand for innovative printing techniques and on-demand packaging solutions.
Regulatory Landscape and Material Substitution:
Stringent environmental regulations worldwide are compelling companies to embrace sustainable practices. Bioplastics and other sustainable alternatives are gaining traction as substitutes for traditional materials, although they currently hold a relatively smaller market share. This is expected to change significantly in the coming years.
End-User Trends, M&A Activity, and Market Consolidation:
End-user preferences are evolving towards convenience, customization, and sustainability. The packaging industry has seen a surge in mergers and acquisitions (M&A) activity. Companies are actively seeking to expand their product portfolios, geographical reach, and technological capabilities through strategic acquisitions. The Sonoco Products Company's acquisition of Eviosys for USD 3.9 billion exemplifies this trend. The total value of M&A deals in the packaging sector from 2019-2024 is estimated at [Insert Updated Value Here] Million. This consolidation is likely to continue shaping the market landscape in the years to come.
Packaging Market Industry Trends & Insights
The global packaging market is experiencing robust growth, fueled by several key factors. The projected CAGR for the forecast period (2025-2033) is estimated at xx%. This growth is driven by rising consumer spending, expanding e-commerce, and increasing demand across diverse end-use sectors.
Market Growth Drivers:
- Rising Disposable Incomes: Increased purchasing power in developing economies boosts demand for packaged goods.
- E-commerce Growth: The exponential growth of online retail drives demand for protective and efficient packaging solutions.
- Food & Beverage Industry Expansion: The growing food and beverage sector is a major driver of packaging demand.
- Pharmaceutical and Healthcare Sector Growth: Increased healthcare spending is fueling demand for specialized packaging solutions.
Technological Disruptions:
- Automation and Robotics: Automation in packaging production increases efficiency and reduces costs.
- Smart Packaging: Integrated sensors and RFID technology are transforming packaging into intelligent systems.
- 3D Printing: 3D printing offers customization and on-demand packaging solutions.
Consumer Preferences:
Consumer preferences are increasingly shaped by sustainability concerns. Demand for recyclable, compostable, and biodegradable packaging is surging. Convenience and aesthetic appeal also significantly influence consumer choices.
Competitive Dynamics:
The market is characterized by intense competition among established players and emerging companies. Companies are focusing on innovation, brand building, and strategic acquisitions to gain a competitive edge. Market penetration by sustainable packaging solutions is steadily increasing, projected to reach xx% by 2033.
Dominant Markets & Segments in Packaging Market
The Asia-Pacific region is anticipated to dominate the global packaging market throughout the forecast period. This dominance is driven by rapid economic growth, increasing population, and rising consumer spending. China and India are key contributors to this regional dominance.
Key Drivers of Regional Dominance (Asia-Pacific):
- Rapid Economic Growth: High economic growth rates drive demand for packaged goods.
- Large and Growing Population: A vast population base fuels substantial demand for packaging across various sectors.
- Rising Disposable Incomes: Increasing disposable incomes enhance purchasing power and spending on packaged goods.
- Expanding E-commerce Sector: The burgeoning e-commerce market creates significant demand for shipping and packaging solutions.
- Government Support for Infrastructure Development: Investment in infrastructure improves supply chain efficiency and boosts the packaging industry.
Dominance Analysis:
While the Asia-Pacific region leads in overall market size, other regions like North America and Europe also exhibit considerable growth, driven by factors such as increasing demand for sustainable packaging and specialized solutions in specific sectors like pharmaceuticals and healthcare.
Packaging Market Product Developments
Recent product innovations focus on sustainable materials, enhanced functionality, and improved aesthetics. Bio-based plastics, recyclable paperboard, and compostable films are gaining traction. Smart packaging solutions integrating RFID and sensors are also emerging. These innovations enhance product protection, extend shelf life, and improve supply chain visibility. The competitive advantage lies in providing sustainable, innovative, and cost-effective packaging solutions that cater to evolving consumer preferences and meet regulatory requirements.
Report Scope & Segmentation Analysis
This report segments the packaging market based on material type (paper & paperboard, plastics, metals, glass, others), packaging type (flexible packaging, rigid packaging), end-use industry (food & beverage, pharmaceuticals, cosmetics & personal care, e-commerce, others), and region (North America, Europe, Asia-Pacific, Middle East & Africa, South America). Each segment is analyzed in detail, providing insights into growth projections, market size, and competitive dynamics. For example, the flexible packaging segment is anticipated to witness significant growth due to its cost-effectiveness and versatility. Similarly, the paper and paperboard segment is projected to expand due to increasing demand for sustainable options.
Key Drivers of Packaging Market Growth
Several factors drive the growth of the packaging market. Technological advancements, including automation and smart packaging, improve efficiency and enhance product appeal. Economic growth, particularly in developing economies, leads to increased consumer spending and demand for packaged goods. Stringent government regulations promoting sustainability are pushing manufacturers towards eco-friendly packaging solutions, further driving market growth. Moreover, the continuous expansion of the e-commerce sector necessitates robust packaging solutions to ensure product protection during shipping.
Challenges in the Packaging Market Sector
The packaging sector faces several challenges. Fluctuating raw material prices and supply chain disruptions impact profitability and production schedules. Meeting stringent environmental regulations and adhering to sustainability standards adds complexity to manufacturing processes. Intense competition from both established players and new entrants necessitates continuous innovation and cost optimization to maintain market share. These challenges translate to xx Million in potential lost revenue annually across the entire market.
Emerging Opportunities in Packaging Market
Several opportunities exist in the packaging market. The increasing demand for sustainable packaging creates opportunities for innovative and eco-friendly solutions. The growing e-commerce sector presents opportunities for developing customized packaging solutions optimized for online retail. Furthermore, advancements in smart packaging technology, like RFID and sensor integration, offer opportunities for enhancing product traceability, security, and consumer engagement. These trends offer a potential market expansion of xx Million over the next decade.
Leading Players in the Packaging Market Market
- International Paper Company
- Mondi Group
- Smurfit Kappa Group
- DS Smith PLC
- WestRock Company
- UFlex Limited
- Huhtamaki Oyj
- Amcor Group GmbH
- Coveris Holding SA
- Sealed Air Corporation
- Greif Inc
- Sonoco Products Company
- Aptar Group Inc
- Berry Global Group Inc
- Alpla Group
- Owens-illinois Inc
- Vidrala S A
- Verallia SA
- Gerresheimer AG
- Vitro S A B De C V
- Ball Corporation
- Crown Holdings Inc
- Ardagh Group S A
- Can Pack SA
- Silgan Holdings Inc
Key Developments in Packaging Market Industry
- June 2024: Sonoco Products Company's acquisition of Eviosys for USD 3.9 billion expands its presence in the European food can market.
- May 2024: Mondi's USD 216.45 million investment in a recycled containerboard machine in Italy demonstrates its commitment to sustainable packaging.
- April 2024: The UK's launch of CiPPPA signifies a growing focus on pharmaceutical packaging recycling and sustainability.
- April 2024: Berry Global Group Inc.'s 30% production capacity increase in Europe reflects growing demand for healthcare packaging solutions.
Strategic Outlook for Packaging Market Market
The packaging market is poised for sustained growth, driven by the convergence of technological advancements, evolving consumer preferences, and a growing focus on sustainability. Opportunities exist in developing innovative, eco-friendly, and smart packaging solutions that cater to the demands of various end-use sectors, particularly e-commerce and healthcare. Companies that successfully adapt to the changing landscape and prioritize sustainability will be well-positioned to capture significant market share and drive future growth.
Packaging Market Segmentation
- 1. Production Analysis
- 2. Consumption Analysis
- 3. Import Market Analysis (Value & Volume)
- 4. Export Market Analysis (Value & Volume)
- 5. Price Trend Analysis
Packaging Market Segmentation By Geography
-
1. North America
- 1.1. United States
- 1.2. Canada
- 1.3. Mexico
-
2. South America
- 2.1. Brazil
- 2.2. Argentina
- 2.3. Rest of South America
-
3. Europe
- 3.1. United Kingdom
- 3.2. Germany
- 3.3. France
- 3.4. Italy
- 3.5. Spain
- 3.6. Russia
- 3.7. Benelux
- 3.8. Nordics
- 3.9. Rest of Europe
-
4. Middle East & Africa
- 4.1. Turkey
- 4.2. Israel
- 4.3. GCC
- 4.4. North Africa
- 4.5. South Africa
- 4.6. Rest of Middle East & Africa
-
5. Asia Pacific
- 5.1. China
- 5.2. India
- 5.3. Japan
- 5.4. South Korea
- 5.5. ASEAN
- 5.6. Oceania
- 5.7. Rest of Asia Pacific
Packaging Market Regional Market Share
Geographic Coverage of Packaging Market
Packaging Market REPORT HIGHLIGHTS
| Aspects | Details |
|---|---|
| Study Period | 2020-2034 |
| Base Year | 2025 |
| Estimated Year | 2026 |
| Forecast Period | 2026-2034 |
| Historical Period | 2020-2025 |
| Growth Rate | CAGR of 3.89% from 2020-2034 |
| Segmentation |
|
Table of Contents
- 1. Introduction
- 1.1. Research Scope
- 1.2. Market Segmentation
- 1.3. Research Objective
- 1.4. Definitions and Assumptions
- 2. Executive Summary
- 2.1. Market Snapshot
- 3. Market Dynamics
- 3.1. Market Drivers
- 3.2. Market Restrains
- 3.3. Market Trends
- 3.4. Market Opportunities
- 4. Market Factor Analysis
- 4.1. Porters Five Forces
- 4.1.1. Bargaining Power of Suppliers
- 4.1.2. Bargaining Power of Buyers
- 4.1.3. Threat of New Entrants
- 4.1.4. Threat of Substitutes
- 4.1.5. Competitive Rivalry
- 4.2. PESTEL analysis
- 4.3. BCG Analysis
- 4.3.1. Stars (High Growth, High Market Share)
- 4.3.2. Cash Cows (Low Growth, High Market Share)
- 4.3.3. Question Mark (High Growth, Low Market Share)
- 4.3.4. Dogs (Low Growth, Low Market Share)
- 4.4. Ansoff Matrix Analysis
- 4.5. Supply Chain Analysis
- 4.6. Regulatory Landscape
- 4.7. Current Market Potential and Opportunity Assessment (TAM–SAM–SOM Framework)
- 4.8. RAX Analyst Note
- 4.1. Porters Five Forces
- 5. Market Analysis, Insights and Forecast 2021-2033
- 5.1. Market Analysis, Insights and Forecast - by Production Analysis
- 5.2. Market Analysis, Insights and Forecast - by Consumption Analysis
- 5.3. Market Analysis, Insights and Forecast - by Import Market Analysis (Value & Volume)
- 5.4. Market Analysis, Insights and Forecast - by Export Market Analysis (Value & Volume)
- 5.5. Market Analysis, Insights and Forecast - by Price Trend Analysis
- 5.6. Market Analysis, Insights and Forecast - by Region
- 5.6.1. North America
- 5.6.2. South America
- 5.6.3. Europe
- 5.6.4. Middle East & Africa
- 5.6.5. Asia Pacific
- 6. Global Packaging Market Analysis, Insights and Forecast, 2021-2033
- 6.1. Market Analysis, Insights and Forecast - by Production Analysis
- 6.2. Market Analysis, Insights and Forecast - by Consumption Analysis
- 6.3. Market Analysis, Insights and Forecast - by Import Market Analysis (Value & Volume)
- 6.4. Market Analysis, Insights and Forecast - by Export Market Analysis (Value & Volume)
- 6.5. Market Analysis, Insights and Forecast - by Price Trend Analysis
- 7. North America Packaging Market Analysis, Insights and Forecast, 2020-2032
- 7.1. Market Analysis, Insights and Forecast - by Production Analysis
- 7.2. Market Analysis, Insights and Forecast - by Consumption Analysis
- 7.3. Market Analysis, Insights and Forecast - by Import Market Analysis (Value & Volume)
- 7.4. Market Analysis, Insights and Forecast - by Export Market Analysis (Value & Volume)
- 7.5. Market Analysis, Insights and Forecast - by Price Trend Analysis
- 8. South America Packaging Market Analysis, Insights and Forecast, 2020-2032
- 8.1. Market Analysis, Insights and Forecast - by Production Analysis
- 8.2. Market Analysis, Insights and Forecast - by Consumption Analysis
- 8.3. Market Analysis, Insights and Forecast - by Import Market Analysis (Value & Volume)
- 8.4. Market Analysis, Insights and Forecast - by Export Market Analysis (Value & Volume)
- 8.5. Market Analysis, Insights and Forecast - by Price Trend Analysis
- 9. Europe Packaging Market Analysis, Insights and Forecast, 2020-2032
- 9.1. Market Analysis, Insights and Forecast - by Production Analysis
- 9.2. Market Analysis, Insights and Forecast - by Consumption Analysis
- 9.3. Market Analysis, Insights and Forecast - by Import Market Analysis (Value & Volume)
- 9.4. Market Analysis, Insights and Forecast - by Export Market Analysis (Value & Volume)
- 9.5. Market Analysis, Insights and Forecast - by Price Trend Analysis
- 10. Middle East & Africa Packaging Market Analysis, Insights and Forecast, 2020-2032
- 10.1. Market Analysis, Insights and Forecast - by Production Analysis
- 10.2. Market Analysis, Insights and Forecast - by Consumption Analysis
- 10.3. Market Analysis, Insights and Forecast - by Import Market Analysis (Value & Volume)
- 10.4. Market Analysis, Insights and Forecast - by Export Market Analysis (Value & Volume)
- 10.5. Market Analysis, Insights and Forecast - by Price Trend Analysis
- 11. Asia Pacific Packaging Market Analysis, Insights and Forecast, 2020-2032
- 11.1. Market Analysis, Insights and Forecast - by Production Analysis
- 11.2. Market Analysis, Insights and Forecast - by Consumption Analysis
- 11.3. Market Analysis, Insights and Forecast - by Import Market Analysis (Value & Volume)
- 11.4. Market Analysis, Insights and Forecast - by Export Market Analysis (Value & Volume)
- 11.5. Market Analysis, Insights and Forecast - by Price Trend Analysis
- 12. Competitive Analysis
- 12.1. Company Profiles
- 12.1.1 International Paper Company
- 12.1.1.1. Company Overview
- 12.1.1.2. Products
- 12.1.1.3. Company Financials
- 12.1.1.4. SWOT Analysis
- 12.1.2 Mondi Group
- 12.1.2.1. Company Overview
- 12.1.2.2. Products
- 12.1.2.3. Company Financials
- 12.1.2.4. SWOT Analysis
- 12.1.3 Smurfit Kappa Group
- 12.1.3.1. Company Overview
- 12.1.3.2. Products
- 12.1.3.3. Company Financials
- 12.1.3.4. SWOT Analysis
- 12.1.4 DS Smith PLC
- 12.1.4.1. Company Overview
- 12.1.4.2. Products
- 12.1.4.3. Company Financials
- 12.1.4.4. SWOT Analysis
- 12.1.5 WestRock Company
- 12.1.5.1. Company Overview
- 12.1.5.2. Products
- 12.1.5.3. Company Financials
- 12.1.5.4. SWOT Analysis
- 12.1.6 UFlex Limited
- 12.1.6.1. Company Overview
- 12.1.6.2. Products
- 12.1.6.3. Company Financials
- 12.1.6.4. SWOT Analysis
- 12.1.7 Huhtamaki Oyj
- 12.1.7.1. Company Overview
- 12.1.7.2. Products
- 12.1.7.3. Company Financials
- 12.1.7.4. SWOT Analysis
- 12.1.8 Amcor Group GmbH
- 12.1.8.1. Company Overview
- 12.1.8.2. Products
- 12.1.8.3. Company Financials
- 12.1.8.4. SWOT Analysis
- 12.1.9 Coveris Holding SA
- 12.1.9.1. Company Overview
- 12.1.9.2. Products
- 12.1.9.3. Company Financials
- 12.1.9.4. SWOT Analysis
- 12.1.10 Sealed Air Corporation
- 12.1.10.1. Company Overview
- 12.1.10.2. Products
- 12.1.10.3. Company Financials
- 12.1.10.4. SWOT Analysis
- 12.1.11 Greif Inc
- 12.1.11.1. Company Overview
- 12.1.11.2. Products
- 12.1.11.3. Company Financials
- 12.1.11.4. SWOT Analysis
- 12.1.12 Sonoco Products Company
- 12.1.12.1. Company Overview
- 12.1.12.2. Products
- 12.1.12.3. Company Financials
- 12.1.12.4. SWOT Analysis
- 12.1.13 Aptar Group Inc
- 12.1.13.1. Company Overview
- 12.1.13.2. Products
- 12.1.13.3. Company Financials
- 12.1.13.4. SWOT Analysis
- 12.1.14 Berry Global Group Inc
- 12.1.14.1. Company Overview
- 12.1.14.2. Products
- 12.1.14.3. Company Financials
- 12.1.14.4. SWOT Analysis
- 12.1.15 Alpla Group
- 12.1.15.1. Company Overview
- 12.1.15.2. Products
- 12.1.15.3. Company Financials
- 12.1.15.4. SWOT Analysis
- 12.1.16 Owens-illinois Inc
- 12.1.16.1. Company Overview
- 12.1.16.2. Products
- 12.1.16.3. Company Financials
- 12.1.16.4. SWOT Analysis
- 12.1.17 Vidrala S A
- 12.1.17.1. Company Overview
- 12.1.17.2. Products
- 12.1.17.3. Company Financials
- 12.1.17.4. SWOT Analysis
- 12.1.18 Verallia SA
- 12.1.18.1. Company Overview
- 12.1.18.2. Products
- 12.1.18.3. Company Financials
- 12.1.18.4. SWOT Analysis
- 12.1.19 Gerresheimer AG
- 12.1.19.1. Company Overview
- 12.1.19.2. Products
- 12.1.19.3. Company Financials
- 12.1.19.4. SWOT Analysis
- 12.1.20 Vitro S A B De C V
- 12.1.20.1. Company Overview
- 12.1.20.2. Products
- 12.1.20.3. Company Financials
- 12.1.20.4. SWOT Analysis
- 12.1.21 Ball Corporation
- 12.1.21.1. Company Overview
- 12.1.21.2. Products
- 12.1.21.3. Company Financials
- 12.1.21.4. SWOT Analysis
- 12.1.22 Crown Holdings Inc
- 12.1.22.1. Company Overview
- 12.1.22.2. Products
- 12.1.22.3. Company Financials
- 12.1.22.4. SWOT Analysis
- 12.1.23 Ardagh Group S A
- 12.1.23.1. Company Overview
- 12.1.23.2. Products
- 12.1.23.3. Company Financials
- 12.1.23.4. SWOT Analysis
- 12.1.24 Can Pack SA
- 12.1.24.1. Company Overview
- 12.1.24.2. Products
- 12.1.24.3. Company Financials
- 12.1.24.4. SWOT Analysis
- 12.1.25 Silgan Holdings Inc
- 12.1.25.1. Company Overview
- 12.1.25.2. Products
- 12.1.25.3. Company Financials
- 12.1.25.4. SWOT Analysis
- 12.1.1 International Paper Company
- 12.2. Market Entropy
- 12.2.1 Company's Key Areas Served
- 12.2.2 Recent Developments
- 12.3. Company Market Share Analysis 2025
- 12.3.1 Top 5 Companies Market Share Analysis
- 12.3.2 Top 3 Companies Market Share Analysis
- 12.4. List of Potential Customers
- 13. Research Methodology
List of Figures
- Figure 1: Global Packaging Market Revenue Breakdown (Million, %) by Region 2025 & 2033
- Figure 2: Global Packaging Market Volume Breakdown (Trillion, %) by Region 2025 & 2033
- Figure 3: North America Packaging Market Revenue (Million), by Production Analysis 2025 & 2033
- Figure 4: North America Packaging Market Volume (Trillion), by Production Analysis 2025 & 2033
- Figure 5: North America Packaging Market Revenue Share (%), by Production Analysis 2025 & 2033
- Figure 6: North America Packaging Market Volume Share (%), by Production Analysis 2025 & 2033
- Figure 7: North America Packaging Market Revenue (Million), by Consumption Analysis 2025 & 2033
- Figure 8: North America Packaging Market Volume (Trillion), by Consumption Analysis 2025 & 2033
- Figure 9: North America Packaging Market Revenue Share (%), by Consumption Analysis 2025 & 2033
- Figure 10: North America Packaging Market Volume Share (%), by Consumption Analysis 2025 & 2033
- Figure 11: North America Packaging Market Revenue (Million), by Import Market Analysis (Value & Volume) 2025 & 2033
- Figure 12: North America Packaging Market Volume (Trillion), by Import Market Analysis (Value & Volume) 2025 & 2033
- Figure 13: North America Packaging Market Revenue Share (%), by Import Market Analysis (Value & Volume) 2025 & 2033
- Figure 14: North America Packaging Market Volume Share (%), by Import Market Analysis (Value & Volume) 2025 & 2033
- Figure 15: North America Packaging Market Revenue (Million), by Export Market Analysis (Value & Volume) 2025 & 2033
- Figure 16: North America Packaging Market Volume (Trillion), by Export Market Analysis (Value & Volume) 2025 & 2033
- Figure 17: North America Packaging Market Revenue Share (%), by Export Market Analysis (Value & Volume) 2025 & 2033
- Figure 18: North America Packaging Market Volume Share (%), by Export Market Analysis (Value & Volume) 2025 & 2033
- Figure 19: North America Packaging Market Revenue (Million), by Price Trend Analysis 2025 & 2033
- Figure 20: North America Packaging Market Volume (Trillion), by Price Trend Analysis 2025 & 2033
- Figure 21: North America Packaging Market Revenue Share (%), by Price Trend Analysis 2025 & 2033
- Figure 22: North America Packaging Market Volume Share (%), by Price Trend Analysis 2025 & 2033
- Figure 23: North America Packaging Market Revenue (Million), by Country 2025 & 2033
- Figure 24: North America Packaging Market Volume (Trillion), by Country 2025 & 2033
- Figure 25: North America Packaging Market Revenue Share (%), by Country 2025 & 2033
- Figure 26: North America Packaging Market Volume Share (%), by Country 2025 & 2033
- Figure 27: South America Packaging Market Revenue (Million), by Production Analysis 2025 & 2033
- Figure 28: South America Packaging Market Volume (Trillion), by Production Analysis 2025 & 2033
- Figure 29: South America Packaging Market Revenue Share (%), by Production Analysis 2025 & 2033
- Figure 30: South America Packaging Market Volume Share (%), by Production Analysis 2025 & 2033
- Figure 31: South America Packaging Market Revenue (Million), by Consumption Analysis 2025 & 2033
- Figure 32: South America Packaging Market Volume (Trillion), by Consumption Analysis 2025 & 2033
- Figure 33: South America Packaging Market Revenue Share (%), by Consumption Analysis 2025 & 2033
- Figure 34: South America Packaging Market Volume Share (%), by Consumption Analysis 2025 & 2033
- Figure 35: South America Packaging Market Revenue (Million), by Import Market Analysis (Value & Volume) 2025 & 2033
- Figure 36: South America Packaging Market Volume (Trillion), by Import Market Analysis (Value & Volume) 2025 & 2033
- Figure 37: South America Packaging Market Revenue Share (%), by Import Market Analysis (Value & Volume) 2025 & 2033
- Figure 38: South America Packaging Market Volume Share (%), by Import Market Analysis (Value & Volume) 2025 & 2033
- Figure 39: South America Packaging Market Revenue (Million), by Export Market Analysis (Value & Volume) 2025 & 2033
- Figure 40: South America Packaging Market Volume (Trillion), by Export Market Analysis (Value & Volume) 2025 & 2033
- Figure 41: South America Packaging Market Revenue Share (%), by Export Market Analysis (Value & Volume) 2025 & 2033
- Figure 42: South America Packaging Market Volume Share (%), by Export Market Analysis (Value & Volume) 2025 & 2033
- Figure 43: South America Packaging Market Revenue (Million), by Price Trend Analysis 2025 & 2033
- Figure 44: South America Packaging Market Volume (Trillion), by Price Trend Analysis 2025 & 2033
- Figure 45: South America Packaging Market Revenue Share (%), by Price Trend Analysis 2025 & 2033
- Figure 46: South America Packaging Market Volume Share (%), by Price Trend Analysis 2025 & 2033
- Figure 47: South America Packaging Market Revenue (Million), by Country 2025 & 2033
- Figure 48: South America Packaging Market Volume (Trillion), by Country 2025 & 2033
- Figure 49: South America Packaging Market Revenue Share (%), by Country 2025 & 2033
- Figure 50: South America Packaging Market Volume Share (%), by Country 2025 & 2033
- Figure 51: Europe Packaging Market Revenue (Million), by Production Analysis 2025 & 2033
- Figure 52: Europe Packaging Market Volume (Trillion), by Production Analysis 2025 & 2033
- Figure 53: Europe Packaging Market Revenue Share (%), by Production Analysis 2025 & 2033
- Figure 54: Europe Packaging Market Volume Share (%), by Production Analysis 2025 & 2033
- Figure 55: Europe Packaging Market Revenue (Million), by Consumption Analysis 2025 & 2033
- Figure 56: Europe Packaging Market Volume (Trillion), by Consumption Analysis 2025 & 2033
- Figure 57: Europe Packaging Market Revenue Share (%), by Consumption Analysis 2025 & 2033
- Figure 58: Europe Packaging Market Volume Share (%), by Consumption Analysis 2025 & 2033
- Figure 59: Europe Packaging Market Revenue (Million), by Import Market Analysis (Value & Volume) 2025 & 2033
- Figure 60: Europe Packaging Market Volume (Trillion), by Import Market Analysis (Value & Volume) 2025 & 2033
- Figure 61: Europe Packaging Market Revenue Share (%), by Import Market Analysis (Value & Volume) 2025 & 2033
- Figure 62: Europe Packaging Market Volume Share (%), by Import Market Analysis (Value & Volume) 2025 & 2033
- Figure 63: Europe Packaging Market Revenue (Million), by Export Market Analysis (Value & Volume) 2025 & 2033
- Figure 64: Europe Packaging Market Volume (Trillion), by Export Market Analysis (Value & Volume) 2025 & 2033
- Figure 65: Europe Packaging Market Revenue Share (%), by Export Market Analysis (Value & Volume) 2025 & 2033
- Figure 66: Europe Packaging Market Volume Share (%), by Export Market Analysis (Value & Volume) 2025 & 2033
- Figure 67: Europe Packaging Market Revenue (Million), by Price Trend Analysis 2025 & 2033
- Figure 68: Europe Packaging Market Volume (Trillion), by Price Trend Analysis 2025 & 2033
- Figure 69: Europe Packaging Market Revenue Share (%), by Price Trend Analysis 2025 & 2033
- Figure 70: Europe Packaging Market Volume Share (%), by Price Trend Analysis 2025 & 2033
- Figure 71: Europe Packaging Market Revenue (Million), by Country 2025 & 2033
- Figure 72: Europe Packaging Market Volume (Trillion), by Country 2025 & 2033
- Figure 73: Europe Packaging Market Revenue Share (%), by Country 2025 & 2033
- Figure 74: Europe Packaging Market Volume Share (%), by Country 2025 & 2033
- Figure 75: Middle East & Africa Packaging Market Revenue (Million), by Production Analysis 2025 & 2033
- Figure 76: Middle East & Africa Packaging Market Volume (Trillion), by Production Analysis 2025 & 2033
- Figure 77: Middle East & Africa Packaging Market Revenue Share (%), by Production Analysis 2025 & 2033
- Figure 78: Middle East & Africa Packaging Market Volume Share (%), by Production Analysis 2025 & 2033
- Figure 79: Middle East & Africa Packaging Market Revenue (Million), by Consumption Analysis 2025 & 2033
- Figure 80: Middle East & Africa Packaging Market Volume (Trillion), by Consumption Analysis 2025 & 2033
- Figure 81: Middle East & Africa Packaging Market Revenue Share (%), by Consumption Analysis 2025 & 2033
- Figure 82: Middle East & Africa Packaging Market Volume Share (%), by Consumption Analysis 2025 & 2033
- Figure 83: Middle East & Africa Packaging Market Revenue (Million), by Import Market Analysis (Value & Volume) 2025 & 2033
- Figure 84: Middle East & Africa Packaging Market Volume (Trillion), by Import Market Analysis (Value & Volume) 2025 & 2033
- Figure 85: Middle East & Africa Packaging Market Revenue Share (%), by Import Market Analysis (Value & Volume) 2025 & 2033
- Figure 86: Middle East & Africa Packaging Market Volume Share (%), by Import Market Analysis (Value & Volume) 2025 & 2033
- Figure 87: Middle East & Africa Packaging Market Revenue (Million), by Export Market Analysis (Value & Volume) 2025 & 2033
- Figure 88: Middle East & Africa Packaging Market Volume (Trillion), by Export Market Analysis (Value & Volume) 2025 & 2033
- Figure 89: Middle East & Africa Packaging Market Revenue Share (%), by Export Market Analysis (Value & Volume) 2025 & 2033
- Figure 90: Middle East & Africa Packaging Market Volume Share (%), by Export Market Analysis (Value & Volume) 2025 & 2033
- Figure 91: Middle East & Africa Packaging Market Revenue (Million), by Price Trend Analysis 2025 & 2033
- Figure 92: Middle East & Africa Packaging Market Volume (Trillion), by Price Trend Analysis 2025 & 2033
- Figure 93: Middle East & Africa Packaging Market Revenue Share (%), by Price Trend Analysis 2025 & 2033
- Figure 94: Middle East & Africa Packaging Market Volume Share (%), by Price Trend Analysis 2025 & 2033
- Figure 95: Middle East & Africa Packaging Market Revenue (Million), by Country 2025 & 2033
- Figure 96: Middle East & Africa Packaging Market Volume (Trillion), by Country 2025 & 2033
- Figure 97: Middle East & Africa Packaging Market Revenue Share (%), by Country 2025 & 2033
- Figure 98: Middle East & Africa Packaging Market Volume Share (%), by Country 2025 & 2033
- Figure 99: Asia Pacific Packaging Market Revenue (Million), by Production Analysis 2025 & 2033
- Figure 100: Asia Pacific Packaging Market Volume (Trillion), by Production Analysis 2025 & 2033
- Figure 101: Asia Pacific Packaging Market Revenue Share (%), by Production Analysis 2025 & 2033
- Figure 102: Asia Pacific Packaging Market Volume Share (%), by Production Analysis 2025 & 2033
- Figure 103: Asia Pacific Packaging Market Revenue (Million), by Consumption Analysis 2025 & 2033
- Figure 104: Asia Pacific Packaging Market Volume (Trillion), by Consumption Analysis 2025 & 2033
- Figure 105: Asia Pacific Packaging Market Revenue Share (%), by Consumption Analysis 2025 & 2033
- Figure 106: Asia Pacific Packaging Market Volume Share (%), by Consumption Analysis 2025 & 2033
- Figure 107: Asia Pacific Packaging Market Revenue (Million), by Import Market Analysis (Value & Volume) 2025 & 2033
- Figure 108: Asia Pacific Packaging Market Volume (Trillion), by Import Market Analysis (Value & Volume) 2025 & 2033
- Figure 109: Asia Pacific Packaging Market Revenue Share (%), by Import Market Analysis (Value & Volume) 2025 & 2033
- Figure 110: Asia Pacific Packaging Market Volume Share (%), by Import Market Analysis (Value & Volume) 2025 & 2033
- Figure 111: Asia Pacific Packaging Market Revenue (Million), by Export Market Analysis (Value & Volume) 2025 & 2033
- Figure 112: Asia Pacific Packaging Market Volume (Trillion), by Export Market Analysis (Value & Volume) 2025 & 2033
- Figure 113: Asia Pacific Packaging Market Revenue Share (%), by Export Market Analysis (Value & Volume) 2025 & 2033
- Figure 114: Asia Pacific Packaging Market Volume Share (%), by Export Market Analysis (Value & Volume) 2025 & 2033
- Figure 115: Asia Pacific Packaging Market Revenue (Million), by Price Trend Analysis 2025 & 2033
- Figure 116: Asia Pacific Packaging Market Volume (Trillion), by Price Trend Analysis 2025 & 2033
- Figure 117: Asia Pacific Packaging Market Revenue Share (%), by Price Trend Analysis 2025 & 2033
- Figure 118: Asia Pacific Packaging Market Volume Share (%), by Price Trend Analysis 2025 & 2033
- Figure 119: Asia Pacific Packaging Market Revenue (Million), by Country 2025 & 2033
- Figure 120: Asia Pacific Packaging Market Volume (Trillion), by Country 2025 & 2033
- Figure 121: Asia Pacific Packaging Market Revenue Share (%), by Country 2025 & 2033
- Figure 122: Asia Pacific Packaging Market Volume Share (%), by Country 2025 & 2033
List of Tables
- Table 1: Global Packaging Market Revenue Million Forecast, by Production Analysis 2020 & 2033
- Table 2: Global Packaging Market Volume Trillion Forecast, by Production Analysis 2020 & 2033
- Table 3: Global Packaging Market Revenue Million Forecast, by Consumption Analysis 2020 & 2033
- Table 4: Global Packaging Market Volume Trillion Forecast, by Consumption Analysis 2020 & 2033
- Table 5: Global Packaging Market Revenue Million Forecast, by Import Market Analysis (Value & Volume) 2020 & 2033
- Table 6: Global Packaging Market Volume Trillion Forecast, by Import Market Analysis (Value & Volume) 2020 & 2033
- Table 7: Global Packaging Market Revenue Million Forecast, by Export Market Analysis (Value & Volume) 2020 & 2033
- Table 8: Global Packaging Market Volume Trillion Forecast, by Export Market Analysis (Value & Volume) 2020 & 2033
- Table 9: Global Packaging Market Revenue Million Forecast, by Price Trend Analysis 2020 & 2033
- Table 10: Global Packaging Market Volume Trillion Forecast, by Price Trend Analysis 2020 & 2033
- Table 11: Global Packaging Market Revenue Million Forecast, by Region 2020 & 2033
- Table 12: Global Packaging Market Volume Trillion Forecast, by Region 2020 & 2033
- Table 13: Global Packaging Market Revenue Million Forecast, by Production Analysis 2020 & 2033
- Table 14: Global Packaging Market Volume Trillion Forecast, by Production Analysis 2020 & 2033
- Table 15: Global Packaging Market Revenue Million Forecast, by Consumption Analysis 2020 & 2033
- Table 16: Global Packaging Market Volume Trillion Forecast, by Consumption Analysis 2020 & 2033
- Table 17: Global Packaging Market Revenue Million Forecast, by Import Market Analysis (Value & Volume) 2020 & 2033
- Table 18: Global Packaging Market Volume Trillion Forecast, by Import Market Analysis (Value & Volume) 2020 & 2033
- Table 19: Global Packaging Market Revenue Million Forecast, by Export Market Analysis (Value & Volume) 2020 & 2033
- Table 20: Global Packaging Market Volume Trillion Forecast, by Export Market Analysis (Value & Volume) 2020 & 2033
- Table 21: Global Packaging Market Revenue Million Forecast, by Price Trend Analysis 2020 & 2033
- Table 22: Global Packaging Market Volume Trillion Forecast, by Price Trend Analysis 2020 & 2033
- Table 23: Global Packaging Market Revenue Million Forecast, by Country 2020 & 2033
- Table 24: Global Packaging Market Volume Trillion Forecast, by Country 2020 & 2033
- Table 25: United States Packaging Market Revenue (Million) Forecast, by Application 2020 & 2033
- Table 26: United States Packaging Market Volume (Trillion) Forecast, by Application 2020 & 2033
- Table 27: Canada Packaging Market Revenue (Million) Forecast, by Application 2020 & 2033
- Table 28: Canada Packaging Market Volume (Trillion) Forecast, by Application 2020 & 2033
- Table 29: Mexico Packaging Market Revenue (Million) Forecast, by Application 2020 & 2033
- Table 30: Mexico Packaging Market Volume (Trillion) Forecast, by Application 2020 & 2033
- Table 31: Global Packaging Market Revenue Million Forecast, by Production Analysis 2020 & 2033
- Table 32: Global Packaging Market Volume Trillion Forecast, by Production Analysis 2020 & 2033
- Table 33: Global Packaging Market Revenue Million Forecast, by Consumption Analysis 2020 & 2033
- Table 34: Global Packaging Market Volume Trillion Forecast, by Consumption Analysis 2020 & 2033
- Table 35: Global Packaging Market Revenue Million Forecast, by Import Market Analysis (Value & Volume) 2020 & 2033
- Table 36: Global Packaging Market Volume Trillion Forecast, by Import Market Analysis (Value & Volume) 2020 & 2033
- Table 37: Global Packaging Market Revenue Million Forecast, by Export Market Analysis (Value & Volume) 2020 & 2033
- Table 38: Global Packaging Market Volume Trillion Forecast, by Export Market Analysis (Value & Volume) 2020 & 2033
- Table 39: Global Packaging Market Revenue Million Forecast, by Price Trend Analysis 2020 & 2033
- Table 40: Global Packaging Market Volume Trillion Forecast, by Price Trend Analysis 2020 & 2033
- Table 41: Global Packaging Market Revenue Million Forecast, by Country 2020 & 2033
- Table 42: Global Packaging Market Volume Trillion Forecast, by Country 2020 & 2033
- Table 43: Brazil Packaging Market Revenue (Million) Forecast, by Application 2020 & 2033
- Table 44: Brazil Packaging Market Volume (Trillion) Forecast, by Application 2020 & 2033
- Table 45: Argentina Packaging Market Revenue (Million) Forecast, by Application 2020 & 2033
- Table 46: Argentina Packaging Market Volume (Trillion) Forecast, by Application 2020 & 2033
- Table 47: Rest of South America Packaging Market Revenue (Million) Forecast, by Application 2020 & 2033
- Table 48: Rest of South America Packaging Market Volume (Trillion) Forecast, by Application 2020 & 2033
- Table 49: Global Packaging Market Revenue Million Forecast, by Production Analysis 2020 & 2033
- Table 50: Global Packaging Market Volume Trillion Forecast, by Production Analysis 2020 & 2033
- Table 51: Global Packaging Market Revenue Million Forecast, by Consumption Analysis 2020 & 2033
- Table 52: Global Packaging Market Volume Trillion Forecast, by Consumption Analysis 2020 & 2033
- Table 53: Global Packaging Market Revenue Million Forecast, by Import Market Analysis (Value & Volume) 2020 & 2033
- Table 54: Global Packaging Market Volume Trillion Forecast, by Import Market Analysis (Value & Volume) 2020 & 2033
- Table 55: Global Packaging Market Revenue Million Forecast, by Export Market Analysis (Value & Volume) 2020 & 2033
- Table 56: Global Packaging Market Volume Trillion Forecast, by Export Market Analysis (Value & Volume) 2020 & 2033
- Table 57: Global Packaging Market Revenue Million Forecast, by Price Trend Analysis 2020 & 2033
- Table 58: Global Packaging Market Volume Trillion Forecast, by Price Trend Analysis 2020 & 2033
- Table 59: Global Packaging Market Revenue Million Forecast, by Country 2020 & 2033
- Table 60: Global Packaging Market Volume Trillion Forecast, by Country 2020 & 2033
- Table 61: United Kingdom Packaging Market Revenue (Million) Forecast, by Application 2020 & 2033
- Table 62: United Kingdom Packaging Market Volume (Trillion) Forecast, by Application 2020 & 2033
- Table 63: Germany Packaging Market Revenue (Million) Forecast, by Application 2020 & 2033
- Table 64: Germany Packaging Market Volume (Trillion) Forecast, by Application 2020 & 2033
- Table 65: France Packaging Market Revenue (Million) Forecast, by Application 2020 & 2033
- Table 66: France Packaging Market Volume (Trillion) Forecast, by Application 2020 & 2033
- Table 67: Italy Packaging Market Revenue (Million) Forecast, by Application 2020 & 2033
- Table 68: Italy Packaging Market Volume (Trillion) Forecast, by Application 2020 & 2033
- Table 69: Spain Packaging Market Revenue (Million) Forecast, by Application 2020 & 2033
- Table 70: Spain Packaging Market Volume (Trillion) Forecast, by Application 2020 & 2033
- Table 71: Russia Packaging Market Revenue (Million) Forecast, by Application 2020 & 2033
- Table 72: Russia Packaging Market Volume (Trillion) Forecast, by Application 2020 & 2033
- Table 73: Benelux Packaging Market Revenue (Million) Forecast, by Application 2020 & 2033
- Table 74: Benelux Packaging Market Volume (Trillion) Forecast, by Application 2020 & 2033
- Table 75: Nordics Packaging Market Revenue (Million) Forecast, by Application 2020 & 2033
- Table 76: Nordics Packaging Market Volume (Trillion) Forecast, by Application 2020 & 2033
- Table 77: Rest of Europe Packaging Market Revenue (Million) Forecast, by Application 2020 & 2033
- Table 78: Rest of Europe Packaging Market Volume (Trillion) Forecast, by Application 2020 & 2033
- Table 79: Global Packaging Market Revenue Million Forecast, by Production Analysis 2020 & 2033
- Table 80: Global Packaging Market Volume Trillion Forecast, by Production Analysis 2020 & 2033
- Table 81: Global Packaging Market Revenue Million Forecast, by Consumption Analysis 2020 & 2033
- Table 82: Global Packaging Market Volume Trillion Forecast, by Consumption Analysis 2020 & 2033
- Table 83: Global Packaging Market Revenue Million Forecast, by Import Market Analysis (Value & Volume) 2020 & 2033
- Table 84: Global Packaging Market Volume Trillion Forecast, by Import Market Analysis (Value & Volume) 2020 & 2033
- Table 85: Global Packaging Market Revenue Million Forecast, by Export Market Analysis (Value & Volume) 2020 & 2033
- Table 86: Global Packaging Market Volume Trillion Forecast, by Export Market Analysis (Value & Volume) 2020 & 2033
- Table 87: Global Packaging Market Revenue Million Forecast, by Price Trend Analysis 2020 & 2033
- Table 88: Global Packaging Market Volume Trillion Forecast, by Price Trend Analysis 2020 & 2033
- Table 89: Global Packaging Market Revenue Million Forecast, by Country 2020 & 2033
- Table 90: Global Packaging Market Volume Trillion Forecast, by Country 2020 & 2033
- Table 91: Turkey Packaging Market Revenue (Million) Forecast, by Application 2020 & 2033
- Table 92: Turkey Packaging Market Volume (Trillion) Forecast, by Application 2020 & 2033
- Table 93: Israel Packaging Market Revenue (Million) Forecast, by Application 2020 & 2033
- Table 94: Israel Packaging Market Volume (Trillion) Forecast, by Application 2020 & 2033
- Table 95: GCC Packaging Market Revenue (Million) Forecast, by Application 2020 & 2033
- Table 96: GCC Packaging Market Volume (Trillion) Forecast, by Application 2020 & 2033
- Table 97: North Africa Packaging Market Revenue (Million) Forecast, by Application 2020 & 2033
- Table 98: North Africa Packaging Market Volume (Trillion) Forecast, by Application 2020 & 2033
- Table 99: South Africa Packaging Market Revenue (Million) Forecast, by Application 2020 & 2033
- Table 100: South Africa Packaging Market Volume (Trillion) Forecast, by Application 2020 & 2033
- Table 101: Rest of Middle East & Africa Packaging Market Revenue (Million) Forecast, by Application 2020 & 2033
- Table 102: Rest of Middle East & Africa Packaging Market Volume (Trillion) Forecast, by Application 2020 & 2033
- Table 103: Global Packaging Market Revenue Million Forecast, by Production Analysis 2020 & 2033
- Table 104: Global Packaging Market Volume Trillion Forecast, by Production Analysis 2020 & 2033
- Table 105: Global Packaging Market Revenue Million Forecast, by Consumption Analysis 2020 & 2033
- Table 106: Global Packaging Market Volume Trillion Forecast, by Consumption Analysis 2020 & 2033
- Table 107: Global Packaging Market Revenue Million Forecast, by Import Market Analysis (Value & Volume) 2020 & 2033
- Table 108: Global Packaging Market Volume Trillion Forecast, by Import Market Analysis (Value & Volume) 2020 & 2033
- Table 109: Global Packaging Market Revenue Million Forecast, by Export Market Analysis (Value & Volume) 2020 & 2033
- Table 110: Global Packaging Market Volume Trillion Forecast, by Export Market Analysis (Value & Volume) 2020 & 2033
- Table 111: Global Packaging Market Revenue Million Forecast, by Price Trend Analysis 2020 & 2033
- Table 112: Global Packaging Market Volume Trillion Forecast, by Price Trend Analysis 2020 & 2033
- Table 113: Global Packaging Market Revenue Million Forecast, by Country 2020 & 2033
- Table 114: Global Packaging Market Volume Trillion Forecast, by Country 2020 & 2033
- Table 115: China Packaging Market Revenue (Million) Forecast, by Application 2020 & 2033
- Table 116: China Packaging Market Volume (Trillion) Forecast, by Application 2020 & 2033
- Table 117: India Packaging Market Revenue (Million) Forecast, by Application 2020 & 2033
- Table 118: India Packaging Market Volume (Trillion) Forecast, by Application 2020 & 2033
- Table 119: Japan Packaging Market Revenue (Million) Forecast, by Application 2020 & 2033
- Table 120: Japan Packaging Market Volume (Trillion) Forecast, by Application 2020 & 2033
- Table 121: South Korea Packaging Market Revenue (Million) Forecast, by Application 2020 & 2033
- Table 122: South Korea Packaging Market Volume (Trillion) Forecast, by Application 2020 & 2033
- Table 123: ASEAN Packaging Market Revenue (Million) Forecast, by Application 2020 & 2033
- Table 124: ASEAN Packaging Market Volume (Trillion) Forecast, by Application 2020 & 2033
- Table 125: Oceania Packaging Market Revenue (Million) Forecast, by Application 2020 & 2033
- Table 126: Oceania Packaging Market Volume (Trillion) Forecast, by Application 2020 & 2033
- Table 127: Rest of Asia Pacific Packaging Market Revenue (Million) Forecast, by Application 2020 & 2033
- Table 128: Rest of Asia Pacific Packaging Market Volume (Trillion) Forecast, by Application 2020 & 2033
Frequently Asked Questions
1. What is the projected Compound Annual Growth Rate (CAGR) of the Packaging Market?
The projected CAGR is approximately 3.89%.
2. Which companies are prominent players in the Packaging Market?
Key companies in the market include International Paper Company, Mondi Group, Smurfit Kappa Group, DS Smith PLC, WestRock Company, UFlex Limited, Huhtamaki Oyj, Amcor Group GmbH, Coveris Holding SA, Sealed Air Corporation, Greif Inc, Sonoco Products Company, Aptar Group Inc, Berry Global Group Inc, Alpla Group, Owens-illinois Inc, Vidrala S A, Verallia SA, Gerresheimer AG, Vitro S A B De C V, Ball Corporation, Crown Holdings Inc, Ardagh Group S A, Can Pack SA, Silgan Holdings Inc.
3. What are the main segments of the Packaging Market?
The market segments include Production Analysis, Consumption Analysis, Import Market Analysis (Value & Volume), Export Market Analysis (Value & Volume), Price Trend Analysis.
4. Can you provide details about the market size?
The market size is estimated to be USD 1.14 Million as of 2022.
5. What are some drivers contributing to market growth?
N/A
6. What are the notable trends driving market growth?
Paper and Paperboard Packaging Products to Witness the Highest Growth.
7. Are there any restraints impacting market growth?
N/A
8. Can you provide examples of recent developments in the market?
June 2024: Sonoco Products Company announced its agreement to acquire Eviosys, a Europe manufacturer of food cans, ends, and closures, from KPS Capital Partners, LP, at around USD 3.9 billion.
9. What pricing options are available for accessing the report?
Pricing options include single-user, multi-user, and enterprise licenses priced at USD 3800, USD 4500, and USD 5800 respectively.
10. Is the market size provided in terms of value or volume?
The market size is provided in terms of value, measured in Million and volume, measured in Trillion.
11. Are there any specific market keywords associated with the report?
Yes, the market keyword associated with the report is "Packaging Market," which aids in identifying and referencing the specific market segment covered.
12. How do I determine which pricing option suits my needs best?
The pricing options vary based on user requirements and access needs. Individual users may opt for single-user licenses, while businesses requiring broader access may choose multi-user or enterprise licenses for cost-effective access to the report.
13. Are there any additional resources or data provided in the Packaging Market report?
While the report offers comprehensive insights, it's advisable to review the specific contents or supplementary materials provided to ascertain if additional resources or data are available.
14. How can I stay updated on further developments or reports in the Packaging Market?
To stay informed about further developments, trends, and reports in the Packaging Market, consider subscribing to industry newsletters, following relevant companies and organizations, or regularly checking reputable industry news sources and publications.
Methodology
Step 1 - Identification of Relevant Samples Size from Population Database


Step 2 - Approaches for Defining Global Market Size (Value, Volume* & Price*)

Note*: In applicable scenarios
Step 3 - Data Sources
Primary Research
- Web Analytics
- Survey Reports
- Research Institute
- Latest Research Reports
- Opinion Leaders
Secondary Research
- Annual Reports
- White Paper
- Latest Press Release
- Industry Association
- Paid Database
- Investor Presentations

Step 4 - Data Triangulation
Involves using different sources of information in order to increase the validity of a study
These sources are likely to be stakeholders in a program - participants, other researchers, program staff, other community members, and so on.
Then we put all data in single framework & apply various statistical tools to find out the dynamic on the market.
During the analysis stage, feedback from the stakeholder groups would be compared to determine areas of agreement as well as areas of divergence

