

Key Insights
The global packaging tubes market is poised for robust growth, driven by increasing demand from key sectors including cosmetics, oral care, and pharmaceuticals. Valued at an estimated $13.43 billion in the base year 2025, the market is projected to expand at a Compound Annual Growth Rate (CAGR) of 6.2% through 2033. This expansion is attributed to rising consumer preference for hygienic and convenient packaging, alongside advancements in tube materials and manufacturing technologies. Innovations in sustainable packaging, such as recycled plastics and biodegradable options, are further enhancing market appeal to environmentally conscious consumers. The growing disposable incomes and expanding middle class in emerging economies, particularly in the Asia Pacific, are significant growth drivers.
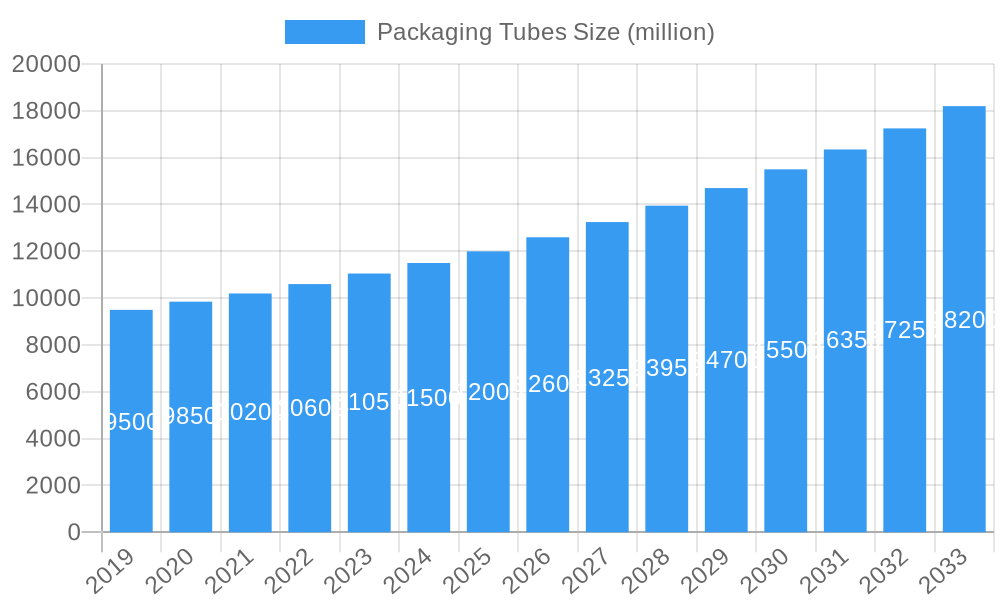
Packaging Tubes Market Size (In Billion)
Challenges within the packaging tubes market include volatile raw material prices and intense competition. However, manufacturers are addressing these by focusing on product differentiation through advanced printing and design. The market is segmented by tube type, with laminated tubes leading due to their versatility and barrier properties, followed by plastic and aluminum tubes. Geographically, the Asia Pacific region is expected to be the fastest-growing market, propelled by industrialization, a booming cosmetics industry, and increasing healthcare spending in countries like China and India. North America and Europe represent mature markets with a demand for premium, innovative packaging. Leading companies are prioritizing R&D for customized solutions that enhance product appeal and drive market innovation.
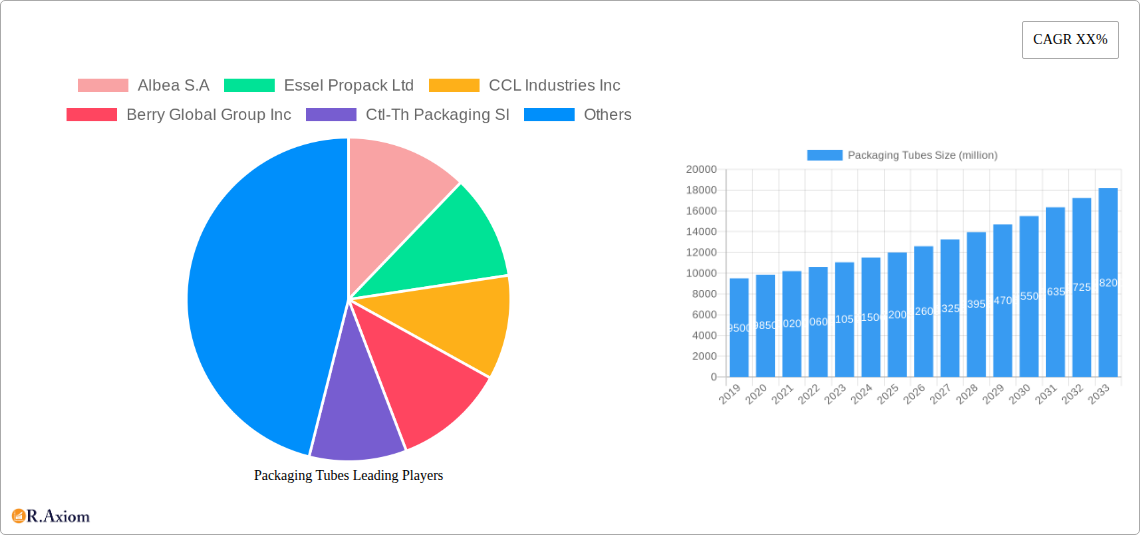
Packaging Tubes Company Market Share
Packaging Tubes Market Concentration & Innovation
The global packaging tubes market, valued at over $15,000 million in 2023, exhibits a moderate to high level of concentration, with leading players like Albea S.A, Essel Propack Ltd, CCL Industries Inc, Berry Global Group Inc, and CtL-Th Packaging SI holding substantial market share. Innovation remains a key differentiator, driven by advancements in material science, sustainable packaging solutions, and smart packaging technologies. Regulatory frameworks, particularly concerning environmental impact and product safety in segments like Pharmaceuticals and Food, are increasingly shaping product development and manufacturing processes. The threat of product substitutes, while present, is mitigated by the specialized functionality and established consumer trust in traditional packaging tubes for Cosmetics, Oral Care, and Pharmaceuticals. End-user trends are increasingly leaning towards premiumization, convenience, and eco-friendly options. Mergers and Acquisitions (M&A) activity, with reported deal values exceeding $500 million in the historical period (2019-2024), continues to be a strategic tool for companies to expand their geographical reach, acquire new technologies, and consolidate market presence.
Packaging Tubes Industry Trends & Insights
The packaging tubes industry is poised for robust growth, with an estimated Compound Annual Growth Rate (CAGR) of 6.5% projected over the forecast period (2025–2033). This expansion is fueled by several key market growth drivers, including the ever-increasing demand from the Cosmetics and Personal Care sector, where tubes offer convenience, hygiene, and precise dispensing. The Oral Care segment also continues to be a significant contributor, driven by global population growth and rising awareness of oral hygiene. Technological disruptions are playing a pivotal role, with advancements in extrusion technology leading to more efficient production of plastic tubes and innovative barrier properties for laminated tubes. The development of sustainable materials, such as bio-based and recycled plastics, is gaining significant traction, aligning with growing consumer preferences for eco-conscious products. Market penetration of advanced features like tamper-evident seals, child-resistant closures, and antimicrobial additives is also on the rise, particularly in the Pharmaceuticals and Food sectors. Competitive dynamics are characterized by intense price competition and a continuous race to innovate and offer differentiated solutions. The market penetration for specialized tubes, especially those with enhanced aesthetic appeal and functional benefits for premium cosmetic brands, is expected to grow by 3% annually. Furthermore, the Commercial segment, encompassing industrial applications and adhesives, is experiencing steady growth due to its reliance on robust and leak-proof dispensing solutions.
Dominant Markets & Segments in Packaging Tubes
The global packaging tubes market is dominated by the Cosmetics application segment, which accounted for over 30% of the market value in 2024, projected to reach approximately $6,000 million by 2033. This dominance is attributed to the segment's high demand for aesthetically pleasing, functional, and hygienic packaging for a wide array of products, including creams, lotions, serums, and makeup. Key drivers for its leadership include:
- Premiumization Trends: Consumers increasingly seek luxury and high-performance cosmetic products, demanding packaging that reflects this quality.
- E-commerce Growth: The rise of online retail has boosted demand for durable and attractive packaging that can withstand shipping.
- Brand Differentiation: Packaging tubes offer ample space for intricate designs, branding elements, and specialized finishes that help brands stand out.
The Laminated Tubes type is the leading product category within the packaging tubes market, holding a market share of over 45% in 2024. This segment is expected to witness substantial growth, driven by its versatility and ability to provide excellent barrier properties against light, oxygen, and moisture.
- Versatile Barrier Properties: Essential for extending shelf life and preserving the efficacy of sensitive formulations in Cosmetics and Pharmaceuticals.
- Aesthetic Appeal: Offers excellent printability and can achieve high-quality finishes, catering to the premium demands of the beauty industry.
- Cost-Effectiveness: For certain applications, laminated tubes offer a competitive price point compared to other advanced packaging solutions.
Regionally, Asia Pacific is emerging as a dominant market, with a projected market value exceeding $5,000 million by 2033. This growth is propelled by:
- Growing Middle Class: An expanding consumer base with increasing disposable income drives demand for packaged goods, particularly cosmetics and personal care items.
- Manufacturing Hub: The region's robust manufacturing infrastructure and competitive labor costs make it an attractive location for packaging production.
- Rising E-commerce Penetration: Significant growth in online shopping across countries like China and India fuels demand for efficient and appealing packaging.
Packaging Tubes Product Developments
Product innovations in packaging tubes are primarily focused on sustainability, functionality, and enhanced consumer experience. Developments include the introduction of mono-material plastic tubes for improved recyclability, advanced barrier technologies in laminated tubes to protect sensitive formulations, and the integration of smart features for product authentication. Companies are also innovating with novel dispensing mechanisms and personalized printing options. These developments aim to provide competitive advantages by meeting evolving consumer preferences for eco-friendly and convenient packaging solutions, while ensuring product integrity.
Packaging Tubes Report Scope & Segmentation Analysis
This report segments the packaging tubes market by Application and Type. The Application segment includes Cosmetics, Oral Care, Commercial, Pharmaceuticals, Food, and Others. The Cosmetics segment is projected to grow at a CAGR of 6.8%, reaching over $6,000 million by 2033. The Oral Care segment, valued at over $2,000 million in 2024, is expected to expand at a CAGR of 5.9%. The Type segment comprises Laminated Tubes, Aluminum Tubes, and Plastic Tubes. Laminated Tubes are expected to dominate, with a projected market size exceeding $7,500 million by 2033, exhibiting a CAGR of 7.1%. Aluminum Tubes, crucial for their barrier properties, are forecast to grow at 4.5% CAGR. Plastic Tubes, driven by cost-effectiveness and versatility, are projected for a 6.2% CAGR.
Key Drivers of Packaging Tubes Growth
Key drivers propelling the packaging tubes market include:
- Rising Demand from End-Use Industries: The sustained growth in Cosmetics, Oral Care, and Pharmaceuticals sectors, with their inherent need for safe, hygienic, and convenient packaging.
- Consumer Preference for Convenience and Hygiene: Tubes offer a controlled dispensing mechanism, minimizing product wastage and ensuring sanitary application.
- Advancements in Material Science and Technology: Development of sustainable materials, improved barrier properties, and innovative manufacturing processes enhance product performance and appeal.
- Growing E-commerce Landscape: The online retail boom necessitates robust, attractive, and tamper-evident packaging solutions, a role tubes effectively fulfill.
Challenges in the Packaging Tubes Sector
The packaging tubes sector faces several challenges:
- Increasing Environmental Regulations: Stringent regulations regarding plastic waste and recyclability are pushing manufacturers towards more sustainable alternatives, requiring significant R&D investment.
- Volatility in Raw Material Prices: Fluctuations in the cost of raw materials like aluminum and various plastics can impact profit margins and pricing strategies.
- Intense Competition and Price Pressures: The market is characterized by numerous players, leading to competitive pricing and a continuous need for cost optimization.
- Supply Chain Disruptions: Global supply chain issues can affect the availability and cost of raw materials and finished goods.
Emerging Opportunities in Packaging Tubes
Emerging opportunities in the packaging tubes market are multifaceted:
- Sustainable Packaging Solutions: The growing demand for recyclable, biodegradable, and compostable tubes presents a significant opportunity for innovation and market differentiation.
- Smart Packaging Integration: Incorporating features like QR codes for product traceability, anti-counterfeiting measures, and interactive consumer experiences.
- Expansion in Emerging Economies: The rising disposable income and evolving consumer lifestyles in developing nations offer substantial untapped market potential.
- Specialty and Niche Applications: Developing bespoke packaging solutions for niche markets like medical devices, high-end food products, and industrial lubricants.
Leading Players in the Packaging Tubes Market
- Albea S.A
- Essel Propack Ltd
- CCL Industries Inc
- Berry Global Group Inc
- CtL-Th Packaging SI
- Linhardt GmbH & Co. KG
- Montebello Packaging
- Huhtamaki Oyj
- Interapac International Corporation
- Plastube Inc
- Pack-Tubes
- Perfektup Ambalaj San. Ve Tic. A.S
- Burhani Group of Industries
- Tubapack A.S
- Norway Pack A.S
- Alltub Group
- Hoffmann Neopac AG
- Tubopress Italia SpA
- Lajovic Tuba D.O.O
- Pirlo GmbH & Co. KG
Key Developments in Packaging Tubes Industry
- 2023/Q4: Albea S.A. launched a new line of fully recyclable plastic tubes made from mono-material polyethylene, addressing growing sustainability concerns.
- 2023/Q3: Essel Propack Ltd. partnered with a leading cosmetic brand to develop advanced laminated tubes with enhanced barrier properties, extending product shelf life.
- 2023/Q2: CCL Industries Inc. acquired a specialty packaging company, expanding its capabilities in high-graphic printing for cosmetic tubes.
- 2023/Q1: Berry Global Group Inc. announced significant investments in recycled content for its plastic tube manufacturing operations.
- 2022/Q4: CtL-Th Packaging SI introduced innovative tamper-evident sealing technologies for pharmaceutical tubes, enhancing product security.
- 2022/Q3: Linhardt GmbH & Co. KG showcased bio-based plastic tubes at a major industry exhibition, highlighting its commitment to eco-friendly solutions.
- 2022/Q2: Huhtamaki Oyj expanded its production capacity for laminated tubes, responding to increased demand from the oral care sector.
- 2022/Q1: Hoffmann Neopac AG introduced a new generation of aluminum tubes with a reduced environmental footprint.
Strategic Outlook for Packaging Tubes Market
The strategic outlook for the packaging tubes market remains highly positive, driven by the enduring demand for convenient, hygienic, and visually appealing packaging. Key growth catalysts include the continuous innovation in sustainable materials and manufacturing processes, catering to the escalating consumer and regulatory push for eco-friendly solutions. The expansion of e-commerce and the growing middle class in emerging economies will further fuel market growth. Companies that can effectively leverage technological advancements, such as smart packaging and advanced barrier technologies, while maintaining a strong focus on sustainability and cost-competitiveness, are well-positioned for future success.
Packaging Tubes Segmentation
-
1. Application
- 1.1. Cosmetics
- 1.2. Oral Care
- 1.3. Commercial
- 1.4. Pharmaceuticals
- 1.5. Food
- 1.6. Others
-
2. Types
- 2.1. Laminated Tubes
- 2.2. Aluminum Tubes
- 2.3. Plastic Tubes
Packaging Tubes Segmentation By Geography
-
1. North America
- 1.1. United States
- 1.2. Canada
- 1.3. Mexico
-
2. South America
- 2.1. Brazil
- 2.2. Argentina
- 2.3. Rest of South America
-
3. Europe
- 3.1. United Kingdom
- 3.2. Germany
- 3.3. France
- 3.4. Italy
- 3.5. Spain
- 3.6. Russia
- 3.7. Benelux
- 3.8. Nordics
- 3.9. Rest of Europe
-
4. Middle East & Africa
- 4.1. Turkey
- 4.2. Israel
- 4.3. GCC
- 4.4. North Africa
- 4.5. South Africa
- 4.6. Rest of Middle East & Africa
-
5. Asia Pacific
- 5.1. China
- 5.2. India
- 5.3. Japan
- 5.4. South Korea
- 5.5. ASEAN
- 5.6. Oceania
- 5.7. Rest of Asia Pacific
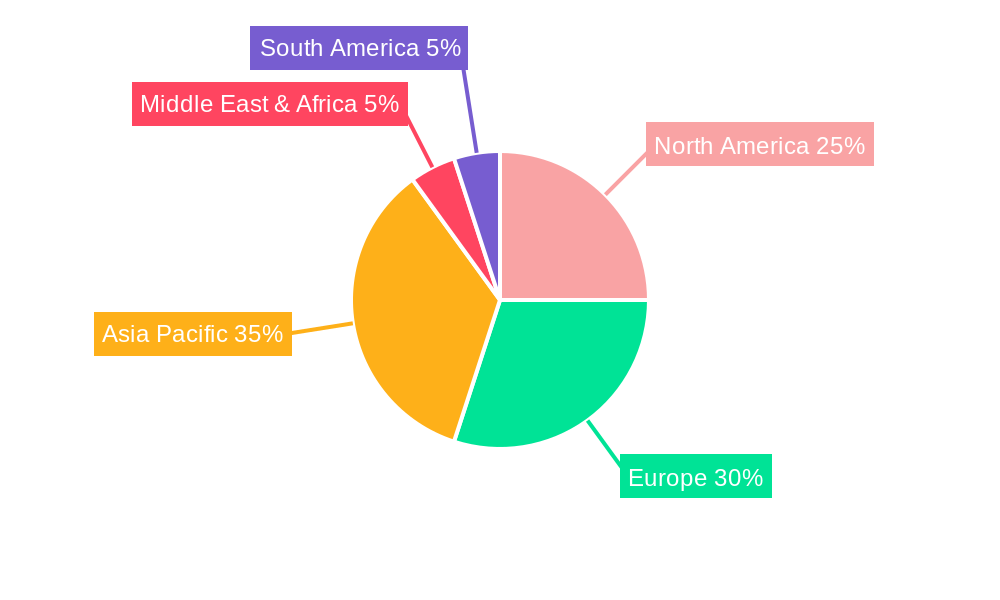
Packaging Tubes Regional Market Share
Geographic Coverage of Packaging Tubes
Packaging Tubes REPORT HIGHLIGHTS
| Aspects | Details |
|---|---|
| Study Period | 2020-2034 |
| Base Year | 2025 |
| Estimated Year | 2026 |
| Forecast Period | 2026-2034 |
| Historical Period | 2020-2025 |
| Growth Rate | CAGR of 6.2% from 2020-2034 |
| Segmentation |
|
Table of Contents
- 1. Introduction
- 1.1. Research Scope
- 1.2. Market Segmentation
- 1.3. Research Methodology
- 1.4. Definitions and Assumptions
- 2. Executive Summary
- 2.1. Introduction
- 3. Market Dynamics
- 3.1. Introduction
- 3.2. Market Drivers
- 3.3. Market Restrains
- 3.4. Market Trends
- 4. Market Factor Analysis
- 4.1. Porters Five Forces
- 4.2. Supply/Value Chain
- 4.3. PESTEL analysis
- 4.4. Market Entropy
- 4.5. Patent/Trademark Analysis
- 5. Global Packaging Tubes Analysis, Insights and Forecast, 2020-2032
- 5.1. Market Analysis, Insights and Forecast - by Application
- 5.1.1. Cosmetics
- 5.1.2. Oral Care
- 5.1.3. Commercial
- 5.1.4. Pharmaceuticals
- 5.1.5. Food
- 5.1.6. Others
- 5.2. Market Analysis, Insights and Forecast - by Types
- 5.2.1. Laminated Tubes
- 5.2.2. Aluminum Tubes
- 5.2.3. Plastic Tubes
- 5.3. Market Analysis, Insights and Forecast - by Region
- 5.3.1. North America
- 5.3.2. South America
- 5.3.3. Europe
- 5.3.4. Middle East & Africa
- 5.3.5. Asia Pacific
- 5.1. Market Analysis, Insights and Forecast - by Application
- 6. North America Packaging Tubes Analysis, Insights and Forecast, 2020-2032
- 6.1. Market Analysis, Insights and Forecast - by Application
- 6.1.1. Cosmetics
- 6.1.2. Oral Care
- 6.1.3. Commercial
- 6.1.4. Pharmaceuticals
- 6.1.5. Food
- 6.1.6. Others
- 6.2. Market Analysis, Insights and Forecast - by Types
- 6.2.1. Laminated Tubes
- 6.2.2. Aluminum Tubes
- 6.2.3. Plastic Tubes
- 6.1. Market Analysis, Insights and Forecast - by Application
- 7. South America Packaging Tubes Analysis, Insights and Forecast, 2020-2032
- 7.1. Market Analysis, Insights and Forecast - by Application
- 7.1.1. Cosmetics
- 7.1.2. Oral Care
- 7.1.3. Commercial
- 7.1.4. Pharmaceuticals
- 7.1.5. Food
- 7.1.6. Others
- 7.2. Market Analysis, Insights and Forecast - by Types
- 7.2.1. Laminated Tubes
- 7.2.2. Aluminum Tubes
- 7.2.3. Plastic Tubes
- 7.1. Market Analysis, Insights and Forecast - by Application
- 8. Europe Packaging Tubes Analysis, Insights and Forecast, 2020-2032
- 8.1. Market Analysis, Insights and Forecast - by Application
- 8.1.1. Cosmetics
- 8.1.2. Oral Care
- 8.1.3. Commercial
- 8.1.4. Pharmaceuticals
- 8.1.5. Food
- 8.1.6. Others
- 8.2. Market Analysis, Insights and Forecast - by Types
- 8.2.1. Laminated Tubes
- 8.2.2. Aluminum Tubes
- 8.2.3. Plastic Tubes
- 8.1. Market Analysis, Insights and Forecast - by Application
- 9. Middle East & Africa Packaging Tubes Analysis, Insights and Forecast, 2020-2032
- 9.1. Market Analysis, Insights and Forecast - by Application
- 9.1.1. Cosmetics
- 9.1.2. Oral Care
- 9.1.3. Commercial
- 9.1.4. Pharmaceuticals
- 9.1.5. Food
- 9.1.6. Others
- 9.2. Market Analysis, Insights and Forecast - by Types
- 9.2.1. Laminated Tubes
- 9.2.2. Aluminum Tubes
- 9.2.3. Plastic Tubes
- 9.1. Market Analysis, Insights and Forecast - by Application
- 10. Asia Pacific Packaging Tubes Analysis, Insights and Forecast, 2020-2032
- 10.1. Market Analysis, Insights and Forecast - by Application
- 10.1.1. Cosmetics
- 10.1.2. Oral Care
- 10.1.3. Commercial
- 10.1.4. Pharmaceuticals
- 10.1.5. Food
- 10.1.6. Others
- 10.2. Market Analysis, Insights and Forecast - by Types
- 10.2.1. Laminated Tubes
- 10.2.2. Aluminum Tubes
- 10.2.3. Plastic Tubes
- 10.1. Market Analysis, Insights and Forecast - by Application
- 11. Competitive Analysis
- 11.1. Global Market Share Analysis 2025
- 11.2. Company Profiles
- 11.2.1 Albea S.A
- 11.2.1.1. Overview
- 11.2.1.2. Products
- 11.2.1.3. SWOT Analysis
- 11.2.1.4. Recent Developments
- 11.2.1.5. Financials (Based on Availability)
- 11.2.2 Essel Propack Ltd
- 11.2.2.1. Overview
- 11.2.2.2. Products
- 11.2.2.3. SWOT Analysis
- 11.2.2.4. Recent Developments
- 11.2.2.5. Financials (Based on Availability)
- 11.2.3 CCL Industries Inc
- 11.2.3.1. Overview
- 11.2.3.2. Products
- 11.2.3.3. SWOT Analysis
- 11.2.3.4. Recent Developments
- 11.2.3.5. Financials (Based on Availability)
- 11.2.4 Berry Global Group Inc
- 11.2.4.1. Overview
- 11.2.4.2. Products
- 11.2.4.3. SWOT Analysis
- 11.2.4.4. Recent Developments
- 11.2.4.5. Financials (Based on Availability)
- 11.2.5 Ctl-Th Packaging SI
- 11.2.5.1. Overview
- 11.2.5.2. Products
- 11.2.5.3. SWOT Analysis
- 11.2.5.4. Recent Developments
- 11.2.5.5. Financials (Based on Availability)
- 11.2.6 Linhardt GmbH & Co. KG
- 11.2.6.1. Overview
- 11.2.6.2. Products
- 11.2.6.3. SWOT Analysis
- 11.2.6.4. Recent Developments
- 11.2.6.5. Financials (Based on Availability)
- 11.2.7 Montebello Packaging
- 11.2.7.1. Overview
- 11.2.7.2. Products
- 11.2.7.3. SWOT Analysis
- 11.2.7.4. Recent Developments
- 11.2.7.5. Financials (Based on Availability)
- 11.2.8 Huhtamaki Oyj
- 11.2.8.1. Overview
- 11.2.8.2. Products
- 11.2.8.3. SWOT Analysis
- 11.2.8.4. Recent Developments
- 11.2.8.5. Financials (Based on Availability)
- 11.2.9 Interapac International Corporation
- 11.2.9.1. Overview
- 11.2.9.2. Products
- 11.2.9.3. SWOT Analysis
- 11.2.9.4. Recent Developments
- 11.2.9.5. Financials (Based on Availability)
- 11.2.10 Plastube Inc
- 11.2.10.1. Overview
- 11.2.10.2. Products
- 11.2.10.3. SWOT Analysis
- 11.2.10.4. Recent Developments
- 11.2.10.5. Financials (Based on Availability)
- 11.2.11 Pack-Tubes
- 11.2.11.1. Overview
- 11.2.11.2. Products
- 11.2.11.3. SWOT Analysis
- 11.2.11.4. Recent Developments
- 11.2.11.5. Financials (Based on Availability)
- 11.2.12 Perfektup Ambalaj San. Ve Tic. A.S
- 11.2.12.1. Overview
- 11.2.12.2. Products
- 11.2.12.3. SWOT Analysis
- 11.2.12.4. Recent Developments
- 11.2.12.5. Financials (Based on Availability)
- 11.2.13 Burhani Group of Industries
- 11.2.13.1. Overview
- 11.2.13.2. Products
- 11.2.13.3. SWOT Analysis
- 11.2.13.4. Recent Developments
- 11.2.13.5. Financials (Based on Availability)
- 11.2.14 Tubapack A.S
- 11.2.14.1. Overview
- 11.2.14.2. Products
- 11.2.14.3. SWOT Analysis
- 11.2.14.4. Recent Developments
- 11.2.14.5. Financials (Based on Availability)
- 11.2.15 Norway Pack A.S
- 11.2.15.1. Overview
- 11.2.15.2. Products
- 11.2.15.3. SWOT Analysis
- 11.2.15.4. Recent Developments
- 11.2.15.5. Financials (Based on Availability)
- 11.2.16 Alltub Group
- 11.2.16.1. Overview
- 11.2.16.2. Products
- 11.2.16.3. SWOT Analysis
- 11.2.16.4. Recent Developments
- 11.2.16.5. Financials (Based on Availability)
- 11.2.17 Hoffmann Neopac AG
- 11.2.17.1. Overview
- 11.2.17.2. Products
- 11.2.17.3. SWOT Analysis
- 11.2.17.4. Recent Developments
- 11.2.17.5. Financials (Based on Availability)
- 11.2.18 Tubopress Italia SpA
- 11.2.18.1. Overview
- 11.2.18.2. Products
- 11.2.18.3. SWOT Analysis
- 11.2.18.4. Recent Developments
- 11.2.18.5. Financials (Based on Availability)
- 11.2.19 Lajovic Tuba D.O.O
- 11.2.19.1. Overview
- 11.2.19.2. Products
- 11.2.19.3. SWOT Analysis
- 11.2.19.4. Recent Developments
- 11.2.19.5. Financials (Based on Availability)
- 11.2.20 Pirlo GmbH & Co. KG
- 11.2.20.1. Overview
- 11.2.20.2. Products
- 11.2.20.3. SWOT Analysis
- 11.2.20.4. Recent Developments
- 11.2.20.5. Financials (Based on Availability)
- 11.2.1 Albea S.A
List of Figures
- Figure 1: Global Packaging Tubes Revenue Breakdown (billion, %) by Region 2025 & 2033
- Figure 2: Global Packaging Tubes Volume Breakdown (K, %) by Region 2025 & 2033
- Figure 3: North America Packaging Tubes Revenue (billion), by Application 2025 & 2033
- Figure 4: North America Packaging Tubes Volume (K), by Application 2025 & 2033
- Figure 5: North America Packaging Tubes Revenue Share (%), by Application 2025 & 2033
- Figure 6: North America Packaging Tubes Volume Share (%), by Application 2025 & 2033
- Figure 7: North America Packaging Tubes Revenue (billion), by Types 2025 & 2033
- Figure 8: North America Packaging Tubes Volume (K), by Types 2025 & 2033
- Figure 9: North America Packaging Tubes Revenue Share (%), by Types 2025 & 2033
- Figure 10: North America Packaging Tubes Volume Share (%), by Types 2025 & 2033
- Figure 11: North America Packaging Tubes Revenue (billion), by Country 2025 & 2033
- Figure 12: North America Packaging Tubes Volume (K), by Country 2025 & 2033
- Figure 13: North America Packaging Tubes Revenue Share (%), by Country 2025 & 2033
- Figure 14: North America Packaging Tubes Volume Share (%), by Country 2025 & 2033
- Figure 15: South America Packaging Tubes Revenue (billion), by Application 2025 & 2033
- Figure 16: South America Packaging Tubes Volume (K), by Application 2025 & 2033
- Figure 17: South America Packaging Tubes Revenue Share (%), by Application 2025 & 2033
- Figure 18: South America Packaging Tubes Volume Share (%), by Application 2025 & 2033
- Figure 19: South America Packaging Tubes Revenue (billion), by Types 2025 & 2033
- Figure 20: South America Packaging Tubes Volume (K), by Types 2025 & 2033
- Figure 21: South America Packaging Tubes Revenue Share (%), by Types 2025 & 2033
- Figure 22: South America Packaging Tubes Volume Share (%), by Types 2025 & 2033
- Figure 23: South America Packaging Tubes Revenue (billion), by Country 2025 & 2033
- Figure 24: South America Packaging Tubes Volume (K), by Country 2025 & 2033
- Figure 25: South America Packaging Tubes Revenue Share (%), by Country 2025 & 2033
- Figure 26: South America Packaging Tubes Volume Share (%), by Country 2025 & 2033
- Figure 27: Europe Packaging Tubes Revenue (billion), by Application 2025 & 2033
- Figure 28: Europe Packaging Tubes Volume (K), by Application 2025 & 2033
- Figure 29: Europe Packaging Tubes Revenue Share (%), by Application 2025 & 2033
- Figure 30: Europe Packaging Tubes Volume Share (%), by Application 2025 & 2033
- Figure 31: Europe Packaging Tubes Revenue (billion), by Types 2025 & 2033
- Figure 32: Europe Packaging Tubes Volume (K), by Types 2025 & 2033
- Figure 33: Europe Packaging Tubes Revenue Share (%), by Types 2025 & 2033
- Figure 34: Europe Packaging Tubes Volume Share (%), by Types 2025 & 2033
- Figure 35: Europe Packaging Tubes Revenue (billion), by Country 2025 & 2033
- Figure 36: Europe Packaging Tubes Volume (K), by Country 2025 & 2033
- Figure 37: Europe Packaging Tubes Revenue Share (%), by Country 2025 & 2033
- Figure 38: Europe Packaging Tubes Volume Share (%), by Country 2025 & 2033
- Figure 39: Middle East & Africa Packaging Tubes Revenue (billion), by Application 2025 & 2033
- Figure 40: Middle East & Africa Packaging Tubes Volume (K), by Application 2025 & 2033
- Figure 41: Middle East & Africa Packaging Tubes Revenue Share (%), by Application 2025 & 2033
- Figure 42: Middle East & Africa Packaging Tubes Volume Share (%), by Application 2025 & 2033
- Figure 43: Middle East & Africa Packaging Tubes Revenue (billion), by Types 2025 & 2033
- Figure 44: Middle East & Africa Packaging Tubes Volume (K), by Types 2025 & 2033
- Figure 45: Middle East & Africa Packaging Tubes Revenue Share (%), by Types 2025 & 2033
- Figure 46: Middle East & Africa Packaging Tubes Volume Share (%), by Types 2025 & 2033
- Figure 47: Middle East & Africa Packaging Tubes Revenue (billion), by Country 2025 & 2033
- Figure 48: Middle East & Africa Packaging Tubes Volume (K), by Country 2025 & 2033
- Figure 49: Middle East & Africa Packaging Tubes Revenue Share (%), by Country 2025 & 2033
- Figure 50: Middle East & Africa Packaging Tubes Volume Share (%), by Country 2025 & 2033
- Figure 51: Asia Pacific Packaging Tubes Revenue (billion), by Application 2025 & 2033
- Figure 52: Asia Pacific Packaging Tubes Volume (K), by Application 2025 & 2033
- Figure 53: Asia Pacific Packaging Tubes Revenue Share (%), by Application 2025 & 2033
- Figure 54: Asia Pacific Packaging Tubes Volume Share (%), by Application 2025 & 2033
- Figure 55: Asia Pacific Packaging Tubes Revenue (billion), by Types 2025 & 2033
- Figure 56: Asia Pacific Packaging Tubes Volume (K), by Types 2025 & 2033
- Figure 57: Asia Pacific Packaging Tubes Revenue Share (%), by Types 2025 & 2033
- Figure 58: Asia Pacific Packaging Tubes Volume Share (%), by Types 2025 & 2033
- Figure 59: Asia Pacific Packaging Tubes Revenue (billion), by Country 2025 & 2033
- Figure 60: Asia Pacific Packaging Tubes Volume (K), by Country 2025 & 2033
- Figure 61: Asia Pacific Packaging Tubes Revenue Share (%), by Country 2025 & 2033
- Figure 62: Asia Pacific Packaging Tubes Volume Share (%), by Country 2025 & 2033
List of Tables
- Table 1: Global Packaging Tubes Revenue billion Forecast, by Application 2020 & 2033
- Table 2: Global Packaging Tubes Volume K Forecast, by Application 2020 & 2033
- Table 3: Global Packaging Tubes Revenue billion Forecast, by Types 2020 & 2033
- Table 4: Global Packaging Tubes Volume K Forecast, by Types 2020 & 2033
- Table 5: Global Packaging Tubes Revenue billion Forecast, by Region 2020 & 2033
- Table 6: Global Packaging Tubes Volume K Forecast, by Region 2020 & 2033
- Table 7: Global Packaging Tubes Revenue billion Forecast, by Application 2020 & 2033
- Table 8: Global Packaging Tubes Volume K Forecast, by Application 2020 & 2033
- Table 9: Global Packaging Tubes Revenue billion Forecast, by Types 2020 & 2033
- Table 10: Global Packaging Tubes Volume K Forecast, by Types 2020 & 2033
- Table 11: Global Packaging Tubes Revenue billion Forecast, by Country 2020 & 2033
- Table 12: Global Packaging Tubes Volume K Forecast, by Country 2020 & 2033
- Table 13: United States Packaging Tubes Revenue (billion) Forecast, by Application 2020 & 2033
- Table 14: United States Packaging Tubes Volume (K) Forecast, by Application 2020 & 2033
- Table 15: Canada Packaging Tubes Revenue (billion) Forecast, by Application 2020 & 2033
- Table 16: Canada Packaging Tubes Volume (K) Forecast, by Application 2020 & 2033
- Table 17: Mexico Packaging Tubes Revenue (billion) Forecast, by Application 2020 & 2033
- Table 18: Mexico Packaging Tubes Volume (K) Forecast, by Application 2020 & 2033
- Table 19: Global Packaging Tubes Revenue billion Forecast, by Application 2020 & 2033
- Table 20: Global Packaging Tubes Volume K Forecast, by Application 2020 & 2033
- Table 21: Global Packaging Tubes Revenue billion Forecast, by Types 2020 & 2033
- Table 22: Global Packaging Tubes Volume K Forecast, by Types 2020 & 2033
- Table 23: Global Packaging Tubes Revenue billion Forecast, by Country 2020 & 2033
- Table 24: Global Packaging Tubes Volume K Forecast, by Country 2020 & 2033
- Table 25: Brazil Packaging Tubes Revenue (billion) Forecast, by Application 2020 & 2033
- Table 26: Brazil Packaging Tubes Volume (K) Forecast, by Application 2020 & 2033
- Table 27: Argentina Packaging Tubes Revenue (billion) Forecast, by Application 2020 & 2033
- Table 28: Argentina Packaging Tubes Volume (K) Forecast, by Application 2020 & 2033
- Table 29: Rest of South America Packaging Tubes Revenue (billion) Forecast, by Application 2020 & 2033
- Table 30: Rest of South America Packaging Tubes Volume (K) Forecast, by Application 2020 & 2033
- Table 31: Global Packaging Tubes Revenue billion Forecast, by Application 2020 & 2033
- Table 32: Global Packaging Tubes Volume K Forecast, by Application 2020 & 2033
- Table 33: Global Packaging Tubes Revenue billion Forecast, by Types 2020 & 2033
- Table 34: Global Packaging Tubes Volume K Forecast, by Types 2020 & 2033
- Table 35: Global Packaging Tubes Revenue billion Forecast, by Country 2020 & 2033
- Table 36: Global Packaging Tubes Volume K Forecast, by Country 2020 & 2033
- Table 37: United Kingdom Packaging Tubes Revenue (billion) Forecast, by Application 2020 & 2033
- Table 38: United Kingdom Packaging Tubes Volume (K) Forecast, by Application 2020 & 2033
- Table 39: Germany Packaging Tubes Revenue (billion) Forecast, by Application 2020 & 2033
- Table 40: Germany Packaging Tubes Volume (K) Forecast, by Application 2020 & 2033
- Table 41: France Packaging Tubes Revenue (billion) Forecast, by Application 2020 & 2033
- Table 42: France Packaging Tubes Volume (K) Forecast, by Application 2020 & 2033
- Table 43: Italy Packaging Tubes Revenue (billion) Forecast, by Application 2020 & 2033
- Table 44: Italy Packaging Tubes Volume (K) Forecast, by Application 2020 & 2033
- Table 45: Spain Packaging Tubes Revenue (billion) Forecast, by Application 2020 & 2033
- Table 46: Spain Packaging Tubes Volume (K) Forecast, by Application 2020 & 2033
- Table 47: Russia Packaging Tubes Revenue (billion) Forecast, by Application 2020 & 2033
- Table 48: Russia Packaging Tubes Volume (K) Forecast, by Application 2020 & 2033
- Table 49: Benelux Packaging Tubes Revenue (billion) Forecast, by Application 2020 & 2033
- Table 50: Benelux Packaging Tubes Volume (K) Forecast, by Application 2020 & 2033
- Table 51: Nordics Packaging Tubes Revenue (billion) Forecast, by Application 2020 & 2033
- Table 52: Nordics Packaging Tubes Volume (K) Forecast, by Application 2020 & 2033
- Table 53: Rest of Europe Packaging Tubes Revenue (billion) Forecast, by Application 2020 & 2033
- Table 54: Rest of Europe Packaging Tubes Volume (K) Forecast, by Application 2020 & 2033
- Table 55: Global Packaging Tubes Revenue billion Forecast, by Application 2020 & 2033
- Table 56: Global Packaging Tubes Volume K Forecast, by Application 2020 & 2033
- Table 57: Global Packaging Tubes Revenue billion Forecast, by Types 2020 & 2033
- Table 58: Global Packaging Tubes Volume K Forecast, by Types 2020 & 2033
- Table 59: Global Packaging Tubes Revenue billion Forecast, by Country 2020 & 2033
- Table 60: Global Packaging Tubes Volume K Forecast, by Country 2020 & 2033
- Table 61: Turkey Packaging Tubes Revenue (billion) Forecast, by Application 2020 & 2033
- Table 62: Turkey Packaging Tubes Volume (K) Forecast, by Application 2020 & 2033
- Table 63: Israel Packaging Tubes Revenue (billion) Forecast, by Application 2020 & 2033
- Table 64: Israel Packaging Tubes Volume (K) Forecast, by Application 2020 & 2033
- Table 65: GCC Packaging Tubes Revenue (billion) Forecast, by Application 2020 & 2033
- Table 66: GCC Packaging Tubes Volume (K) Forecast, by Application 2020 & 2033
- Table 67: North Africa Packaging Tubes Revenue (billion) Forecast, by Application 2020 & 2033
- Table 68: North Africa Packaging Tubes Volume (K) Forecast, by Application 2020 & 2033
- Table 69: South Africa Packaging Tubes Revenue (billion) Forecast, by Application 2020 & 2033
- Table 70: South Africa Packaging Tubes Volume (K) Forecast, by Application 2020 & 2033
- Table 71: Rest of Middle East & Africa Packaging Tubes Revenue (billion) Forecast, by Application 2020 & 2033
- Table 72: Rest of Middle East & Africa Packaging Tubes Volume (K) Forecast, by Application 2020 & 2033
- Table 73: Global Packaging Tubes Revenue billion Forecast, by Application 2020 & 2033
- Table 74: Global Packaging Tubes Volume K Forecast, by Application 2020 & 2033
- Table 75: Global Packaging Tubes Revenue billion Forecast, by Types 2020 & 2033
- Table 76: Global Packaging Tubes Volume K Forecast, by Types 2020 & 2033
- Table 77: Global Packaging Tubes Revenue billion Forecast, by Country 2020 & 2033
- Table 78: Global Packaging Tubes Volume K Forecast, by Country 2020 & 2033
- Table 79: China Packaging Tubes Revenue (billion) Forecast, by Application 2020 & 2033
- Table 80: China Packaging Tubes Volume (K) Forecast, by Application 2020 & 2033
- Table 81: India Packaging Tubes Revenue (billion) Forecast, by Application 2020 & 2033
- Table 82: India Packaging Tubes Volume (K) Forecast, by Application 2020 & 2033
- Table 83: Japan Packaging Tubes Revenue (billion) Forecast, by Application 2020 & 2033
- Table 84: Japan Packaging Tubes Volume (K) Forecast, by Application 2020 & 2033
- Table 85: South Korea Packaging Tubes Revenue (billion) Forecast, by Application 2020 & 2033
- Table 86: South Korea Packaging Tubes Volume (K) Forecast, by Application 2020 & 2033
- Table 87: ASEAN Packaging Tubes Revenue (billion) Forecast, by Application 2020 & 2033
- Table 88: ASEAN Packaging Tubes Volume (K) Forecast, by Application 2020 & 2033
- Table 89: Oceania Packaging Tubes Revenue (billion) Forecast, by Application 2020 & 2033
- Table 90: Oceania Packaging Tubes Volume (K) Forecast, by Application 2020 & 2033
- Table 91: Rest of Asia Pacific Packaging Tubes Revenue (billion) Forecast, by Application 2020 & 2033
- Table 92: Rest of Asia Pacific Packaging Tubes Volume (K) Forecast, by Application 2020 & 2033
Frequently Asked Questions
1. What is the projected Compound Annual Growth Rate (CAGR) of the Packaging Tubes?
The projected CAGR is approximately 6.2%.
2. Which companies are prominent players in the Packaging Tubes?
Key companies in the market include Albea S.A, Essel Propack Ltd, CCL Industries Inc, Berry Global Group Inc, Ctl-Th Packaging SI, Linhardt GmbH & Co. KG, Montebello Packaging, Huhtamaki Oyj, Interapac International Corporation, Plastube Inc, Pack-Tubes, Perfektup Ambalaj San. Ve Tic. A.S, Burhani Group of Industries, Tubapack A.S, Norway Pack A.S, Alltub Group, Hoffmann Neopac AG, Tubopress Italia SpA, Lajovic Tuba D.O.O, Pirlo GmbH & Co. KG.
3. What are the main segments of the Packaging Tubes?
The market segments include Application, Types.
4. Can you provide details about the market size?
The market size is estimated to be USD 13.43 billion as of 2022.
5. What are some drivers contributing to market growth?
N/A
6. What are the notable trends driving market growth?
N/A
7. Are there any restraints impacting market growth?
N/A
8. Can you provide examples of recent developments in the market?
N/A
9. What pricing options are available for accessing the report?
Pricing options include single-user, multi-user, and enterprise licenses priced at USD 3350.00, USD 5025.00, and USD 6700.00 respectively.
10. Is the market size provided in terms of value or volume?
The market size is provided in terms of value, measured in billion and volume, measured in K.
11. Are there any specific market keywords associated with the report?
Yes, the market keyword associated with the report is "Packaging Tubes," which aids in identifying and referencing the specific market segment covered.
12. How do I determine which pricing option suits my needs best?
The pricing options vary based on user requirements and access needs. Individual users may opt for single-user licenses, while businesses requiring broader access may choose multi-user or enterprise licenses for cost-effective access to the report.
13. Are there any additional resources or data provided in the Packaging Tubes report?
While the report offers comprehensive insights, it's advisable to review the specific contents or supplementary materials provided to ascertain if additional resources or data are available.
14. How can I stay updated on further developments or reports in the Packaging Tubes?
To stay informed about further developments, trends, and reports in the Packaging Tubes, consider subscribing to industry newsletters, following relevant companies and organizations, or regularly checking reputable industry news sources and publications.
Methodology
Step 1 - Identification of Relevant Samples Size from Population Database


Step 2 - Approaches for Defining Global Market Size (Value, Volume* & Price*)

Note*: In applicable scenarios
Step 3 - Data Sources
Primary Research
- Web Analytics
- Survey Reports
- Research Institute
- Latest Research Reports
- Opinion Leaders
Secondary Research
- Annual Reports
- White Paper
- Latest Press Release
- Industry Association
- Paid Database
- Investor Presentations

Step 4 - Data Triangulation
Involves using different sources of information in order to increase the validity of a study
These sources are likely to be stakeholders in a program - participants, other researchers, program staff, other community members, and so on.
Then we put all data in single framework & apply various statistical tools to find out the dynamic on the market.
During the analysis stage, feedback from the stakeholder groups would be compared to determine areas of agreement as well as areas of divergence