
Key Insights
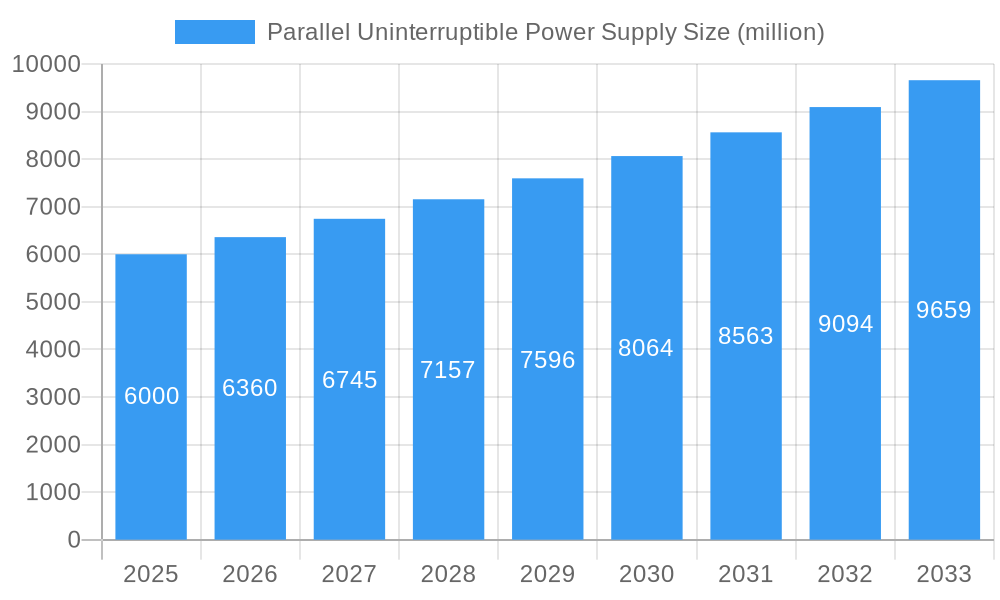
The global Parallel Uninterruptible Power Supply (UPS) market is poised for significant expansion, driven by escalating demand for uninterrupted power across critical sectors including data centers, healthcare, and industrial operations. Key growth catalysts include the rapid adoption of cloud computing, the burgeoning ecosystem of connected devices, and the paramount need for business continuity during power disruptions. Advancements in UPS technology, such as enhanced energy efficiency and superior battery performance, are further accelerating market growth. Projected for 2025, the market size is estimated at $12.7 billion, with an anticipated Compound Annual Growth Rate (CAGR) of 5.6% through the forecast period.

Parallel Uninterruptible Power Supply Market Size (In Billion)

Despite robust growth prospects, the market faces headwinds. Substantial upfront investment for parallel UPS systems can present a barrier for small and medium-sized enterprises. Additionally, environmental concerns related to battery disposal and the intricate nature of system maintenance may temper market expansion in specific applications. Market segmentation is anticipated across power capacity (kVA), end-use application (data centers, industrial, etc.), and technology type (double conversion, line-interactive, etc.). To mitigate these challenges, manufacturers are prioritizing the development of energy-efficient, modular, and user-friendly parallel UPS solutions, addressing environmental considerations while bolstering system reliability and operational cost-effectiveness. The competitive arena features established industry leaders and innovative emerging players, indicating a dynamic market ripe for innovation and strategic consolidation.
Parallel Uninterruptible Power Supply Company Market Share
Parallel Uninterruptible Power Supply (UPS) Market Report: 2019-2033
This comprehensive report provides an in-depth analysis of the global Parallel Uninterruptible Power Supply (Parallel UPS) market, offering invaluable insights for industry stakeholders, investors, and strategic decision-makers. The study covers the period from 2019 to 2033, with a focus on the forecast period of 2025-2033, using 2025 as the base year and estimated year. The market size is presented in millions.
Parallel Uninterruptible Power Supply Market Concentration & Innovation
This section analyzes the competitive landscape of the Parallel UPS market, examining market concentration, innovation drivers, regulatory influences, product substitutes, end-user trends, and mergers & acquisitions (M&A) activities. The global Parallel UPS market is moderately concentrated, with a few major players holding significant market share. In 2025, the top five companies—ABB, Siemens, Eaton, Toshiba Corporation, and Emerson Electric Co.—are estimated to hold approximately xx% of the market share, valued at approximately $xx million.
Market Concentration Metrics:
- Top 5 Market Share: xx% (Estimated 2025)
- Top 10 Market Share: xx% (Estimated 2025)
- Average Deal Value (M&A): $xx million (2019-2024)
Innovation Drivers:
- Increasing demand for high-reliability power solutions in data centers and critical infrastructure.
- Advancements in power electronics and battery technologies.
- Growing adoption of modular and scalable UPS systems.
Regulatory Frameworks:
- Stringent safety and environmental regulations are driving innovation in energy-efficient UPS solutions.
- Government initiatives promoting renewable energy integration are impacting UPS technology adoption.
Product Substitutes:
- While Parallel UPS systems remain the dominant solution for high-power applications, alternative technologies like rotary UPS systems are emerging as competitors in certain niche segments.
End-User Trends:
- The growing adoption of cloud computing and the expansion of data centers are fueling demand for robust and reliable Parallel UPS systems.
- The increasing reliance on critical infrastructure in various sectors is creating a sustained demand for Parallel UPS.
Parallel Uninterruptible Power Supply Industry Trends & Insights
The Parallel UPS market is experiencing robust growth driven by several factors. The Compound Annual Growth Rate (CAGR) during the forecast period (2025-2033) is projected to be xx%. Market penetration in key regions like North America and Europe is estimated at xx% in 2025, expected to increase to xx% by 2033. Technological advancements, including the integration of smart grid technologies and improved battery management systems, are significantly impacting market dynamics. Consumer preferences are shifting towards energy-efficient, modular, and easily manageable UPS systems, leading to increased demand for advanced features and remote monitoring capabilities. Competitive dynamics are shaped by technological innovation, strategic partnerships, and pricing strategies, with established players investing heavily in R&D to maintain market leadership.
Dominant Markets & Segments in Parallel Uninterruptible Power Supply
The North American region is currently the dominant market for Parallel UPS systems, driven by a robust IT infrastructure, high electricity costs, and stringent power quality standards. The market in the United States is particularly significant, accounting for a major portion of the overall North American market.
Key Drivers for North American Dominance:
- Robust IT Infrastructure: High density of data centers and cloud infrastructure.
- Stringent Power Quality Standards: Demand for reliable power solutions to prevent data loss.
- High Electricity Costs: Incentivizing investment in energy-efficient UPS systems.
- Government Regulations: Supporting investments in resilient infrastructure.
Detailed Dominance Analysis: The dominance of North America is expected to continue throughout the forecast period, although growth in other regions, particularly Asia-Pacific, driven by rapid economic development and industrialization, will present significant opportunities. The data center segment accounts for the largest share of the market in terms of revenue, owing to increasing deployment of advanced data centers.
Parallel Uninterruptible Power Supply Product Developments
Recent product innovations focus on enhancing efficiency, scalability, and ease of management. Modular designs allow for flexible capacity upgrades as needed, while advancements in power electronics improve energy efficiency and reduce operational costs. Smart monitoring capabilities enable remote diagnostics and predictive maintenance, minimizing downtime and enhancing operational efficiency. These developments cater to the evolving needs of data centers and critical infrastructure, offering competitive advantages to vendors who prioritize technological advancements.
Report Scope & Segmentation Analysis
This report segments the Parallel UPS market based on power rating (e.g., <100kVA, 100-500kVA, >500kVA), end-user industry (e.g., data centers, healthcare, manufacturing), and geography. Each segment exhibits unique growth patterns and competitive dynamics. For instance, the data center segment shows strong growth potential due to the rise of cloud computing, while the healthcare segment displays steady growth driven by reliability requirements in critical applications. The geographic segmentation reveals variations in market maturity and growth potential across regions.
Key Drivers of Parallel Uninterruptible Power Supply Growth
Several factors contribute to the robust growth of the Parallel UPS market. Technological advancements in power electronics and battery technology are improving efficiency, reliability, and scalability of UPS systems. The burgeoning growth of data centers, driven by cloud computing and big data analytics, is a major driver of demand. Furthermore, stringent regulatory frameworks focusing on power quality and reliability across various industries are pushing for wider adoption of robust UPS solutions.
Challenges in the Parallel Uninterruptible Power Supply Sector
The Parallel UPS market faces challenges including the high initial investment costs associated with deploying these systems. Supply chain disruptions, particularly relating to battery materials, can impact production and lead times. Furthermore, intense competition among established players necessitates continuous innovation and cost optimization to maintain market share. The fluctuating prices of raw materials also pose a challenge. The overall impact of these challenges on market growth is estimated at a xx% reduction in CAGR over the forecast period.
Emerging Opportunities in Parallel Uninterruptible Power Supply
Emerging opportunities lie in the integration of renewable energy sources with UPS systems, enabling a greener and more sustainable power solution. The development of more sophisticated battery technologies, such as lithium-ion batteries, offers improved energy density and longer lifespan, creating cost-effective solutions. Expansion into emerging markets, particularly in Asia-Pacific and Latin America, presents significant growth prospects. These trends are projected to contribute to a xx% increase in market growth during the latter half of the forecast period.
Leading Players in the Parallel Uninterruptible Power Supply Market
- ABB
- Siemens
- EATON
- TOSHIBA CORPORATION
- J. Schneider Elektrotechnik
- AEG Power Solutions B.V.
- Emerson Electric Co.
- Socomec
- SALICRU
- RIELLO UPS
- Benning
- GTEC FRANCE
- INVT Electric
- Shenzhen CONSNANT Technology Co., Ltd.
- Saft Power Systems
- Wärtsilä
- Block Transformatoren-Elektronik
- CHLORIDE POWER PROTECTION
- GE
Key Developments in Parallel Uninterruptible Power Supply Industry
- 2022 Q3: ABB launched a new line of modular Parallel UPS systems with enhanced energy efficiency.
- 2023 Q1: Siemens acquired a smaller UPS manufacturer, expanding its product portfolio.
- 2024 Q2: Eaton introduced a new battery management system for its Parallel UPS solutions. (Note: Specific dates and details of M&A activities may require further research)
Strategic Outlook for Parallel Uninterruptible Power Supply Market
The Parallel UPS market is poised for sustained growth driven by technological advancements, increasing demand from data centers, and stringent regulatory requirements. The integration of renewable energy sources and advancements in battery technology will create new opportunities. Focusing on innovation, strategic partnerships, and efficient supply chain management will be critical for success in this dynamic market. The long-term outlook remains positive, with significant market expansion predicted throughout the forecast period.
Parallel Uninterruptible Power Supply Segmentation
-
1. Application
- 1.1. undefined
-
2. Type
- 2.1. undefined
Parallel Uninterruptible Power Supply Segmentation By Geography
- 1. undefined
- 2. undefined
- 3. undefined
- 4. undefined
- 5. undefined

Parallel Uninterruptible Power Supply Regional Market Share
Geographic Coverage of Parallel Uninterruptible Power Supply
Parallel Uninterruptible Power Supply REPORT HIGHLIGHTS
| Aspects | Details |
|---|---|
| Study Period | 2020-2034 |
| Base Year | 2025 |
| Estimated Year | 2026 |
| Forecast Period | 2026-2034 |
| Historical Period | 2020-2025 |
| Growth Rate | CAGR of 5.6% from 2020-2034 |
| Segmentation |
|
Table of Contents
- 1. Introduction
- 1.1. Research Scope
- 1.2. Market Segmentation
- 1.3. Research Methodology
- 1.4. Definitions and Assumptions
- 2. Executive Summary
- 2.1. Introduction
- 3. Market Dynamics
- 3.1. Introduction
- 3.2. Market Drivers
- 3.3. Market Restrains
- 3.4. Market Trends
- 4. Market Factor Analysis
- 4.1. Porters Five Forces
- 4.2. Supply/Value Chain
- 4.3. PESTEL analysis
- 4.4. Market Entropy
- 4.5. Patent/Trademark Analysis
- 5. Global Parallel Uninterruptible Power Supply Analysis, Insights and Forecast, 2020-2032
- 5.1. Market Analysis, Insights and Forecast - by Application
- 5.1.1.
- 5.2. Market Analysis, Insights and Forecast - by Type
- 5.2.1.
- 5.3. Market Analysis, Insights and Forecast - by Region
- 5.3.1.
- 5.3.2.
- 5.3.3.
- 5.3.4.
- 5.3.5.
- 5.1. Market Analysis, Insights and Forecast - by Application
- 6. undefined Parallel Uninterruptible Power Supply Analysis, Insights and Forecast, 2020-2032
- 6.1. Market Analysis, Insights and Forecast - by Application
- 6.1.1.
- 6.2. Market Analysis, Insights and Forecast - by Type
- 6.2.1.
- 6.1. Market Analysis, Insights and Forecast - by Application
- 7. undefined Parallel Uninterruptible Power Supply Analysis, Insights and Forecast, 2020-2032
- 7.1. Market Analysis, Insights and Forecast - by Application
- 7.1.1.
- 7.2. Market Analysis, Insights and Forecast - by Type
- 7.2.1.
- 7.1. Market Analysis, Insights and Forecast - by Application
- 8. undefined Parallel Uninterruptible Power Supply Analysis, Insights and Forecast, 2020-2032
- 8.1. Market Analysis, Insights and Forecast - by Application
- 8.1.1.
- 8.2. Market Analysis, Insights and Forecast - by Type
- 8.2.1.
- 8.1. Market Analysis, Insights and Forecast - by Application
- 9. undefined Parallel Uninterruptible Power Supply Analysis, Insights and Forecast, 2020-2032
- 9.1. Market Analysis, Insights and Forecast - by Application
- 9.1.1.
- 9.2. Market Analysis, Insights and Forecast - by Type
- 9.2.1.
- 9.1. Market Analysis, Insights and Forecast - by Application
- 10. undefined Parallel Uninterruptible Power Supply Analysis, Insights and Forecast, 2020-2032
- 10.1. Market Analysis, Insights and Forecast - by Application
- 10.1.1.
- 10.2. Market Analysis, Insights and Forecast - by Type
- 10.2.1.
- 10.1. Market Analysis, Insights and Forecast - by Application
- 11. Competitive Analysis
- 11.1. Global Market Share Analysis 2025
- 11.2. Company Profiles
- 11.2.1 ABB
- 11.2.1.1. Overview
- 11.2.1.2. Products
- 11.2.1.3. SWOT Analysis
- 11.2.1.4. Recent Developments
- 11.2.1.5. Financials (Based on Availability)
- 11.2.2 Siemens
- 11.2.2.1. Overview
- 11.2.2.2. Products
- 11.2.2.3. SWOT Analysis
- 11.2.2.4. Recent Developments
- 11.2.2.5. Financials (Based on Availability)
- 11.2.3 EATON
- 11.2.3.1. Overview
- 11.2.3.2. Products
- 11.2.3.3. SWOT Analysis
- 11.2.3.4. Recent Developments
- 11.2.3.5. Financials (Based on Availability)
- 11.2.4 TOSHIBA CORPORATION
- 11.2.4.1. Overview
- 11.2.4.2. Products
- 11.2.4.3. SWOT Analysis
- 11.2.4.4. Recent Developments
- 11.2.4.5. Financials (Based on Availability)
- 11.2.5 J. Schneider Elektrotechnik
- 11.2.5.1. Overview
- 11.2.5.2. Products
- 11.2.5.3. SWOT Analysis
- 11.2.5.4. Recent Developments
- 11.2.5.5. Financials (Based on Availability)
- 11.2.6 AEG Power Solutions B.V.
- 11.2.6.1. Overview
- 11.2.6.2. Products
- 11.2.6.3. SWOT Analysis
- 11.2.6.4. Recent Developments
- 11.2.6.5. Financials (Based on Availability)
- 11.2.7 Emerson Electric Co.
- 11.2.7.1. Overview
- 11.2.7.2. Products
- 11.2.7.3. SWOT Analysis
- 11.2.7.4. Recent Developments
- 11.2.7.5. Financials (Based on Availability)
- 11.2.8 Socomec
- 11.2.8.1. Overview
- 11.2.8.2. Products
- 11.2.8.3. SWOT Analysis
- 11.2.8.4. Recent Developments
- 11.2.8.5. Financials (Based on Availability)
- 11.2.9 SALICRU
- 11.2.9.1. Overview
- 11.2.9.2. Products
- 11.2.9.3. SWOT Analysis
- 11.2.9.4. Recent Developments
- 11.2.9.5. Financials (Based on Availability)
- 11.2.10 RIELLO UPS
- 11.2.10.1. Overview
- 11.2.10.2. Products
- 11.2.10.3. SWOT Analysis
- 11.2.10.4. Recent Developments
- 11.2.10.5. Financials (Based on Availability)
- 11.2.11 Benning
- 11.2.11.1. Overview
- 11.2.11.2. Products
- 11.2.11.3. SWOT Analysis
- 11.2.11.4. Recent Developments
- 11.2.11.5. Financials (Based on Availability)
- 11.2.12 GTEC FRANCE
- 11.2.12.1. Overview
- 11.2.12.2. Products
- 11.2.12.3. SWOT Analysis
- 11.2.12.4. Recent Developments
- 11.2.12.5. Financials (Based on Availability)
- 11.2.13 INVT Electric
- 11.2.13.1. Overview
- 11.2.13.2. Products
- 11.2.13.3. SWOT Analysis
- 11.2.13.4. Recent Developments
- 11.2.13.5. Financials (Based on Availability)
- 11.2.14 Shenzhen CONSNANT Technology Co. Ltd.
- 11.2.14.1. Overview
- 11.2.14.2. Products
- 11.2.14.3. SWOT Analysis
- 11.2.14.4. Recent Developments
- 11.2.14.5. Financials (Based on Availability)
- 11.2.15 Saft Power Systems
- 11.2.15.1. Overview
- 11.2.15.2. Products
- 11.2.15.3. SWOT Analysis
- 11.2.15.4. Recent Developments
- 11.2.15.5. Financials (Based on Availability)
- 11.2.16 Wärtsilä
- 11.2.16.1. Overview
- 11.2.16.2. Products
- 11.2.16.3. SWOT Analysis
- 11.2.16.4. Recent Developments
- 11.2.16.5. Financials (Based on Availability)
- 11.2.17 Block Transformatoren-Elektronik
- 11.2.17.1. Overview
- 11.2.17.2. Products
- 11.2.17.3. SWOT Analysis
- 11.2.17.4. Recent Developments
- 11.2.17.5. Financials (Based on Availability)
- 11.2.18 CHLORIDE POWER PROTECTION
- 11.2.18.1. Overview
- 11.2.18.2. Products
- 11.2.18.3. SWOT Analysis
- 11.2.18.4. Recent Developments
- 11.2.18.5. Financials (Based on Availability)
- 11.2.19 GE
- 11.2.19.1. Overview
- 11.2.19.2. Products
- 11.2.19.3. SWOT Analysis
- 11.2.19.4. Recent Developments
- 11.2.19.5. Financials (Based on Availability)
- 11.2.1 ABB
List of Figures
- Figure 1: Global Parallel Uninterruptible Power Supply Revenue Breakdown (billion, %) by Region 2025 & 2033
- Figure 2: Global Parallel Uninterruptible Power Supply Volume Breakdown (K, %) by Region 2025 & 2033
- Figure 3: undefined Parallel Uninterruptible Power Supply Revenue (billion), by Application 2025 & 2033
- Figure 4: undefined Parallel Uninterruptible Power Supply Volume (K), by Application 2025 & 2033
- Figure 5: undefined Parallel Uninterruptible Power Supply Revenue Share (%), by Application 2025 & 2033
- Figure 6: undefined Parallel Uninterruptible Power Supply Volume Share (%), by Application 2025 & 2033
- Figure 7: undefined Parallel Uninterruptible Power Supply Revenue (billion), by Type 2025 & 2033
- Figure 8: undefined Parallel Uninterruptible Power Supply Volume (K), by Type 2025 & 2033
- Figure 9: undefined Parallel Uninterruptible Power Supply Revenue Share (%), by Type 2025 & 2033
- Figure 10: undefined Parallel Uninterruptible Power Supply Volume Share (%), by Type 2025 & 2033
- Figure 11: undefined Parallel Uninterruptible Power Supply Revenue (billion), by Country 2025 & 2033
- Figure 12: undefined Parallel Uninterruptible Power Supply Volume (K), by Country 2025 & 2033
- Figure 13: undefined Parallel Uninterruptible Power Supply Revenue Share (%), by Country 2025 & 2033
- Figure 14: undefined Parallel Uninterruptible Power Supply Volume Share (%), by Country 2025 & 2033
- Figure 15: undefined Parallel Uninterruptible Power Supply Revenue (billion), by Application 2025 & 2033
- Figure 16: undefined Parallel Uninterruptible Power Supply Volume (K), by Application 2025 & 2033
- Figure 17: undefined Parallel Uninterruptible Power Supply Revenue Share (%), by Application 2025 & 2033
- Figure 18: undefined Parallel Uninterruptible Power Supply Volume Share (%), by Application 2025 & 2033
- Figure 19: undefined Parallel Uninterruptible Power Supply Revenue (billion), by Type 2025 & 2033
- Figure 20: undefined Parallel Uninterruptible Power Supply Volume (K), by Type 2025 & 2033
- Figure 21: undefined Parallel Uninterruptible Power Supply Revenue Share (%), by Type 2025 & 2033
- Figure 22: undefined Parallel Uninterruptible Power Supply Volume Share (%), by Type 2025 & 2033
- Figure 23: undefined Parallel Uninterruptible Power Supply Revenue (billion), by Country 2025 & 2033
- Figure 24: undefined Parallel Uninterruptible Power Supply Volume (K), by Country 2025 & 2033
- Figure 25: undefined Parallel Uninterruptible Power Supply Revenue Share (%), by Country 2025 & 2033
- Figure 26: undefined Parallel Uninterruptible Power Supply Volume Share (%), by Country 2025 & 2033
- Figure 27: undefined Parallel Uninterruptible Power Supply Revenue (billion), by Application 2025 & 2033
- Figure 28: undefined Parallel Uninterruptible Power Supply Volume (K), by Application 2025 & 2033
- Figure 29: undefined Parallel Uninterruptible Power Supply Revenue Share (%), by Application 2025 & 2033
- Figure 30: undefined Parallel Uninterruptible Power Supply Volume Share (%), by Application 2025 & 2033
- Figure 31: undefined Parallel Uninterruptible Power Supply Revenue (billion), by Type 2025 & 2033
- Figure 32: undefined Parallel Uninterruptible Power Supply Volume (K), by Type 2025 & 2033
- Figure 33: undefined Parallel Uninterruptible Power Supply Revenue Share (%), by Type 2025 & 2033
- Figure 34: undefined Parallel Uninterruptible Power Supply Volume Share (%), by Type 2025 & 2033
- Figure 35: undefined Parallel Uninterruptible Power Supply Revenue (billion), by Country 2025 & 2033
- Figure 36: undefined Parallel Uninterruptible Power Supply Volume (K), by Country 2025 & 2033
- Figure 37: undefined Parallel Uninterruptible Power Supply Revenue Share (%), by Country 2025 & 2033
- Figure 38: undefined Parallel Uninterruptible Power Supply Volume Share (%), by Country 2025 & 2033
- Figure 39: undefined Parallel Uninterruptible Power Supply Revenue (billion), by Application 2025 & 2033
- Figure 40: undefined Parallel Uninterruptible Power Supply Volume (K), by Application 2025 & 2033
- Figure 41: undefined Parallel Uninterruptible Power Supply Revenue Share (%), by Application 2025 & 2033
- Figure 42: undefined Parallel Uninterruptible Power Supply Volume Share (%), by Application 2025 & 2033
- Figure 43: undefined Parallel Uninterruptible Power Supply Revenue (billion), by Type 2025 & 2033
- Figure 44: undefined Parallel Uninterruptible Power Supply Volume (K), by Type 2025 & 2033
- Figure 45: undefined Parallel Uninterruptible Power Supply Revenue Share (%), by Type 2025 & 2033
- Figure 46: undefined Parallel Uninterruptible Power Supply Volume Share (%), by Type 2025 & 2033
- Figure 47: undefined Parallel Uninterruptible Power Supply Revenue (billion), by Country 2025 & 2033
- Figure 48: undefined Parallel Uninterruptible Power Supply Volume (K), by Country 2025 & 2033
- Figure 49: undefined Parallel Uninterruptible Power Supply Revenue Share (%), by Country 2025 & 2033
- Figure 50: undefined Parallel Uninterruptible Power Supply Volume Share (%), by Country 2025 & 2033
- Figure 51: undefined Parallel Uninterruptible Power Supply Revenue (billion), by Application 2025 & 2033
- Figure 52: undefined Parallel Uninterruptible Power Supply Volume (K), by Application 2025 & 2033
- Figure 53: undefined Parallel Uninterruptible Power Supply Revenue Share (%), by Application 2025 & 2033
- Figure 54: undefined Parallel Uninterruptible Power Supply Volume Share (%), by Application 2025 & 2033
- Figure 55: undefined Parallel Uninterruptible Power Supply Revenue (billion), by Type 2025 & 2033
- Figure 56: undefined Parallel Uninterruptible Power Supply Volume (K), by Type 2025 & 2033
- Figure 57: undefined Parallel Uninterruptible Power Supply Revenue Share (%), by Type 2025 & 2033
- Figure 58: undefined Parallel Uninterruptible Power Supply Volume Share (%), by Type 2025 & 2033
- Figure 59: undefined Parallel Uninterruptible Power Supply Revenue (billion), by Country 2025 & 2033
- Figure 60: undefined Parallel Uninterruptible Power Supply Volume (K), by Country 2025 & 2033
- Figure 61: undefined Parallel Uninterruptible Power Supply Revenue Share (%), by Country 2025 & 2033
- Figure 62: undefined Parallel Uninterruptible Power Supply Volume Share (%), by Country 2025 & 2033
List of Tables
- Table 1: Global Parallel Uninterruptible Power Supply Revenue billion Forecast, by Application 2020 & 2033
- Table 2: Global Parallel Uninterruptible Power Supply Volume K Forecast, by Application 2020 & 2033
- Table 3: Global Parallel Uninterruptible Power Supply Revenue billion Forecast, by Type 2020 & 2033
- Table 4: Global Parallel Uninterruptible Power Supply Volume K Forecast, by Type 2020 & 2033
- Table 5: Global Parallel Uninterruptible Power Supply Revenue billion Forecast, by Region 2020 & 2033
- Table 6: Global Parallel Uninterruptible Power Supply Volume K Forecast, by Region 2020 & 2033
- Table 7: Global Parallel Uninterruptible Power Supply Revenue billion Forecast, by Application 2020 & 2033
- Table 8: Global Parallel Uninterruptible Power Supply Volume K Forecast, by Application 2020 & 2033
- Table 9: Global Parallel Uninterruptible Power Supply Revenue billion Forecast, by Type 2020 & 2033
- Table 10: Global Parallel Uninterruptible Power Supply Volume K Forecast, by Type 2020 & 2033
- Table 11: Global Parallel Uninterruptible Power Supply Revenue billion Forecast, by Country 2020 & 2033
- Table 12: Global Parallel Uninterruptible Power Supply Volume K Forecast, by Country 2020 & 2033
- Table 13: Global Parallel Uninterruptible Power Supply Revenue billion Forecast, by Application 2020 & 2033
- Table 14: Global Parallel Uninterruptible Power Supply Volume K Forecast, by Application 2020 & 2033
- Table 15: Global Parallel Uninterruptible Power Supply Revenue billion Forecast, by Type 2020 & 2033
- Table 16: Global Parallel Uninterruptible Power Supply Volume K Forecast, by Type 2020 & 2033
- Table 17: Global Parallel Uninterruptible Power Supply Revenue billion Forecast, by Country 2020 & 2033
- Table 18: Global Parallel Uninterruptible Power Supply Volume K Forecast, by Country 2020 & 2033
- Table 19: Global Parallel Uninterruptible Power Supply Revenue billion Forecast, by Application 2020 & 2033
- Table 20: Global Parallel Uninterruptible Power Supply Volume K Forecast, by Application 2020 & 2033
- Table 21: Global Parallel Uninterruptible Power Supply Revenue billion Forecast, by Type 2020 & 2033
- Table 22: Global Parallel Uninterruptible Power Supply Volume K Forecast, by Type 2020 & 2033
- Table 23: Global Parallel Uninterruptible Power Supply Revenue billion Forecast, by Country 2020 & 2033
- Table 24: Global Parallel Uninterruptible Power Supply Volume K Forecast, by Country 2020 & 2033
- Table 25: Global Parallel Uninterruptible Power Supply Revenue billion Forecast, by Application 2020 & 2033
- Table 26: Global Parallel Uninterruptible Power Supply Volume K Forecast, by Application 2020 & 2033
- Table 27: Global Parallel Uninterruptible Power Supply Revenue billion Forecast, by Type 2020 & 2033
- Table 28: Global Parallel Uninterruptible Power Supply Volume K Forecast, by Type 2020 & 2033
- Table 29: Global Parallel Uninterruptible Power Supply Revenue billion Forecast, by Country 2020 & 2033
- Table 30: Global Parallel Uninterruptible Power Supply Volume K Forecast, by Country 2020 & 2033
- Table 31: Global Parallel Uninterruptible Power Supply Revenue billion Forecast, by Application 2020 & 2033
- Table 32: Global Parallel Uninterruptible Power Supply Volume K Forecast, by Application 2020 & 2033
- Table 33: Global Parallel Uninterruptible Power Supply Revenue billion Forecast, by Type 2020 & 2033
- Table 34: Global Parallel Uninterruptible Power Supply Volume K Forecast, by Type 2020 & 2033
- Table 35: Global Parallel Uninterruptible Power Supply Revenue billion Forecast, by Country 2020 & 2033
- Table 36: Global Parallel Uninterruptible Power Supply Volume K Forecast, by Country 2020 & 2033
Frequently Asked Questions
1. What is the projected Compound Annual Growth Rate (CAGR) of the Parallel Uninterruptible Power Supply?
The projected CAGR is approximately 5.6%.
2. Which companies are prominent players in the Parallel Uninterruptible Power Supply?
Key companies in the market include ABB, Siemens, EATON, TOSHIBA CORPORATION, J. Schneider Elektrotechnik, AEG Power Solutions B.V.,, Emerson Electric Co., Socomec, SALICRU, RIELLO UPS, Benning, GTEC FRANCE, INVT Electric, Shenzhen CONSNANT Technology Co., Ltd., Saft Power Systems, Wärtsilä, Block Transformatoren-Elektronik, CHLORIDE POWER PROTECTION, GE.
3. What are the main segments of the Parallel Uninterruptible Power Supply?
The market segments include Application, Type.
4. Can you provide details about the market size?
The market size is estimated to be USD 12.7 billion as of 2022.
5. What are some drivers contributing to market growth?
N/A
6. What are the notable trends driving market growth?
N/A
7. Are there any restraints impacting market growth?
N/A
8. Can you provide examples of recent developments in the market?
N/A
9. What pricing options are available for accessing the report?
Pricing options include single-user, multi-user, and enterprise licenses priced at USD 3950.00, USD 5925.00, and USD 7900.00 respectively.
10. Is the market size provided in terms of value or volume?
The market size is provided in terms of value, measured in billion and volume, measured in K.
11. Are there any specific market keywords associated with the report?
Yes, the market keyword associated with the report is "Parallel Uninterruptible Power Supply," which aids in identifying and referencing the specific market segment covered.
12. How do I determine which pricing option suits my needs best?
The pricing options vary based on user requirements and access needs. Individual users may opt for single-user licenses, while businesses requiring broader access may choose multi-user or enterprise licenses for cost-effective access to the report.
13. Are there any additional resources or data provided in the Parallel Uninterruptible Power Supply report?
While the report offers comprehensive insights, it's advisable to review the specific contents or supplementary materials provided to ascertain if additional resources or data are available.
14. How can I stay updated on further developments or reports in the Parallel Uninterruptible Power Supply?
To stay informed about further developments, trends, and reports in the Parallel Uninterruptible Power Supply, consider subscribing to industry newsletters, following relevant companies and organizations, or regularly checking reputable industry news sources and publications.
Methodology
Step 1 - Identification of Relevant Samples Size from Population Database


Step 2 - Approaches for Defining Global Market Size (Value, Volume* & Price*)

Note*: In applicable scenarios
Step 3 - Data Sources
Primary Research
- Web Analytics
- Survey Reports
- Research Institute
- Latest Research Reports
- Opinion Leaders
Secondary Research
- Annual Reports
- White Paper
- Latest Press Release
- Industry Association
- Paid Database
- Investor Presentations

Step 4 - Data Triangulation
Involves using different sources of information in order to increase the validity of a study
These sources are likely to be stakeholders in a program - participants, other researchers, program staff, other community members, and so on.
Then we put all data in single framework & apply various statistical tools to find out the dynamic on the market.
During the analysis stage, feedback from the stakeholder groups would be compared to determine areas of agreement as well as areas of divergence

