Key Insights
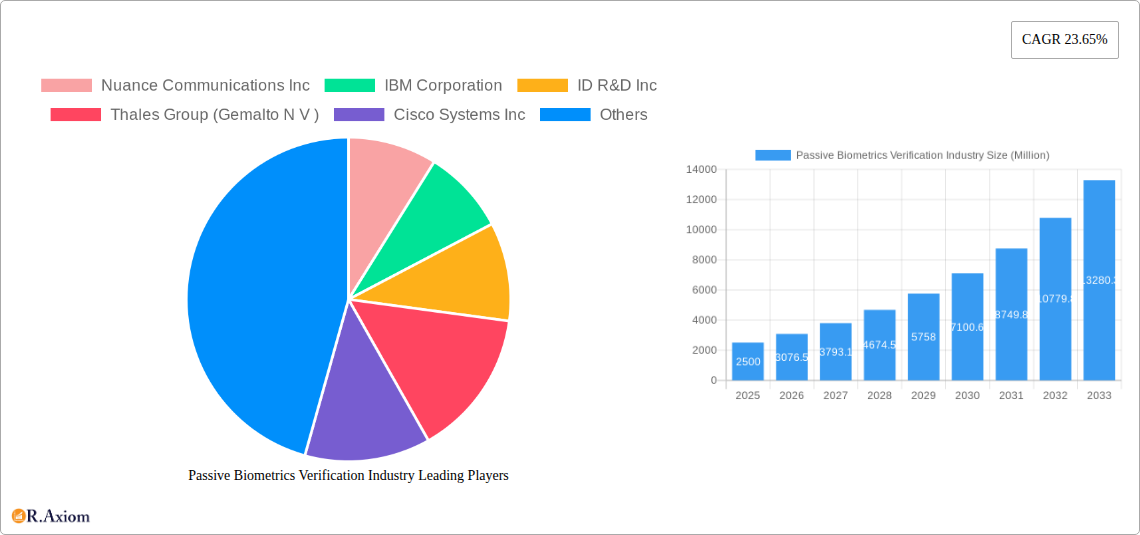
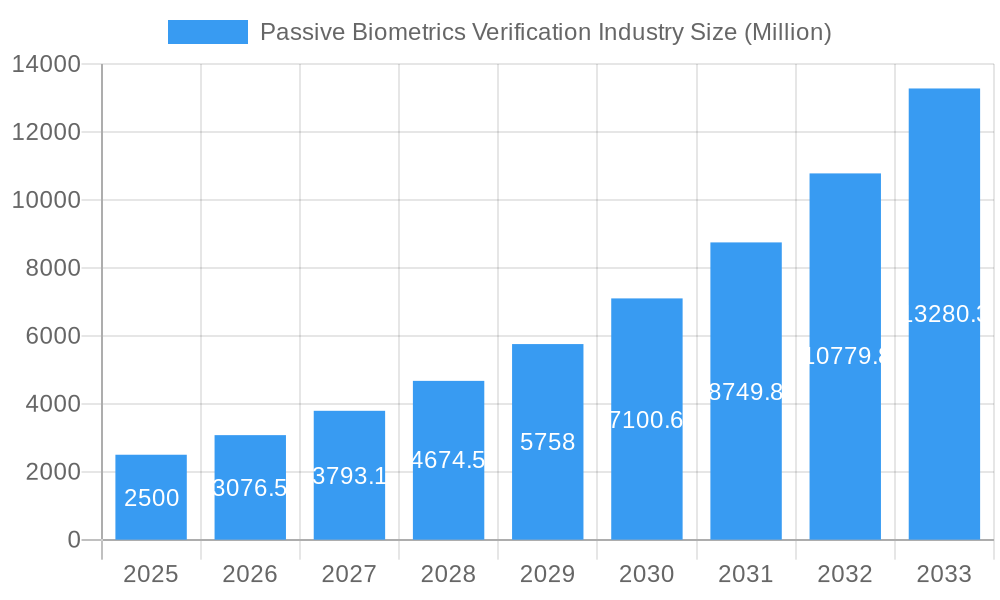
The Passive Biometrics Verification industry is poised for explosive growth, driven by an escalating demand for enhanced security and seamless user experiences across diverse sectors. With a projected market size of approximately $2.5 billion in 2025 and an impressive Compound Annual Growth Rate (CAGR) of 23.65%, the market is expected to reach substantial valuations by 2033. This rapid expansion is fueled by the inherent advantages of passive biometrics, which offer continuous, unobtrusive authentication without requiring user intervention, thereby combating sophisticated fraud and enhancing operational efficiency. Key drivers include the rising incidence of identity theft and cyberattacks, the increasing adoption of cloud-based solutions for scalability and accessibility, and the burgeoning need for frictionless authentication in mobile banking, e-commerce, and remote work environments. The integration of advanced technologies like AI and machine learning is further bolstering the accuracy and reliability of passive biometric systems, making them a preferred choice for businesses seeking robust yet user-friendly security measures.
Passive Biometrics Verification Industry Market Size (In Billion)
The market segmentation reveals a dynamic landscape, with software and services emerging as critical components contributing to the overall market value. Cloud deployment is witnessing significant traction over on-premises solutions, indicating a strategic shift towards flexible and cost-effective infrastructure. Major end-user industries such as BFSI, Retail, IT and Telecom, Healthcare, and Government are actively investing in passive biometrics to fortify their security perimeters and improve customer engagement. Geographically, North America and Europe are leading the adoption curve due to their mature digital ecosystems and stringent regulatory frameworks. However, the Asia Pacific region is anticipated to exhibit the fastest growth, driven by rapid digitalization, increasing smartphone penetration, and a growing awareness of cybersecurity threats. Companies like Nuance Communications Inc., IBM Corporation, and Thales Group (Gemalto N V) are at the forefront, innovating and expanding their offerings to cater to the evolving needs of this burgeoning market. The competitive landscape is characterized by strategic partnerships, mergers, and acquisitions aimed at consolidating market share and expanding technological capabilities.
Passive Biometrics Verification Industry Company Market Share
This comprehensive report offers an in-depth analysis of the global Passive Biometrics Verification market, encompassing historical data from 2019 to 2024, a base year of 2025, and an extensive forecast period from 2025 to 2033. With a focus on high-traffic keywords such as "passive biometrics," "biometric authentication," "continuous authentication," "behavioral biometrics," "voice biometrics," and "user authentication," this report is designed to provide actionable insights for industry stakeholders, investors, and strategic decision-makers.
This report analyzes the market concentration and innovation landscape within the passive biometrics verification industry. The market is characterized by a moderate level of concentration, with key players like Nuance Communications Inc., IBM Corporation, ID R&D Inc., Thales Group (Gemalto N.V.), and Cisco Systems Inc. investing heavily in research and development to drive innovation. Innovation is primarily fueled by advancements in artificial intelligence (AI) and machine learning (ML) algorithms for more accurate and robust behavioral and voice biometrics. Regulatory frameworks, such as GDPR and CCPA, are increasingly influencing the adoption of privacy-preserving biometric solutions. Product substitutes, including multi-factor authentication (MFA) and password managers, continue to present a competitive challenge, though passive biometrics offers a more seamless user experience. End-user trends are leaning towards frictionless and continuous authentication methods across various sectors. Mergers and acquisitions (M&A) activity, valued at approximately $1,500 Million in the historical period, signifies consolidation and strategic expansion. For instance, the acquisition of [Company Name, placeholder] by [Acquiring Company, placeholder] for an estimated $300 Million demonstrates the industry's drive for synergy and market dominance.
Passive Biometrics Verification Industry Industry Trends & Insights
The global Passive Biometrics Verification market is experiencing robust growth, driven by the escalating demand for enhanced security and a seamless user experience across digital platforms. The market is projected to grow at a Compound Annual Growth Rate (CAGR) of approximately 18.5% from 2025 to 2033. This significant expansion is underpinned by several key factors. Firstly, the burgeoning threat landscape of cyberattacks and data breaches necessitates advanced authentication methods beyond traditional passwords. Passive biometrics, which verifies identity without active user intervention, addresses this by continuously monitoring user behavior and device interactions, offering a layer of security that is both strong and unobtrusive. The increasing adoption of cloud-based solutions is another major catalyst, providing scalability, flexibility, and cost-effectiveness for businesses implementing passive biometric systems. Market penetration is steadily increasing, particularly within the BFSI and IT & Telecom sectors, where the stakes for data security are highest. Consumer preferences are shifting towards passwordless authentication and frictionless access, which passive biometrics effectively delivers by leveraging unique biological and behavioral characteristics. Technological disruptions, including advancements in AI and machine learning for sophisticated fraud detection and user profiling, are continually enhancing the accuracy and reliability of passive biometric systems. The competitive dynamics are characterized by innovation-led strategies, with companies focusing on improving accuracy, reducing false positives, and expanding the range of biometric modalities supported. The growing reliance on mobile devices for transactions and communication further fuels the need for unobtrusive and efficient authentication, making passive biometrics an ideal solution. For example, the integration of voice and gait analysis in mobile banking applications is significantly improving security and user satisfaction. The market penetration is expected to reach approximately 45% within the BFSI sector by 2033.
Dominant Markets & Segments in Passive Biometrics Verification Industry
The passive biometrics verification industry exhibits distinct dominance across various geographical regions, deployment types, and end-user industries, driven by a confluence of economic policies, technological infrastructure, and evolving security demands.
Leading Region: North America currently leads the passive biometrics verification market due to its advanced technological infrastructure, high disposable income, and stringent data security regulations. The United States, in particular, is a major hub for innovation and adoption, with a strong presence of key market players and a high concentration of BFSI and IT & Telecom organizations investing in robust security solutions. Government initiatives promoting digital transformation and cybersecurity further bolster the market's growth in this region. The market size in North America is estimated to reach approximately $15,000 Million by 2033.
Component Dominance:
- Software: The software segment holds a significant market share, estimated at around 65%, driven by the development of sophisticated algorithms for behavioral analysis, voice recognition, and keystroke dynamics. Companies are continuously investing in AI and ML-powered software solutions to enhance accuracy and detect sophisticated fraud patterns.
- Services: The services segment, encompassing implementation, integration, and maintenance, is also crucial, with an estimated market share of 35%. The increasing complexity of biometric systems and the need for specialized expertise drive the demand for professional services.
Deployment Type Dominance:
- Cloud: Cloud deployment is gaining substantial traction, projected to capture over 70% of the market by 2033. The scalability, cost-efficiency, and remote accessibility offered by cloud platforms make them highly attractive for businesses of all sizes.
- On-premises: While declining in market share, on-premises solutions remain relevant for organizations with highly sensitive data or strict regulatory compliance requirements.
End-User Industry Dominance:
- BFSI (Banking, Financial Services, and Insurance): This sector is the largest adopter of passive biometrics verification, accounting for an estimated 40% of the market. The need to combat financial fraud, ensure secure online transactions, and comply with stringent regulations makes passive biometrics an indispensable security layer. Key drivers include the proliferation of mobile banking, online trading platforms, and the increasing volume of digital transactions.
- IT and Telecom: This sector follows closely, driven by the need to secure access to vast amounts of sensitive data and protect against sophisticated cyber threats. The rise of remote work and cloud computing further amplifies the demand for continuous authentication solutions.
- Retail: The retail sector is witnessing a significant surge in adoption, particularly for enhancing customer experience through personalized services and securing online and in-store transactions.
- Healthcare: Increasing adoption in healthcare is driven by the need to protect patient data privacy and ensure secure access to electronic health records (EHRs).
- Government: Government agencies are increasingly leveraging passive biometrics for secure access to sensitive systems and to enhance national security.
Passive Biometrics Verification Industry Product Developments
Recent product developments in the passive biometrics verification industry are heavily focused on enhancing accuracy, expanding biometric modalities, and improving user experience. Innovations include advanced AI-driven behavioral analytics for continuous authentication, more sophisticated voice recognition systems capable of distinguishing subtle vocal nuances, and the integration of gait and keystroke dynamics for multi-layered security. Companies are developing lightweight SDKs for seamless integration into mobile applications and web platforms. These advancements provide a significant competitive advantage by offering frictionless security, reducing reliance on passwords, and bolstering fraud detection capabilities in real-time.
Report Scope & Segmentation Analysis
This report meticulously segments the passive biometrics verification market across several key dimensions to provide granular insights. The Component segmentation includes Software and Services, with Software expected to lead due to ongoing advancements in AI and ML algorithms, and Services projected to grow steadily with increasing adoption complexity. The Deployment Type segmentation analyzes On-premises and Cloud. Cloud deployment is anticipated to dominate, driven by scalability and cost-effectiveness, while On-premises solutions will cater to specific niche requirements. The End-User Industry segmentation breaks down the market into BFSI, Retail, IT and Telecom, Healthcare, Government, and Other End-User Industries. BFSI is projected to maintain its leading position, followed by IT and Telecom, with significant growth expected in Retail and Healthcare due to increasing digitalization and security demands.
Key Drivers of Passive Biometrics Verification Industry Growth
The passive biometrics verification industry's growth is propelled by several critical factors. The escalating sophistication of cyber threats and data breaches is a primary driver, necessitating advanced, continuous authentication methods. The increasing demand for a frictionless and passwordless user experience across digital platforms is also a significant contributor. Furthermore, stringent regulatory compliance requirements in sectors like BFSI and healthcare are compelling organizations to adopt robust security measures. Technological advancements in AI and machine learning are continuously improving the accuracy and efficiency of biometric algorithms, making them more reliable and cost-effective. The growing adoption of remote work models and the expansion of the Internet of Things (IoT) ecosystem also present new avenues for passive biometric integration and growth.
Challenges in the Passive Biometrics Verification Industry Sector
Despite its promising growth trajectory, the passive biometrics verification industry faces several challenges. Regulatory hurdles related to data privacy and consent management, particularly in regions with strict data protection laws, can slow down adoption. The inherent potential for false positives and negatives, although decreasing with technological advancements, remains a concern for some sensitive applications. High initial implementation costs for large-scale deployments can be a barrier for smaller organizations. Furthermore, the need for continuous technological updates and the integration with legacy systems present significant operational complexities. Ensuring equitable performance across diverse demographics and mitigating potential bias in biometric algorithms also remain critical areas of focus.
Emerging Opportunities in Passive Biometrics Verification Industry
The passive biometrics verification industry is poised for significant growth fueled by emerging opportunities. The expanding IoT ecosystem presents a vast landscape for continuous authentication of devices and users, securing smart homes, smart cities, and industrial IoT applications. The integration of passive biometrics with augmented reality (AR) and virtual reality (VR) technologies offers new frontiers for immersive and secure user experiences. The development of multimodal biometric systems, combining different passive modalities like voice, gait, and keystroke dynamics, promises enhanced accuracy and resilience against spoofing. Furthermore, the increasing focus on digital identity and verifiable credentials opens doors for passive biometrics to play a crucial role in establishing and maintaining trusted digital identities.
Leading Players in the Passive Biometrics Verification Industry Market
Nuance Communications Inc. IBM Corporation ID R&D Inc. Thales Group (Gemalto N V ) Cisco Systems Inc Aware Inc. Pindrop Security Inc. Verint Systems Inc. OneSpan Inc. NEC Corporation Fortress Identity Equifax Inc. BioCatch Ltd.
Key Developments in Passive Biometrics Verification Industry Industry
- 2024 Q4: Nuance Communications Inc. announced a significant advancement in its behavioral biometrics engine, enhancing fraud detection accuracy by an estimated 20%.
- 2024 Q3: IBM Corporation partnered with a leading global bank to implement a continuous authentication solution, improving transaction security and user experience.
- 2024 Q2: ID R&D Inc. launched its next-generation voice biometrics SDK, offering improved liveness detection and language support.
- 2024 Q1: Thales Group (Gemalto N.V.) acquired [Placeholder Company Name] for an estimated $450 Million, strengthening its passive biometrics portfolio.
- 2023 Q4: Cisco Systems Inc. integrated its security solutions with behavioral biometrics to provide end-to-end endpoint security.
- 2023 Q3: Aware Inc. secured a contract with a government agency for the deployment of its passive biometric authentication platform.
- 2023 Q2: Pindrop Security Inc. released a new report highlighting a 30% reduction in call center fraud through the use of voice biometrics.
- 2023 Q1: Verint Systems Inc. expanded its fraud detection capabilities with enhanced passive biometric analysis.
- 2022 Q4: OneSpan Inc. introduced a new solution combining passive biometrics with document verification for enhanced onboarding security.
- 2022 Q3: NEC Corporation showcased its latest advancements in facial recognition technology for passive verification.
- 2022 Q2: BioCatch Ltd. reported a significant increase in the adoption of its behavioral biometrics platform by fintech companies.
Strategic Outlook for Passive Biometrics Verification Industry Market
The strategic outlook for the passive biometrics verification industry is exceptionally positive, driven by an ongoing demand for robust, user-friendly security solutions. The continued integration of AI and machine learning will be central to enhancing accuracy and expanding the scope of passive biometric modalities. Strategic partnerships between technology providers and end-user industries, particularly in BFSI and IT & Telecom, will be crucial for market penetration. The shift towards cloud-native solutions and the increasing adoption of passwordless authentication will further accelerate market growth. Emerging applications in areas like IoT, AR/VR, and digital identity management present significant untapped potential, positioning the passive biometrics verification market for sustained and substantial expansion over the next decade.
Passive Biometrics Verification Industry Segmentation
-
1. Component
- 1.1. Software
- 1.2. Services
-
2. Deployment Type
- 2.1. On-premises
- 2.2. Cloud
-
3. End-User Industry
- 3.1. BFSI
- 3.2. Retail
- 3.3. IT and Telecom
- 3.4. Helathcare
- 3.5. Government
- 3.6. Other End-User Inustries
Passive Biometrics Verification Industry Segmentation By Geography
- 1. North America
- 2. Europe
- 3. Asia Pacific
- 4. Latin America
- 5. Middle East and Africa
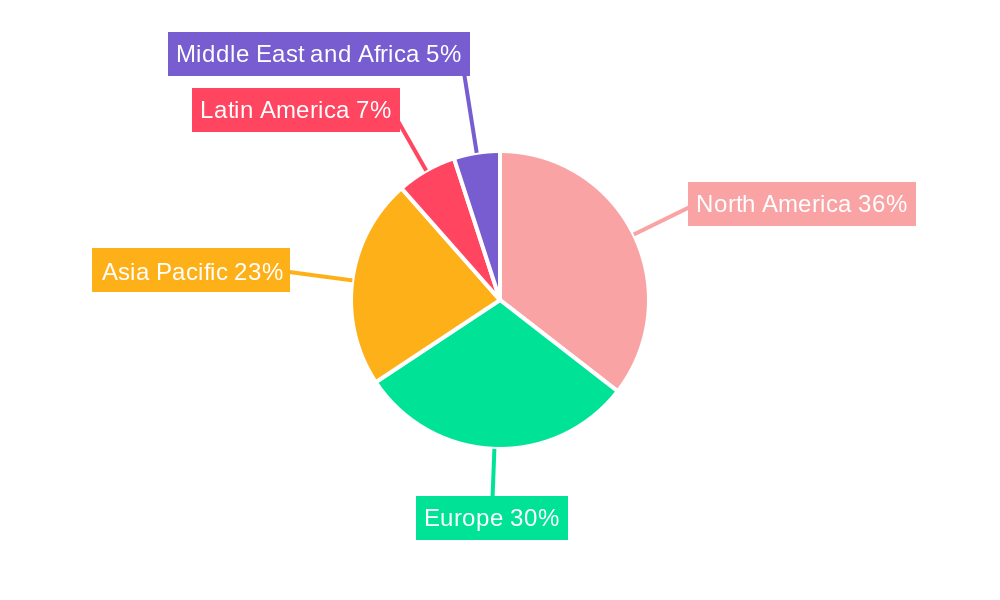
Passive Biometrics Verification Industry Regional Market Share
Geographic Coverage of Passive Biometrics Verification Industry
Passive Biometrics Verification Industry REPORT HIGHLIGHTS
| Aspects | Details |
|---|---|
| Study Period | 2020-2034 |
| Base Year | 2025 |
| Estimated Year | 2026 |
| Forecast Period | 2026-2034 |
| Historical Period | 2020-2025 |
| Growth Rate | CAGR of 15.4% from 2020-2034 |
| Segmentation |
|
Table of Contents
- 1. Introduction
- 1.1. Research Scope
- 1.2. Market Segmentation
- 1.3. Research Objective
- 1.4. Definitions and Assumptions
- 2. Executive Summary
- 2.1. Market Snapshot
- 3. Market Dynamics
- 3.1. Market Drivers
- 3.2. Market Restrains
- 3.3. Market Trends
- 3.4. Market Opportunities
- 4. Market Factor Analysis
- 4.1. Porters Five Forces
- 4.1.1. Bargaining Power of Suppliers
- 4.1.2. Bargaining Power of Buyers
- 4.1.3. Threat of New Entrants
- 4.1.4. Threat of Substitutes
- 4.1.5. Competitive Rivalry
- 4.2. PESTEL analysis
- 4.3. BCG Analysis
- 4.3.1. Stars (High Growth, High Market Share)
- 4.3.2. Cash Cows (Low Growth, High Market Share)
- 4.3.3. Question Mark (High Growth, Low Market Share)
- 4.3.4. Dogs (Low Growth, Low Market Share)
- 4.4. Ansoff Matrix Analysis
- 4.5. Supply Chain Analysis
- 4.6. Regulatory Landscape
- 4.7. Current Market Potential and Opportunity Assessment (TAM–SAM–SOM Framework)
- 4.8. RAX Analyst Note
- 4.1. Porters Five Forces
- 5. Market Analysis, Insights and Forecast 2021-2033
- 5.1. Market Analysis, Insights and Forecast - by Component
- 5.1.1. Software
- 5.1.2. Services
- 5.2. Market Analysis, Insights and Forecast - by Deployment Type
- 5.2.1. On-premises
- 5.2.2. Cloud
- 5.3. Market Analysis, Insights and Forecast - by End-User Industry
- 5.3.1. BFSI
- 5.3.2. Retail
- 5.3.3. IT and Telecom
- 5.3.4. Helathcare
- 5.3.5. Government
- 5.3.6. Other End-User Inustries
- 5.4. Market Analysis, Insights and Forecast - by Region
- 5.4.1. North America
- 5.4.2. Europe
- 5.4.3. Asia Pacific
- 5.4.4. Latin America
- 5.4.5. Middle East and Africa
- 5.1. Market Analysis, Insights and Forecast - by Component
- 6. Global Passive Biometrics Verification Industry Analysis, Insights and Forecast, 2021-2033
- 6.1. Market Analysis, Insights and Forecast - by Component
- 6.1.1. Software
- 6.1.2. Services
- 6.2. Market Analysis, Insights and Forecast - by Deployment Type
- 6.2.1. On-premises
- 6.2.2. Cloud
- 6.3. Market Analysis, Insights and Forecast - by End-User Industry
- 6.3.1. BFSI
- 6.3.2. Retail
- 6.3.3. IT and Telecom
- 6.3.4. Helathcare
- 6.3.5. Government
- 6.3.6. Other End-User Inustries
- 6.1. Market Analysis, Insights and Forecast - by Component
- 7. North America Passive Biometrics Verification Industry Analysis, Insights and Forecast, 2020-2032
- 7.1. Market Analysis, Insights and Forecast - by Component
- 7.1.1. Software
- 7.1.2. Services
- 7.2. Market Analysis, Insights and Forecast - by Deployment Type
- 7.2.1. On-premises
- 7.2.2. Cloud
- 7.3. Market Analysis, Insights and Forecast - by End-User Industry
- 7.3.1. BFSI
- 7.3.2. Retail
- 7.3.3. IT and Telecom
- 7.3.4. Helathcare
- 7.3.5. Government
- 7.3.6. Other End-User Inustries
- 7.1. Market Analysis, Insights and Forecast - by Component
- 8. Europe Passive Biometrics Verification Industry Analysis, Insights and Forecast, 2020-2032
- 8.1. Market Analysis, Insights and Forecast - by Component
- 8.1.1. Software
- 8.1.2. Services
- 8.2. Market Analysis, Insights and Forecast - by Deployment Type
- 8.2.1. On-premises
- 8.2.2. Cloud
- 8.3. Market Analysis, Insights and Forecast - by End-User Industry
- 8.3.1. BFSI
- 8.3.2. Retail
- 8.3.3. IT and Telecom
- 8.3.4. Helathcare
- 8.3.5. Government
- 8.3.6. Other End-User Inustries
- 8.1. Market Analysis, Insights and Forecast - by Component
- 9. Asia Pacific Passive Biometrics Verification Industry Analysis, Insights and Forecast, 2020-2032
- 9.1. Market Analysis, Insights and Forecast - by Component
- 9.1.1. Software
- 9.1.2. Services
- 9.2. Market Analysis, Insights and Forecast - by Deployment Type
- 9.2.1. On-premises
- 9.2.2. Cloud
- 9.3. Market Analysis, Insights and Forecast - by End-User Industry
- 9.3.1. BFSI
- 9.3.2. Retail
- 9.3.3. IT and Telecom
- 9.3.4. Helathcare
- 9.3.5. Government
- 9.3.6. Other End-User Inustries
- 9.1. Market Analysis, Insights and Forecast - by Component
- 10. Latin America Passive Biometrics Verification Industry Analysis, Insights and Forecast, 2020-2032
- 10.1. Market Analysis, Insights and Forecast - by Component
- 10.1.1. Software
- 10.1.2. Services
- 10.2. Market Analysis, Insights and Forecast - by Deployment Type
- 10.2.1. On-premises
- 10.2.2. Cloud
- 10.3. Market Analysis, Insights and Forecast - by End-User Industry
- 10.3.1. BFSI
- 10.3.2. Retail
- 10.3.3. IT and Telecom
- 10.3.4. Helathcare
- 10.3.5. Government
- 10.3.6. Other End-User Inustries
- 10.1. Market Analysis, Insights and Forecast - by Component
- 11. Middle East and Africa Passive Biometrics Verification Industry Analysis, Insights and Forecast, 2020-2032
- 11.1. Market Analysis, Insights and Forecast - by Component
- 11.1.1. Software
- 11.1.2. Services
- 11.2. Market Analysis, Insights and Forecast - by Deployment Type
- 11.2.1. On-premises
- 11.2.2. Cloud
- 11.3. Market Analysis, Insights and Forecast - by End-User Industry
- 11.3.1. BFSI
- 11.3.2. Retail
- 11.3.3. IT and Telecom
- 11.3.4. Helathcare
- 11.3.5. Government
- 11.3.6. Other End-User Inustries
- 11.1. Market Analysis, Insights and Forecast - by Component
- 12. Competitive Analysis
- 12.1. Company Profiles
- 12.1.1 Nuance Communications Inc
- 12.1.1.1. Company Overview
- 12.1.1.2. Products
- 12.1.1.3. Company Financials
- 12.1.1.4. SWOT Analysis
- 12.1.2 IBM Corporation
- 12.1.2.1. Company Overview
- 12.1.2.2. Products
- 12.1.2.3. Company Financials
- 12.1.2.4. SWOT Analysis
- 12.1.3 ID R&D Inc
- 12.1.3.1. Company Overview
- 12.1.3.2. Products
- 12.1.3.3. Company Financials
- 12.1.3.4. SWOT Analysis
- 12.1.4 Thales Group (Gemalto N V )
- 12.1.4.1. Company Overview
- 12.1.4.2. Products
- 12.1.4.3. Company Financials
- 12.1.4.4. SWOT Analysis
- 12.1.5 Cisco Systems Inc
- 12.1.5.1. Company Overview
- 12.1.5.2. Products
- 12.1.5.3. Company Financials
- 12.1.5.4. SWOT Analysis
- 12.1.6 Aware Inc
- 12.1.6.1. Company Overview
- 12.1.6.2. Products
- 12.1.6.3. Company Financials
- 12.1.6.4. SWOT Analysis
- 12.1.7 Pindrop Security Inc
- 12.1.7.1. Company Overview
- 12.1.7.2. Products
- 12.1.7.3. Company Financials
- 12.1.7.4. SWOT Analysis
- 12.1.8 Verint Systems Inc
- 12.1.8.1. Company Overview
- 12.1.8.2. Products
- 12.1.8.3. Company Financials
- 12.1.8.4. SWOT Analysis
- 12.1.9 OneSpan Inc
- 12.1.9.1. Company Overview
- 12.1.9.2. Products
- 12.1.9.3. Company Financials
- 12.1.9.4. SWOT Analysis
- 12.1.10 NEC Corporation
- 12.1.10.1. Company Overview
- 12.1.10.2. Products
- 12.1.10.3. Company Financials
- 12.1.10.4. SWOT Analysis
- 12.1.11 Fortress Identity*List Not Exhaustive
- 12.1.11.1. Company Overview
- 12.1.11.2. Products
- 12.1.11.3. Company Financials
- 12.1.11.4. SWOT Analysis
- 12.1.12 Equifax Inc
- 12.1.12.1. Company Overview
- 12.1.12.2. Products
- 12.1.12.3. Company Financials
- 12.1.12.4. SWOT Analysis
- 12.1.13 BioCatch Ltd
- 12.1.13.1. Company Overview
- 12.1.13.2. Products
- 12.1.13.3. Company Financials
- 12.1.13.4. SWOT Analysis
- 12.1.1 Nuance Communications Inc
- 12.2. Market Entropy
- 12.2.1 Company's Key Areas Served
- 12.2.2 Recent Developments
- 12.3. Company Market Share Analysis 2025
- 12.3.1 Top 5 Companies Market Share Analysis
- 12.3.2 Top 3 Companies Market Share Analysis
- 12.4. List of Potential Customers
- 13. Research Methodology
List of Figures
- Figure 1: Global Passive Biometrics Verification Industry Revenue Breakdown (billion, %) by Region 2025 & 2033
- Figure 2: North America Passive Biometrics Verification Industry Revenue (billion), by Component 2025 & 2033
- Figure 3: North America Passive Biometrics Verification Industry Revenue Share (%), by Component 2025 & 2033
- Figure 4: North America Passive Biometrics Verification Industry Revenue (billion), by Deployment Type 2025 & 2033
- Figure 5: North America Passive Biometrics Verification Industry Revenue Share (%), by Deployment Type 2025 & 2033
- Figure 6: North America Passive Biometrics Verification Industry Revenue (billion), by End-User Industry 2025 & 2033
- Figure 7: North America Passive Biometrics Verification Industry Revenue Share (%), by End-User Industry 2025 & 2033
- Figure 8: North America Passive Biometrics Verification Industry Revenue (billion), by Country 2025 & 2033
- Figure 9: North America Passive Biometrics Verification Industry Revenue Share (%), by Country 2025 & 2033
- Figure 10: Europe Passive Biometrics Verification Industry Revenue (billion), by Component 2025 & 2033
- Figure 11: Europe Passive Biometrics Verification Industry Revenue Share (%), by Component 2025 & 2033
- Figure 12: Europe Passive Biometrics Verification Industry Revenue (billion), by Deployment Type 2025 & 2033
- Figure 13: Europe Passive Biometrics Verification Industry Revenue Share (%), by Deployment Type 2025 & 2033
- Figure 14: Europe Passive Biometrics Verification Industry Revenue (billion), by End-User Industry 2025 & 2033
- Figure 15: Europe Passive Biometrics Verification Industry Revenue Share (%), by End-User Industry 2025 & 2033
- Figure 16: Europe Passive Biometrics Verification Industry Revenue (billion), by Country 2025 & 2033
- Figure 17: Europe Passive Biometrics Verification Industry Revenue Share (%), by Country 2025 & 2033
- Figure 18: Asia Pacific Passive Biometrics Verification Industry Revenue (billion), by Component 2025 & 2033
- Figure 19: Asia Pacific Passive Biometrics Verification Industry Revenue Share (%), by Component 2025 & 2033
- Figure 20: Asia Pacific Passive Biometrics Verification Industry Revenue (billion), by Deployment Type 2025 & 2033
- Figure 21: Asia Pacific Passive Biometrics Verification Industry Revenue Share (%), by Deployment Type 2025 & 2033
- Figure 22: Asia Pacific Passive Biometrics Verification Industry Revenue (billion), by End-User Industry 2025 & 2033
- Figure 23: Asia Pacific Passive Biometrics Verification Industry Revenue Share (%), by End-User Industry 2025 & 2033
- Figure 24: Asia Pacific Passive Biometrics Verification Industry Revenue (billion), by Country 2025 & 2033
- Figure 25: Asia Pacific Passive Biometrics Verification Industry Revenue Share (%), by Country 2025 & 2033
- Figure 26: Latin America Passive Biometrics Verification Industry Revenue (billion), by Component 2025 & 2033
- Figure 27: Latin America Passive Biometrics Verification Industry Revenue Share (%), by Component 2025 & 2033
- Figure 28: Latin America Passive Biometrics Verification Industry Revenue (billion), by Deployment Type 2025 & 2033
- Figure 29: Latin America Passive Biometrics Verification Industry Revenue Share (%), by Deployment Type 2025 & 2033
- Figure 30: Latin America Passive Biometrics Verification Industry Revenue (billion), by End-User Industry 2025 & 2033
- Figure 31: Latin America Passive Biometrics Verification Industry Revenue Share (%), by End-User Industry 2025 & 2033
- Figure 32: Latin America Passive Biometrics Verification Industry Revenue (billion), by Country 2025 & 2033
- Figure 33: Latin America Passive Biometrics Verification Industry Revenue Share (%), by Country 2025 & 2033
- Figure 34: Middle East and Africa Passive Biometrics Verification Industry Revenue (billion), by Component 2025 & 2033
- Figure 35: Middle East and Africa Passive Biometrics Verification Industry Revenue Share (%), by Component 2025 & 2033
- Figure 36: Middle East and Africa Passive Biometrics Verification Industry Revenue (billion), by Deployment Type 2025 & 2033
- Figure 37: Middle East and Africa Passive Biometrics Verification Industry Revenue Share (%), by Deployment Type 2025 & 2033
- Figure 38: Middle East and Africa Passive Biometrics Verification Industry Revenue (billion), by End-User Industry 2025 & 2033
- Figure 39: Middle East and Africa Passive Biometrics Verification Industry Revenue Share (%), by End-User Industry 2025 & 2033
- Figure 40: Middle East and Africa Passive Biometrics Verification Industry Revenue (billion), by Country 2025 & 2033
- Figure 41: Middle East and Africa Passive Biometrics Verification Industry Revenue Share (%), by Country 2025 & 2033
List of Tables
- Table 1: Global Passive Biometrics Verification Industry Revenue billion Forecast, by Component 2020 & 2033
- Table 2: Global Passive Biometrics Verification Industry Revenue billion Forecast, by Deployment Type 2020 & 2033
- Table 3: Global Passive Biometrics Verification Industry Revenue billion Forecast, by End-User Industry 2020 & 2033
- Table 4: Global Passive Biometrics Verification Industry Revenue billion Forecast, by Region 2020 & 2033
- Table 5: Global Passive Biometrics Verification Industry Revenue billion Forecast, by Component 2020 & 2033
- Table 6: Global Passive Biometrics Verification Industry Revenue billion Forecast, by Deployment Type 2020 & 2033
- Table 7: Global Passive Biometrics Verification Industry Revenue billion Forecast, by End-User Industry 2020 & 2033
- Table 8: Global Passive Biometrics Verification Industry Revenue billion Forecast, by Country 2020 & 2033
- Table 9: Global Passive Biometrics Verification Industry Revenue billion Forecast, by Component 2020 & 2033
- Table 10: Global Passive Biometrics Verification Industry Revenue billion Forecast, by Deployment Type 2020 & 2033
- Table 11: Global Passive Biometrics Verification Industry Revenue billion Forecast, by End-User Industry 2020 & 2033
- Table 12: Global Passive Biometrics Verification Industry Revenue billion Forecast, by Country 2020 & 2033
- Table 13: Global Passive Biometrics Verification Industry Revenue billion Forecast, by Component 2020 & 2033
- Table 14: Global Passive Biometrics Verification Industry Revenue billion Forecast, by Deployment Type 2020 & 2033
- Table 15: Global Passive Biometrics Verification Industry Revenue billion Forecast, by End-User Industry 2020 & 2033
- Table 16: Global Passive Biometrics Verification Industry Revenue billion Forecast, by Country 2020 & 2033
- Table 17: Global Passive Biometrics Verification Industry Revenue billion Forecast, by Component 2020 & 2033
- Table 18: Global Passive Biometrics Verification Industry Revenue billion Forecast, by Deployment Type 2020 & 2033
- Table 19: Global Passive Biometrics Verification Industry Revenue billion Forecast, by End-User Industry 2020 & 2033
- Table 20: Global Passive Biometrics Verification Industry Revenue billion Forecast, by Country 2020 & 2033
- Table 21: Global Passive Biometrics Verification Industry Revenue billion Forecast, by Component 2020 & 2033
- Table 22: Global Passive Biometrics Verification Industry Revenue billion Forecast, by Deployment Type 2020 & 2033
- Table 23: Global Passive Biometrics Verification Industry Revenue billion Forecast, by End-User Industry 2020 & 2033
- Table 24: Global Passive Biometrics Verification Industry Revenue billion Forecast, by Country 2020 & 2033
Frequently Asked Questions
1. What is the projected Compound Annual Growth Rate (CAGR) of the Passive Biometrics Verification Industry?
The projected CAGR is approximately 15.4%.
2. Which companies are prominent players in the Passive Biometrics Verification Industry?
Key companies in the market include Nuance Communications Inc, IBM Corporation, ID R&D Inc, Thales Group (Gemalto N V ), Cisco Systems Inc, Aware Inc, Pindrop Security Inc, Verint Systems Inc, OneSpan Inc, NEC Corporation, Fortress Identity*List Not Exhaustive, Equifax Inc, BioCatch Ltd.
3. What are the main segments of the Passive Biometrics Verification Industry?
The market segments include Component, Deployment Type, End-User Industry.
4. Can you provide details about the market size?
The market size is estimated to be USD 14.34 billion as of 2022.
5. What are some drivers contributing to market growth?
; Growing incidents related of fraud. scams. and data breach attacks; Rising need for better authentication systems to enhance the user experience.
6. What are the notable trends driving market growth?
BFSI is Expected Hold Significant Share.
7. Are there any restraints impacting market growth?
; Concerns related to privacy regarding actions running in the background.
8. Can you provide examples of recent developments in the market?
N/A
9. What pricing options are available for accessing the report?
Pricing options include single-user, multi-user, and enterprise licenses priced at USD 4750, USD 5250, and USD 8750 respectively.
10. Is the market size provided in terms of value or volume?
The market size is provided in terms of value, measured in billion.
11. Are there any specific market keywords associated with the report?
Yes, the market keyword associated with the report is "Passive Biometrics Verification Industry," which aids in identifying and referencing the specific market segment covered.
12. How do I determine which pricing option suits my needs best?
The pricing options vary based on user requirements and access needs. Individual users may opt for single-user licenses, while businesses requiring broader access may choose multi-user or enterprise licenses for cost-effective access to the report.
13. Are there any additional resources or data provided in the Passive Biometrics Verification Industry report?
While the report offers comprehensive insights, it's advisable to review the specific contents or supplementary materials provided to ascertain if additional resources or data are available.
14. How can I stay updated on further developments or reports in the Passive Biometrics Verification Industry?
To stay informed about further developments, trends, and reports in the Passive Biometrics Verification Industry, consider subscribing to industry newsletters, following relevant companies and organizations, or regularly checking reputable industry news sources and publications.
Methodology
Step 1 - Identification of Relevant Samples Size from Population Database


Step 2 - Approaches for Defining Global Market Size (Value, Volume* & Price*)

Note*: In applicable scenarios
Step 3 - Data Sources
Primary Research
- Web Analytics
- Survey Reports
- Research Institute
- Latest Research Reports
- Opinion Leaders
Secondary Research
- Annual Reports
- White Paper
- Latest Press Release
- Industry Association
- Paid Database
- Investor Presentations

Step 4 - Data Triangulation
Involves using different sources of information in order to increase the validity of a study
These sources are likely to be stakeholders in a program - participants, other researchers, program staff, other community members, and so on.
Then we put all data in single framework & apply various statistical tools to find out the dynamic on the market.
During the analysis stage, feedback from the stakeholder groups would be compared to determine areas of agreement as well as areas of divergence

