

Key Insights
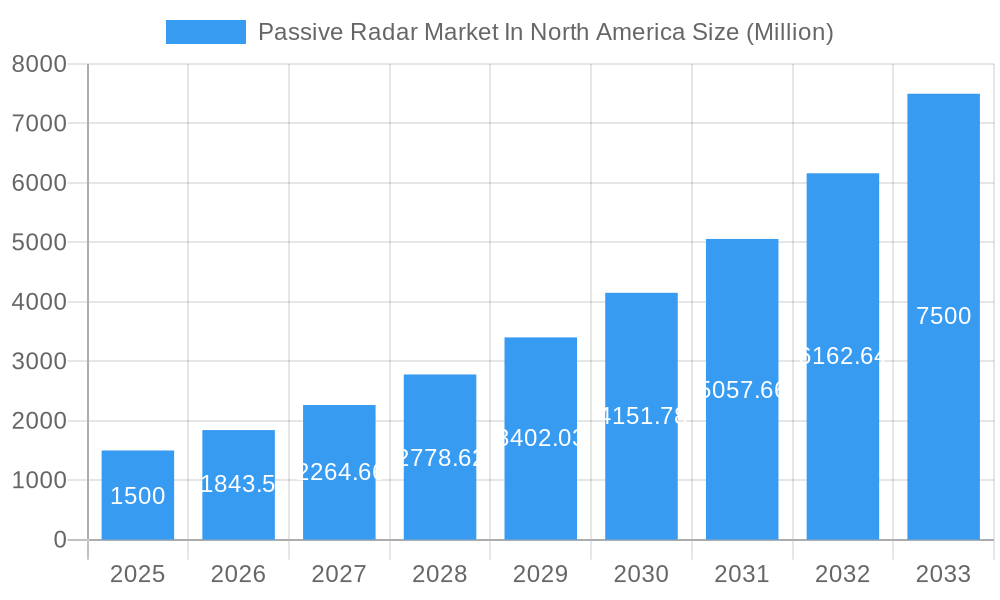
The North American passive radar market, covering the United States, Canada, and Mexico, is poised for significant expansion, driven by escalating demand for advanced surveillance capabilities across homeland security, civil aviation, and defense industries. This dynamic sector is projected to reach a market size of 14.25 million by 2033, exhibiting a compelling Compound Annual Growth Rate (CAGR) of 11.38% from the base year 2025. Key growth accelerators include the imperative for cost-effective and reliable surveillance, particularly for border security and airspace management, coupled with technological leaps in signal processing enhancing detection accuracy and range. Growing cybersecurity concerns also necessitate more sophisticated threat detection, further propelling adoption. The increasing integration of passive radar in civilian applications, such as air traffic management and disaster response, further solidifies its market trajectory.
Passive Radar Market In North America Market Size (In Million)
While market growth is robust, potential restraints such as high initial investment costs and integration complexities with existing infrastructure warrant consideration. However, continuous technological innovation, including the development of more compact and cost-efficient systems, alongside supportive government initiatives for national security and air traffic enhancement, are anticipated to overcome these barriers and sustain market expansion. Leading entities like Indra Sistemas SA, L3Harris Technologies Inc., and Leonardo SpA are instrumental in fostering innovation and competition. The North American region, characterized by substantial defense investments and advanced technological infrastructure, is expected to maintain its leadership in global passive radar adoption.
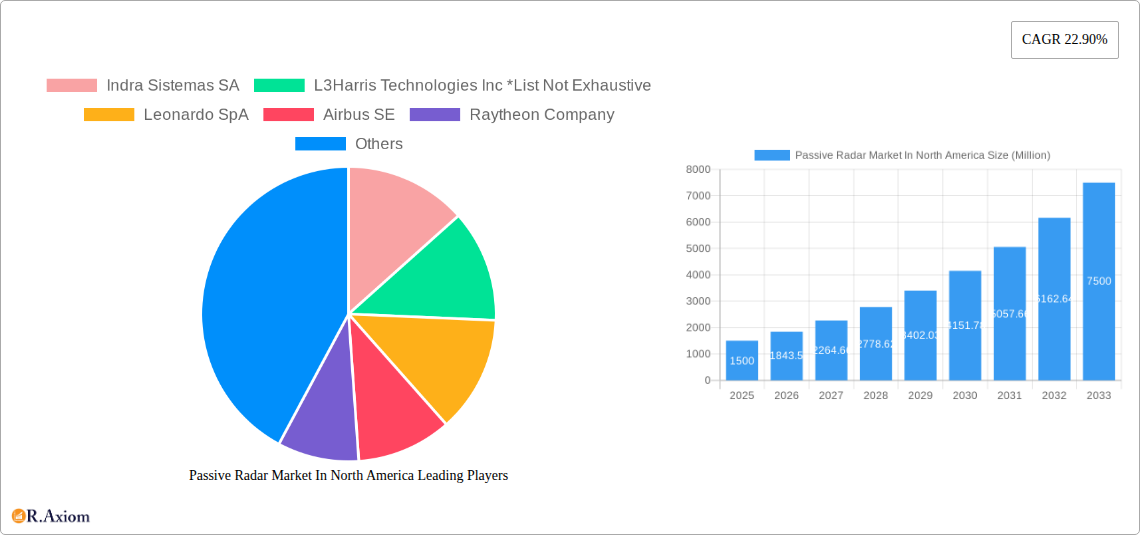
Passive Radar Market In North America Company Market Share
Passive Radar Market in North America: A Comprehensive Market Report (2019-2033)
This comprehensive report provides an in-depth analysis of the Passive Radar Market in North America, covering the period 2019-2033. It offers a detailed overview of market dynamics, including growth drivers, challenges, opportunities, and competitive landscape. The report is essential for industry stakeholders, investors, and businesses seeking to understand and capitalize on the growth potential within this dynamic sector. The study period covers 2019-2033, with a base year of 2025 and a forecast period of 2025-2033, using 2025 as the estimated year and the historical period as 2019-2024. Market values are expressed in Millions.
Passive Radar Market in North America: Market Concentration & Innovation
This section analyzes the competitive landscape of the North American passive radar market, focusing on market concentration, innovation drivers, regulatory influences, product substitutes, end-user trends, and mergers and acquisitions (M&A) activities. The market is characterized by a moderate level of concentration, with key players such as Indra Sistemas SA, L3Harris Technologies Inc., Leonardo SpA, Airbus SE, and Raytheon Company holding significant market share. However, the presence of several smaller, specialized players contributes to a competitive dynamic.
Market Concentration: The market share of the top five players is estimated at xx% in 2025, indicating a moderately concentrated market. This is expected to slightly decrease to xx% by 2033 due to increased competition and market entry of new players.
Innovation Drivers: Continuous advancements in signal processing technologies, miniaturization of components, and the integration of Artificial Intelligence (AI) and Machine Learning (ML) are major innovation drivers. The demand for improved accuracy, range, and cost-effectiveness is fueling innovation within the sector.
Regulatory Framework: Government regulations concerning airspace surveillance, border security, and defense spending significantly impact market growth. Favorable regulatory policies and increased defense budgets drive market expansion.
Product Substitutes: While there are no direct substitutes for passive radar systems, active radar systems present a key competitive threat. However, the advantages of passive radar (low cost, reduced detectability) ensure continued market growth.
End-User Trends: The increasing demand for enhanced situational awareness across various sectors, including homeland security, civil aviation, and defense, is a key driver for market growth.
M&A Activities: The passive radar market has witnessed several M&A activities in recent years, with deal values totaling an estimated xx Million in the last five years. These activities have led to consolidation and enhanced technological capabilities within the market.
Passive Radar Market in North America: Industry Trends & Insights
The North American passive radar market is witnessing robust growth, driven by several key factors. The Compound Annual Growth Rate (CAGR) is projected to be xx% during the forecast period (2025-2033). Technological advancements, such as the development of sophisticated signal processing algorithms and the integration of AI/ML capabilities, are leading to improved system performance and functionality. This is driving the adoption of passive radar systems across various applications.
The increasing demand for enhanced security and surveillance, particularly in the context of rising geopolitical uncertainties, is also fueling market growth. The proliferation of drones and unmanned aerial vehicles (UAVs) is further augmenting the demand for robust and effective surveillance systems, with passive radar systems presenting a significant advantage. The market penetration of passive radar systems in the defense sector is currently at xx%, and this is expected to increase to xx% by 2033, fueled by the continuous modernization of defense infrastructure. Consumer preferences, reflected in increased demand for high-performance, reliable and cost-effective solutions, are shaping the technological innovations within the sector. The competitive dynamics are defined by both established players leveraging their expertise and innovative startups introducing disruptive technologies.
Dominant Markets & Segments in Passive Radar Market in North America
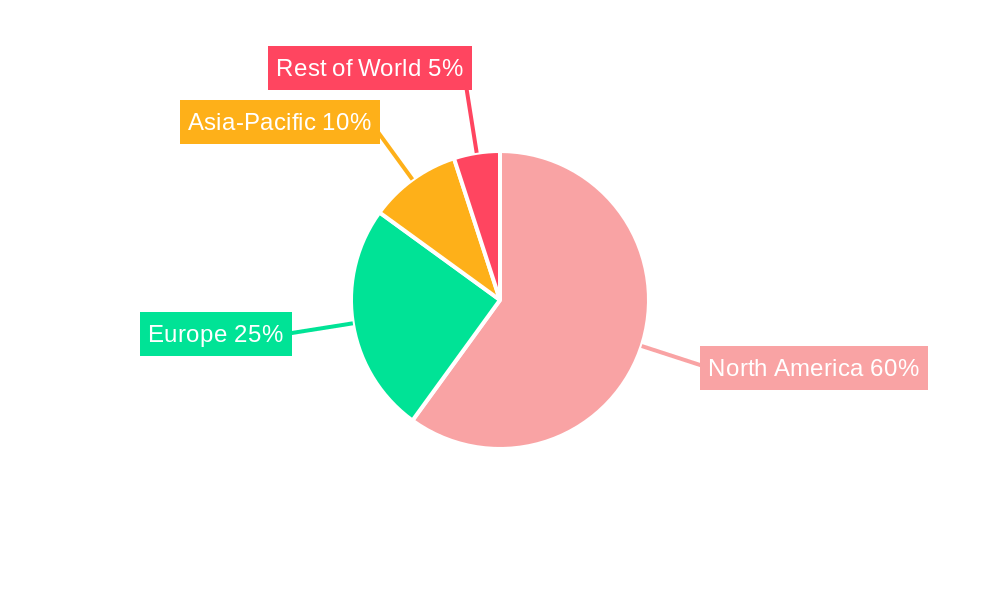
The United States dominates the North American passive radar market, driven by large defense budgets, a strong technological base, and a significant focus on homeland security. Canada also represents a notable market, particularly for applications related to border surveillance and air traffic management.
Key Drivers for the US Market Dominance:
- High Defense Spending: Significant investments in defense modernization and technological advancements are key drivers.
- Robust Technological Ecosystem: The presence of numerous technology companies and research institutions facilitates innovation and development.
- Emphasis on Homeland Security: Heightened concerns regarding national security and border protection drive the adoption of advanced surveillance technologies.
Key Drivers for the Canadian Market:
- Border Security Needs: The vast border with the United States necessitates robust surveillance and monitoring systems.
- Air Traffic Management Requirements: The increasing air traffic in Canada's airspace demands advanced air traffic control technologies.
- Northern Surveillance Initiatives: Monitoring remote areas of the country necessitates effective surveillance technologies.
Within the user segments, the defense sector constitutes the largest market share, owing to substantial government procurement and modernization programs. However, the civil aviation and homeland security segments are also experiencing significant growth, driven by increasing needs for improved air traffic management and enhanced security measures respectively. This is leading to a diversification of applications and expansion into new segments.
Passive Radar Market in North America: Product Developments
Recent product innovations in the passive radar market focus on improving range, accuracy, and the ability to detect smaller and more elusive targets. This includes advanced signal processing techniques and the integration of AI and Machine Learning to enhance target identification and tracking. Miniaturization of components is another significant trend, enabling the development of smaller, more portable and deployable systems. These innovations are improving the market fit of passive radar systems across various applications, particularly in areas with space or weight constraints.
Report Scope & Segmentation Analysis
This report segments the North American passive radar market by user (Homeland Security, Civil Aviation, Defense) and by country (United States, Canada). Each segment's growth projections, market sizes, and competitive dynamics are analyzed.
By User:
Homeland Security: This segment exhibits significant growth due to increasing security concerns and the need for enhanced surveillance capabilities. The market is expected to grow at a CAGR of xx% during the forecast period.
Civil Aviation: The increasing volume of air traffic is driving demand for advanced air traffic management systems, leading to market expansion. The growth is projected at a CAGR of xx% during the forecast period.
Defense: This segment remains the largest, driven by the continuous modernization of defense infrastructure and growing defense budgets. The market is expected to grow at a CAGR of xx% during the forecast period.
By Country:
United States: The US dominates the market due to substantial investments in defense and homeland security. Market size is projected at xx Million in 2025.
Canada: Canada represents a significant market, driven by its need for robust border security and efficient air traffic management. Market size is projected at xx Million in 2025.
Key Drivers of Passive Radar Market in North America Growth
Several factors are driving the growth of the passive radar market in North America. These include:
- Technological Advancements: Innovations in signal processing, AI/ML integration, and miniaturization are improving system performance and cost-effectiveness.
- Increased Security Concerns: The rising need for enhanced surveillance and security across various sectors is fueling market demand.
- Government Investments: Significant defense and homeland security budgets are driving market growth, especially in the United States.
- Proliferation of Drones: The increasing use of drones necessitates effective countermeasures, creating demand for passive radar systems.
Challenges in the Passive Radar Market in North America Sector
Despite the significant growth potential, the passive radar market faces certain challenges:
- Complex Signal Processing: The sophisticated signal processing required for effective passive radar systems can be complex and resource-intensive.
- Cost of Implementation: Implementing and maintaining passive radar systems can be expensive, particularly for large-scale deployments.
- Environmental Factors: Environmental conditions (weather, terrain) can affect the performance of passive radar systems.
- Competition from Active Radar: Active radar systems remain a significant competitor, offering certain advantages despite higher costs and susceptibility to detection.
Emerging Opportunities in Passive Radar Market in North America
The passive radar market presents several emerging opportunities:
- Integration with IoT: The increasing use of Internet of Things (IoT) devices presents opportunities for integrating passive radar systems into broader surveillance networks.
- Expansion into Civilian Applications: Passive radar technology finds increasing applications in areas such as traffic management, environmental monitoring, and infrastructure protection.
- Development of Hybrid Systems: Combining passive and active radar technologies offers synergistic advantages in terms of performance and cost-effectiveness.
Leading Players in the Passive Radar Market in North America Market
- Indra Sistemas SA
- L3Harris Technologies Inc
- Leonardo SpA
- Airbus SE
- Raytheon Company
- SRC Inc
- Thales Group
- BAE Systems PLC
- Israel Aerospace Industries Ltd
- Hensoldt Holding Germany GmbH
- Advanced Electronics Company
- ERA AS (Omnipol Group)
- Ramet AS
Key Developments in Passive Radar Market in North America Industry
- Jan 2023: L3Harris Technologies announced a new passive radar system with enhanced capabilities.
- Oct 2022: Indra Sistemas SA secured a contract for a large-scale passive radar deployment.
- Jul 2022: A significant merger between two passive radar companies expanded market share. (Further details would be added in the full report)
Strategic Outlook for Passive Radar Market in North America Market
The North American passive radar market is poised for significant growth in the coming years. Technological advancements, increasing security concerns, and substantial government investments will drive market expansion. The integration of AI/ML, miniaturization, and the development of hybrid systems will further enhance the market potential. New applications in civilian sectors present significant opportunities for market diversification and expansion. The market is expected to experience substantial growth, with continued consolidation among existing players and the emergence of new innovative companies.
Passive Radar Market In North America Segmentation
- 1. Production Analysis
- 2. Consumption Analysis
- 3. Import Market Analysis (Value & Volume)
- 4. Export Market Analysis (Value & Volume)
- 5. Price Trend Analysis
Passive Radar Market In North America Segmentation By Geography
-
1. North America
- 1.1. United States
- 1.2. Canada
- 1.3. Mexico
-
2. South America
- 2.1. Brazil
- 2.2. Argentina
- 2.3. Rest of South America
-
3. Europe
- 3.1. United Kingdom
- 3.2. Germany
- 3.3. France
- 3.4. Italy
- 3.5. Spain
- 3.6. Russia
- 3.7. Benelux
- 3.8. Nordics
- 3.9. Rest of Europe
-
4. Middle East & Africa
- 4.1. Turkey
- 4.2. Israel
- 4.3. GCC
- 4.4. North Africa
- 4.5. South Africa
- 4.6. Rest of Middle East & Africa
-
5. Asia Pacific
- 5.1. China
- 5.2. India
- 5.3. Japan
- 5.4. South Korea
- 5.5. ASEAN
- 5.6. Oceania
- 5.7. Rest of Asia Pacific
Passive Radar Market In North America Regional Market Share
Geographic Coverage of Passive Radar Market In North America
Passive Radar Market In North America REPORT HIGHLIGHTS
| Aspects | Details |
|---|---|
| Study Period | 2020-2034 |
| Base Year | 2025 |
| Estimated Year | 2026 |
| Forecast Period | 2026-2034 |
| Historical Period | 2020-2025 |
| Growth Rate | CAGR of 11.38% from 2020-2034 |
| Segmentation |
|
Table of Contents
- 1. Introduction
- 1.1. Research Scope
- 1.2. Market Segmentation
- 1.3. Research Objective
- 1.4. Definitions and Assumptions
- 2. Executive Summary
- 2.1. Market Snapshot
- 3. Market Dynamics
- 3.1. Market Drivers
- 3.2. Market Restrains
- 3.3. Market Trends
- 3.4. Market Opportunities
- 4. Market Factor Analysis
- 4.1. Porters Five Forces
- 4.1.1. Bargaining Power of Suppliers
- 4.1.2. Bargaining Power of Buyers
- 4.1.3. Threat of New Entrants
- 4.1.4. Threat of Substitutes
- 4.1.5. Competitive Rivalry
- 4.2. PESTEL analysis
- 4.3. BCG Analysis
- 4.3.1. Stars (High Growth, High Market Share)
- 4.3.2. Cash Cows (Low Growth, High Market Share)
- 4.3.3. Question Mark (High Growth, Low Market Share)
- 4.3.4. Dogs (Low Growth, Low Market Share)
- 4.4. Ansoff Matrix Analysis
- 4.5. Supply Chain Analysis
- 4.6. Regulatory Landscape
- 4.7. Current Market Potential and Opportunity Assessment (TAM–SAM–SOM Framework)
- 4.8. RAX Analyst Note
- 4.1. Porters Five Forces
- 5. Market Analysis, Insights and Forecast 2021-2033
- 5.1. Market Analysis, Insights and Forecast - by Production Analysis
- 5.2. Market Analysis, Insights and Forecast - by Consumption Analysis
- 5.3. Market Analysis, Insights and Forecast - by Import Market Analysis (Value & Volume)
- 5.4. Market Analysis, Insights and Forecast - by Export Market Analysis (Value & Volume)
- 5.5. Market Analysis, Insights and Forecast - by Price Trend Analysis
- 5.6. Market Analysis, Insights and Forecast - by Region
- 5.6.1. North America
- 5.6.2. South America
- 5.6.3. Europe
- 5.6.4. Middle East & Africa
- 5.6.5. Asia Pacific
- 6. Global Passive Radar Market In North America Analysis, Insights and Forecast, 2021-2033
- 6.1. Market Analysis, Insights and Forecast - by Production Analysis
- 6.2. Market Analysis, Insights and Forecast - by Consumption Analysis
- 6.3. Market Analysis, Insights and Forecast - by Import Market Analysis (Value & Volume)
- 6.4. Market Analysis, Insights and Forecast - by Export Market Analysis (Value & Volume)
- 6.5. Market Analysis, Insights and Forecast - by Price Trend Analysis
- 7. North America Passive Radar Market In North America Analysis, Insights and Forecast, 2020-2032
- 7.1. Market Analysis, Insights and Forecast - by Production Analysis
- 7.2. Market Analysis, Insights and Forecast - by Consumption Analysis
- 7.3. Market Analysis, Insights and Forecast - by Import Market Analysis (Value & Volume)
- 7.4. Market Analysis, Insights and Forecast - by Export Market Analysis (Value & Volume)
- 7.5. Market Analysis, Insights and Forecast - by Price Trend Analysis
- 8. South America Passive Radar Market In North America Analysis, Insights and Forecast, 2020-2032
- 8.1. Market Analysis, Insights and Forecast - by Production Analysis
- 8.2. Market Analysis, Insights and Forecast - by Consumption Analysis
- 8.3. Market Analysis, Insights and Forecast - by Import Market Analysis (Value & Volume)
- 8.4. Market Analysis, Insights and Forecast - by Export Market Analysis (Value & Volume)
- 8.5. Market Analysis, Insights and Forecast - by Price Trend Analysis
- 9. Europe Passive Radar Market In North America Analysis, Insights and Forecast, 2020-2032
- 9.1. Market Analysis, Insights and Forecast - by Production Analysis
- 9.2. Market Analysis, Insights and Forecast - by Consumption Analysis
- 9.3. Market Analysis, Insights and Forecast - by Import Market Analysis (Value & Volume)
- 9.4. Market Analysis, Insights and Forecast - by Export Market Analysis (Value & Volume)
- 9.5. Market Analysis, Insights and Forecast - by Price Trend Analysis
- 10. Middle East & Africa Passive Radar Market In North America Analysis, Insights and Forecast, 2020-2032
- 10.1. Market Analysis, Insights and Forecast - by Production Analysis
- 10.2. Market Analysis, Insights and Forecast - by Consumption Analysis
- 10.3. Market Analysis, Insights and Forecast - by Import Market Analysis (Value & Volume)
- 10.4. Market Analysis, Insights and Forecast - by Export Market Analysis (Value & Volume)
- 10.5. Market Analysis, Insights and Forecast - by Price Trend Analysis
- 11. Asia Pacific Passive Radar Market In North America Analysis, Insights and Forecast, 2020-2032
- 11.1. Market Analysis, Insights and Forecast - by Production Analysis
- 11.2. Market Analysis, Insights and Forecast - by Consumption Analysis
- 11.3. Market Analysis, Insights and Forecast - by Import Market Analysis (Value & Volume)
- 11.4. Market Analysis, Insights and Forecast - by Export Market Analysis (Value & Volume)
- 11.5. Market Analysis, Insights and Forecast - by Price Trend Analysis
- 12. Competitive Analysis
- 12.1. Company Profiles
- 12.1.1 Indra Sistemas SA
- 12.1.1.1. Company Overview
- 12.1.1.2. Products
- 12.1.1.3. Company Financials
- 12.1.1.4. SWOT Analysis
- 12.1.2 L3Harris Technologies Inc *List Not Exhaustive
- 12.1.2.1. Company Overview
- 12.1.2.2. Products
- 12.1.2.3. Company Financials
- 12.1.2.4. SWOT Analysis
- 12.1.3 Leonardo SpA
- 12.1.3.1. Company Overview
- 12.1.3.2. Products
- 12.1.3.3. Company Financials
- 12.1.3.4. SWOT Analysis
- 12.1.4 Airbus SE
- 12.1.4.1. Company Overview
- 12.1.4.2. Products
- 12.1.4.3. Company Financials
- 12.1.4.4. SWOT Analysis
- 12.1.5 Raytheon Company
- 12.1.5.1. Company Overview
- 12.1.5.2. Products
- 12.1.5.3. Company Financials
- 12.1.5.4. SWOT Analysis
- 12.1.6 SRC Inc
- 12.1.6.1. Company Overview
- 12.1.6.2. Products
- 12.1.6.3. Company Financials
- 12.1.6.4. SWOT Analysis
- 12.1.7 Thales Group
- 12.1.7.1. Company Overview
- 12.1.7.2. Products
- 12.1.7.3. Company Financials
- 12.1.7.4. SWOT Analysis
- 12.1.8 BAE Systems PLC
- 12.1.8.1. Company Overview
- 12.1.8.2. Products
- 12.1.8.3. Company Financials
- 12.1.8.4. SWOT Analysis
- 12.1.9 Israel Aerospace Industries Ltd
- 12.1.9.1. Company Overview
- 12.1.9.2. Products
- 12.1.9.3. Company Financials
- 12.1.9.4. SWOT Analysis
- 12.1.10 Hensoldt Holding Germany GmbH
- 12.1.10.1. Company Overview
- 12.1.10.2. Products
- 12.1.10.3. Company Financials
- 12.1.10.4. SWOT Analysis
- 12.1.11 Advanced Electronics Company
- 12.1.11.1. Company Overview
- 12.1.11.2. Products
- 12.1.11.3. Company Financials
- 12.1.11.4. SWOT Analysis
- 12.1.12 ERA AS (Omnipol Group)
- 12.1.12.1. Company Overview
- 12.1.12.2. Products
- 12.1.12.3. Company Financials
- 12.1.12.4. SWOT Analysis
- 12.1.13 Ramet AS
- 12.1.13.1. Company Overview
- 12.1.13.2. Products
- 12.1.13.3. Company Financials
- 12.1.13.4. SWOT Analysis
- 12.1.1 Indra Sistemas SA
- 12.2. Market Entropy
- 12.2.1 Company's Key Areas Served
- 12.2.2 Recent Developments
- 12.3. Company Market Share Analysis 2025
- 12.3.1 Top 5 Companies Market Share Analysis
- 12.3.2 Top 3 Companies Market Share Analysis
- 12.4. List of Potential Customers
- 13. Research Methodology
List of Figures
- Figure 1: Global Passive Radar Market In North America Revenue Breakdown (million, %) by Region 2025 & 2033
- Figure 2: North America Passive Radar Market In North America Revenue (million), by Production Analysis 2025 & 2033
- Figure 3: North America Passive Radar Market In North America Revenue Share (%), by Production Analysis 2025 & 2033
- Figure 4: North America Passive Radar Market In North America Revenue (million), by Consumption Analysis 2025 & 2033
- Figure 5: North America Passive Radar Market In North America Revenue Share (%), by Consumption Analysis 2025 & 2033
- Figure 6: North America Passive Radar Market In North America Revenue (million), by Import Market Analysis (Value & Volume) 2025 & 2033
- Figure 7: North America Passive Radar Market In North America Revenue Share (%), by Import Market Analysis (Value & Volume) 2025 & 2033
- Figure 8: North America Passive Radar Market In North America Revenue (million), by Export Market Analysis (Value & Volume) 2025 & 2033
- Figure 9: North America Passive Radar Market In North America Revenue Share (%), by Export Market Analysis (Value & Volume) 2025 & 2033
- Figure 10: North America Passive Radar Market In North America Revenue (million), by Price Trend Analysis 2025 & 2033
- Figure 11: North America Passive Radar Market In North America Revenue Share (%), by Price Trend Analysis 2025 & 2033
- Figure 12: North America Passive Radar Market In North America Revenue (million), by Country 2025 & 2033
- Figure 13: North America Passive Radar Market In North America Revenue Share (%), by Country 2025 & 2033
- Figure 14: South America Passive Radar Market In North America Revenue (million), by Production Analysis 2025 & 2033
- Figure 15: South America Passive Radar Market In North America Revenue Share (%), by Production Analysis 2025 & 2033
- Figure 16: South America Passive Radar Market In North America Revenue (million), by Consumption Analysis 2025 & 2033
- Figure 17: South America Passive Radar Market In North America Revenue Share (%), by Consumption Analysis 2025 & 2033
- Figure 18: South America Passive Radar Market In North America Revenue (million), by Import Market Analysis (Value & Volume) 2025 & 2033
- Figure 19: South America Passive Radar Market In North America Revenue Share (%), by Import Market Analysis (Value & Volume) 2025 & 2033
- Figure 20: South America Passive Radar Market In North America Revenue (million), by Export Market Analysis (Value & Volume) 2025 & 2033
- Figure 21: South America Passive Radar Market In North America Revenue Share (%), by Export Market Analysis (Value & Volume) 2025 & 2033
- Figure 22: South America Passive Radar Market In North America Revenue (million), by Price Trend Analysis 2025 & 2033
- Figure 23: South America Passive Radar Market In North America Revenue Share (%), by Price Trend Analysis 2025 & 2033
- Figure 24: South America Passive Radar Market In North America Revenue (million), by Country 2025 & 2033
- Figure 25: South America Passive Radar Market In North America Revenue Share (%), by Country 2025 & 2033
- Figure 26: Europe Passive Radar Market In North America Revenue (million), by Production Analysis 2025 & 2033
- Figure 27: Europe Passive Radar Market In North America Revenue Share (%), by Production Analysis 2025 & 2033
- Figure 28: Europe Passive Radar Market In North America Revenue (million), by Consumption Analysis 2025 & 2033
- Figure 29: Europe Passive Radar Market In North America Revenue Share (%), by Consumption Analysis 2025 & 2033
- Figure 30: Europe Passive Radar Market In North America Revenue (million), by Import Market Analysis (Value & Volume) 2025 & 2033
- Figure 31: Europe Passive Radar Market In North America Revenue Share (%), by Import Market Analysis (Value & Volume) 2025 & 2033
- Figure 32: Europe Passive Radar Market In North America Revenue (million), by Export Market Analysis (Value & Volume) 2025 & 2033
- Figure 33: Europe Passive Radar Market In North America Revenue Share (%), by Export Market Analysis (Value & Volume) 2025 & 2033
- Figure 34: Europe Passive Radar Market In North America Revenue (million), by Price Trend Analysis 2025 & 2033
- Figure 35: Europe Passive Radar Market In North America Revenue Share (%), by Price Trend Analysis 2025 & 2033
- Figure 36: Europe Passive Radar Market In North America Revenue (million), by Country 2025 & 2033
- Figure 37: Europe Passive Radar Market In North America Revenue Share (%), by Country 2025 & 2033
- Figure 38: Middle East & Africa Passive Radar Market In North America Revenue (million), by Production Analysis 2025 & 2033
- Figure 39: Middle East & Africa Passive Radar Market In North America Revenue Share (%), by Production Analysis 2025 & 2033
- Figure 40: Middle East & Africa Passive Radar Market In North America Revenue (million), by Consumption Analysis 2025 & 2033
- Figure 41: Middle East & Africa Passive Radar Market In North America Revenue Share (%), by Consumption Analysis 2025 & 2033
- Figure 42: Middle East & Africa Passive Radar Market In North America Revenue (million), by Import Market Analysis (Value & Volume) 2025 & 2033
- Figure 43: Middle East & Africa Passive Radar Market In North America Revenue Share (%), by Import Market Analysis (Value & Volume) 2025 & 2033
- Figure 44: Middle East & Africa Passive Radar Market In North America Revenue (million), by Export Market Analysis (Value & Volume) 2025 & 2033
- Figure 45: Middle East & Africa Passive Radar Market In North America Revenue Share (%), by Export Market Analysis (Value & Volume) 2025 & 2033
- Figure 46: Middle East & Africa Passive Radar Market In North America Revenue (million), by Price Trend Analysis 2025 & 2033
- Figure 47: Middle East & Africa Passive Radar Market In North America Revenue Share (%), by Price Trend Analysis 2025 & 2033
- Figure 48: Middle East & Africa Passive Radar Market In North America Revenue (million), by Country 2025 & 2033
- Figure 49: Middle East & Africa Passive Radar Market In North America Revenue Share (%), by Country 2025 & 2033
- Figure 50: Asia Pacific Passive Radar Market In North America Revenue (million), by Production Analysis 2025 & 2033
- Figure 51: Asia Pacific Passive Radar Market In North America Revenue Share (%), by Production Analysis 2025 & 2033
- Figure 52: Asia Pacific Passive Radar Market In North America Revenue (million), by Consumption Analysis 2025 & 2033
- Figure 53: Asia Pacific Passive Radar Market In North America Revenue Share (%), by Consumption Analysis 2025 & 2033
- Figure 54: Asia Pacific Passive Radar Market In North America Revenue (million), by Import Market Analysis (Value & Volume) 2025 & 2033
- Figure 55: Asia Pacific Passive Radar Market In North America Revenue Share (%), by Import Market Analysis (Value & Volume) 2025 & 2033
- Figure 56: Asia Pacific Passive Radar Market In North America Revenue (million), by Export Market Analysis (Value & Volume) 2025 & 2033
- Figure 57: Asia Pacific Passive Radar Market In North America Revenue Share (%), by Export Market Analysis (Value & Volume) 2025 & 2033
- Figure 58: Asia Pacific Passive Radar Market In North America Revenue (million), by Price Trend Analysis 2025 & 2033
- Figure 59: Asia Pacific Passive Radar Market In North America Revenue Share (%), by Price Trend Analysis 2025 & 2033
- Figure 60: Asia Pacific Passive Radar Market In North America Revenue (million), by Country 2025 & 2033
- Figure 61: Asia Pacific Passive Radar Market In North America Revenue Share (%), by Country 2025 & 2033
List of Tables
- Table 1: Global Passive Radar Market In North America Revenue million Forecast, by Production Analysis 2020 & 2033
- Table 2: Global Passive Radar Market In North America Revenue million Forecast, by Consumption Analysis 2020 & 2033
- Table 3: Global Passive Radar Market In North America Revenue million Forecast, by Import Market Analysis (Value & Volume) 2020 & 2033
- Table 4: Global Passive Radar Market In North America Revenue million Forecast, by Export Market Analysis (Value & Volume) 2020 & 2033
- Table 5: Global Passive Radar Market In North America Revenue million Forecast, by Price Trend Analysis 2020 & 2033
- Table 6: Global Passive Radar Market In North America Revenue million Forecast, by Region 2020 & 2033
- Table 7: Global Passive Radar Market In North America Revenue million Forecast, by Production Analysis 2020 & 2033
- Table 8: Global Passive Radar Market In North America Revenue million Forecast, by Consumption Analysis 2020 & 2033
- Table 9: Global Passive Radar Market In North America Revenue million Forecast, by Import Market Analysis (Value & Volume) 2020 & 2033
- Table 10: Global Passive Radar Market In North America Revenue million Forecast, by Export Market Analysis (Value & Volume) 2020 & 2033
- Table 11: Global Passive Radar Market In North America Revenue million Forecast, by Price Trend Analysis 2020 & 2033
- Table 12: Global Passive Radar Market In North America Revenue million Forecast, by Country 2020 & 2033
- Table 13: United States Passive Radar Market In North America Revenue (million) Forecast, by Application 2020 & 2033
- Table 14: Canada Passive Radar Market In North America Revenue (million) Forecast, by Application 2020 & 2033
- Table 15: Mexico Passive Radar Market In North America Revenue (million) Forecast, by Application 2020 & 2033
- Table 16: Global Passive Radar Market In North America Revenue million Forecast, by Production Analysis 2020 & 2033
- Table 17: Global Passive Radar Market In North America Revenue million Forecast, by Consumption Analysis 2020 & 2033
- Table 18: Global Passive Radar Market In North America Revenue million Forecast, by Import Market Analysis (Value & Volume) 2020 & 2033
- Table 19: Global Passive Radar Market In North America Revenue million Forecast, by Export Market Analysis (Value & Volume) 2020 & 2033
- Table 20: Global Passive Radar Market In North America Revenue million Forecast, by Price Trend Analysis 2020 & 2033
- Table 21: Global Passive Radar Market In North America Revenue million Forecast, by Country 2020 & 2033
- Table 22: Brazil Passive Radar Market In North America Revenue (million) Forecast, by Application 2020 & 2033
- Table 23: Argentina Passive Radar Market In North America Revenue (million) Forecast, by Application 2020 & 2033
- Table 24: Rest of South America Passive Radar Market In North America Revenue (million) Forecast, by Application 2020 & 2033
- Table 25: Global Passive Radar Market In North America Revenue million Forecast, by Production Analysis 2020 & 2033
- Table 26: Global Passive Radar Market In North America Revenue million Forecast, by Consumption Analysis 2020 & 2033
- Table 27: Global Passive Radar Market In North America Revenue million Forecast, by Import Market Analysis (Value & Volume) 2020 & 2033
- Table 28: Global Passive Radar Market In North America Revenue million Forecast, by Export Market Analysis (Value & Volume) 2020 & 2033
- Table 29: Global Passive Radar Market In North America Revenue million Forecast, by Price Trend Analysis 2020 & 2033
- Table 30: Global Passive Radar Market In North America Revenue million Forecast, by Country 2020 & 2033
- Table 31: United Kingdom Passive Radar Market In North America Revenue (million) Forecast, by Application 2020 & 2033
- Table 32: Germany Passive Radar Market In North America Revenue (million) Forecast, by Application 2020 & 2033
- Table 33: France Passive Radar Market In North America Revenue (million) Forecast, by Application 2020 & 2033
- Table 34: Italy Passive Radar Market In North America Revenue (million) Forecast, by Application 2020 & 2033
- Table 35: Spain Passive Radar Market In North America Revenue (million) Forecast, by Application 2020 & 2033
- Table 36: Russia Passive Radar Market In North America Revenue (million) Forecast, by Application 2020 & 2033
- Table 37: Benelux Passive Radar Market In North America Revenue (million) Forecast, by Application 2020 & 2033
- Table 38: Nordics Passive Radar Market In North America Revenue (million) Forecast, by Application 2020 & 2033
- Table 39: Rest of Europe Passive Radar Market In North America Revenue (million) Forecast, by Application 2020 & 2033
- Table 40: Global Passive Radar Market In North America Revenue million Forecast, by Production Analysis 2020 & 2033
- Table 41: Global Passive Radar Market In North America Revenue million Forecast, by Consumption Analysis 2020 & 2033
- Table 42: Global Passive Radar Market In North America Revenue million Forecast, by Import Market Analysis (Value & Volume) 2020 & 2033
- Table 43: Global Passive Radar Market In North America Revenue million Forecast, by Export Market Analysis (Value & Volume) 2020 & 2033
- Table 44: Global Passive Radar Market In North America Revenue million Forecast, by Price Trend Analysis 2020 & 2033
- Table 45: Global Passive Radar Market In North America Revenue million Forecast, by Country 2020 & 2033
- Table 46: Turkey Passive Radar Market In North America Revenue (million) Forecast, by Application 2020 & 2033
- Table 47: Israel Passive Radar Market In North America Revenue (million) Forecast, by Application 2020 & 2033
- Table 48: GCC Passive Radar Market In North America Revenue (million) Forecast, by Application 2020 & 2033
- Table 49: North Africa Passive Radar Market In North America Revenue (million) Forecast, by Application 2020 & 2033
- Table 50: South Africa Passive Radar Market In North America Revenue (million) Forecast, by Application 2020 & 2033
- Table 51: Rest of Middle East & Africa Passive Radar Market In North America Revenue (million) Forecast, by Application 2020 & 2033
- Table 52: Global Passive Radar Market In North America Revenue million Forecast, by Production Analysis 2020 & 2033
- Table 53: Global Passive Radar Market In North America Revenue million Forecast, by Consumption Analysis 2020 & 2033
- Table 54: Global Passive Radar Market In North America Revenue million Forecast, by Import Market Analysis (Value & Volume) 2020 & 2033
- Table 55: Global Passive Radar Market In North America Revenue million Forecast, by Export Market Analysis (Value & Volume) 2020 & 2033
- Table 56: Global Passive Radar Market In North America Revenue million Forecast, by Price Trend Analysis 2020 & 2033
- Table 57: Global Passive Radar Market In North America Revenue million Forecast, by Country 2020 & 2033
- Table 58: China Passive Radar Market In North America Revenue (million) Forecast, by Application 2020 & 2033
- Table 59: India Passive Radar Market In North America Revenue (million) Forecast, by Application 2020 & 2033
- Table 60: Japan Passive Radar Market In North America Revenue (million) Forecast, by Application 2020 & 2033
- Table 61: South Korea Passive Radar Market In North America Revenue (million) Forecast, by Application 2020 & 2033
- Table 62: ASEAN Passive Radar Market In North America Revenue (million) Forecast, by Application 2020 & 2033
- Table 63: Oceania Passive Radar Market In North America Revenue (million) Forecast, by Application 2020 & 2033
- Table 64: Rest of Asia Pacific Passive Radar Market In North America Revenue (million) Forecast, by Application 2020 & 2033
Frequently Asked Questions
1. What is the projected Compound Annual Growth Rate (CAGR) of the Passive Radar Market In North America?
The projected CAGR is approximately 11.38%.
2. Which companies are prominent players in the Passive Radar Market In North America?
Key companies in the market include Indra Sistemas SA, L3Harris Technologies Inc *List Not Exhaustive, Leonardo SpA, Airbus SE, Raytheon Company, SRC Inc, Thales Group, BAE Systems PLC, Israel Aerospace Industries Ltd, Hensoldt Holding Germany GmbH, Advanced Electronics Company, ERA AS (Omnipol Group), Ramet AS.
3. What are the main segments of the Passive Radar Market In North America?
The market segments include Production Analysis, Consumption Analysis, Import Market Analysis (Value & Volume), Export Market Analysis (Value & Volume), Price Trend Analysis.
4. Can you provide details about the market size?
The market size is estimated to be USD 14.25 million as of 2022.
5. What are some drivers contributing to market growth?
; Increased Seaborne Threats And Ambiguous Maritime Security Policies; Increasing Adoption Of Security Technologies In Bric Countries.
6. What are the notable trends driving market growth?
The Defense Segment Has the Largest Market Share Currently.
7. Are there any restraints impacting market growth?
; High Risk Rate In Ungoverned Zones; Unstructured Security Standards And Technologies.
8. Can you provide examples of recent developments in the market?
N/A
9. What pricing options are available for accessing the report?
Pricing options include single-user, multi-user, and enterprise licenses priced at USD 4750, USD 4950, and USD 6800 respectively.
10. Is the market size provided in terms of value or volume?
The market size is provided in terms of value, measured in million.
11. Are there any specific market keywords associated with the report?
Yes, the market keyword associated with the report is "Passive Radar Market In North America," which aids in identifying and referencing the specific market segment covered.
12. How do I determine which pricing option suits my needs best?
The pricing options vary based on user requirements and access needs. Individual users may opt for single-user licenses, while businesses requiring broader access may choose multi-user or enterprise licenses for cost-effective access to the report.
13. Are there any additional resources or data provided in the Passive Radar Market In North America report?
While the report offers comprehensive insights, it's advisable to review the specific contents or supplementary materials provided to ascertain if additional resources or data are available.
14. How can I stay updated on further developments or reports in the Passive Radar Market In North America?
To stay informed about further developments, trends, and reports in the Passive Radar Market In North America, consider subscribing to industry newsletters, following relevant companies and organizations, or regularly checking reputable industry news sources and publications.
Methodology
Step 1 - Identification of Relevant Samples Size from Population Database


Step 2 - Approaches for Defining Global Market Size (Value, Volume* & Price*)

Note*: In applicable scenarios
Step 3 - Data Sources
Primary Research
- Web Analytics
- Survey Reports
- Research Institute
- Latest Research Reports
- Opinion Leaders
Secondary Research
- Annual Reports
- White Paper
- Latest Press Release
- Industry Association
- Paid Database
- Investor Presentations

Step 4 - Data Triangulation
Involves using different sources of information in order to increase the validity of a study
These sources are likely to be stakeholders in a program - participants, other researchers, program staff, other community members, and so on.
Then we put all data in single framework & apply various statistical tools to find out the dynamic on the market.
During the analysis stage, feedback from the stakeholder groups would be compared to determine areas of agreement as well as areas of divergence