

Key Insights
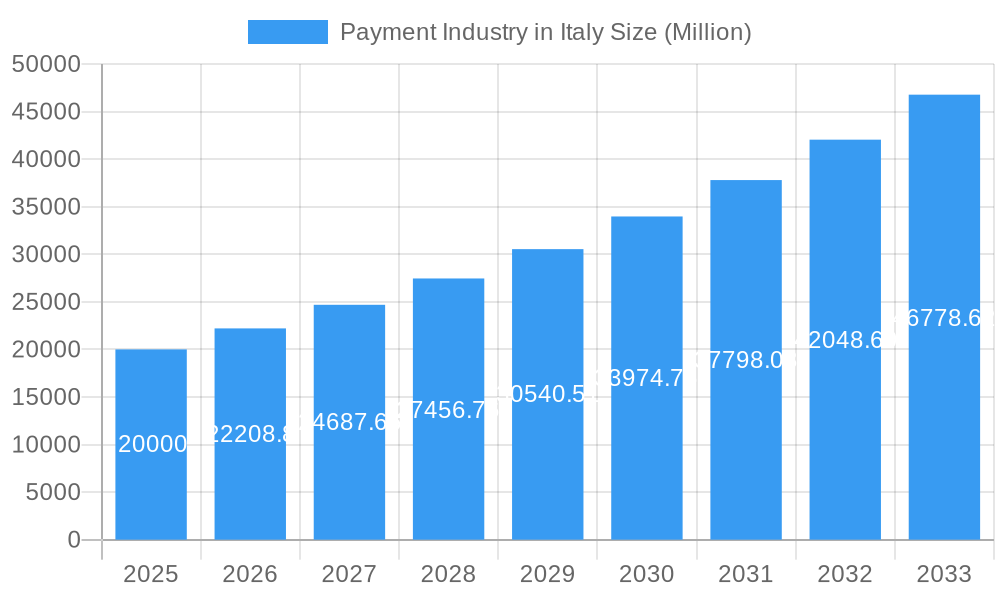
The Italian payment industry, valued at approximately €14.63 billion in 2025, is projected to experience robust expansion at a Compound Annual Growth Rate (CAGR) of 6% from 2025 to 2033. This growth is propelled by increasing e-commerce adoption, the flourishing retail, entertainment, and healthcare sectors, and the accelerated shift towards contactless payments via mobile wallets. While data security and evolving consumer preferences present challenges, growing smartphone penetration, enhanced internet access, and government digitalization initiatives are expected to mitigate these restraints. Market segmentation across various end-user industries and payment modes (POS, online) offers diverse opportunities.
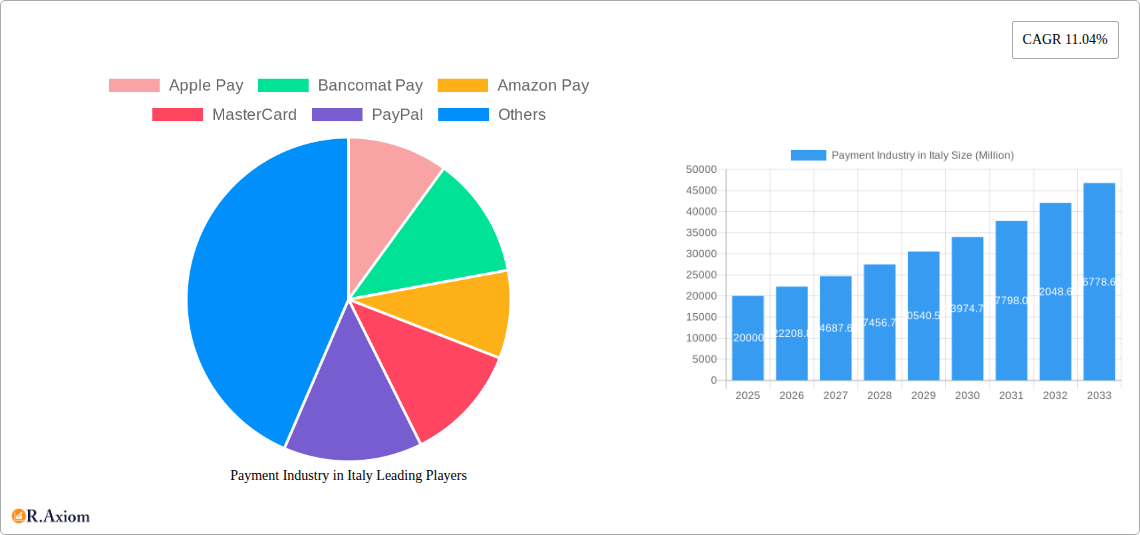
Payment Industry in Italy Market Size (In Billion)
The competitive landscape features established leaders such as Visa, Mastercard, and PayPal, alongside innovative fintech companies and mobile payment providers. Continuous technological advancements and new market entrants necessitate a dynamic strategy for participants. Market growth will be shaped by regulatory frameworks, consumer trust in digital payments, and integration into daily life. Regional variations in digital literacy and infrastructure access will also influence penetration rates. Prioritizing security and customer experience is vital for sustained growth in this evolving market.
Payment Industry in Italy Company Market Share
This comprehensive report analyzes the Italian payment industry, including market size, segmentation, growth drivers, challenges, and key players. The study period covers 2019-2033, with 2025 as the base and forecast year. This analysis is essential for businesses, investors, and policymakers seeking insights into this dynamic market.
Payment Industry in Italy Market Concentration & Innovation
The Italian payment industry exhibits a moderately concentrated market structure, with a few dominant players alongside numerous smaller participants. Market share data from 2024 suggests that Visa and Mastercard hold a significant portion, approximately xx Million, while other players like PayPal, Bancomat Pay, and Postepay control substantial but smaller portions of the market. This concentration is driven by factors such as extensive network infrastructure, brand recognition, and established customer bases.
Innovation within the industry is spurred by the increasing adoption of digital technologies, including mobile wallets (Apple Pay, Google Pay, Bancomat Pay), and the growing influence of open banking. Regulatory frameworks, such as PSD2, are encouraging competition and innovation by promoting interoperability and facilitating access to financial data. The rise of digital commerce and the increasing preference for contactless payments are further catalysts for innovation. Significant M&A activity, exemplified by Worldline's acquisition of Axepta Italy (January 2022), underscores the consolidation trends and strategic positioning within the sector. The deal value of this acquisition is estimated at xx Million. Other M&A activities, while less publicized, contribute to this dynamic landscape, with the combined deal value of all M&A activities in the last five years estimated at xx Million. Furthermore, the emergence of Buy Now Pay Later (BNPL) services is adding a new dimension to the market, presenting both opportunities and regulatory challenges. Product substitutes, such as cash and checks, are gradually losing market share, while newer payment methods are continually gaining traction.
Payment Industry in Italy Industry Trends & Insights
The Italian payment industry is experiencing robust growth, fueled by several key trends. The increasing adoption of digital payment methods, driven by rising smartphone penetration and internet usage, is a major contributor. This transition from traditional methods like cash and checks to digital solutions is fostering a shift in consumer preference towards convenience and security. The compound annual growth rate (CAGR) for digital payments is estimated at xx% during the forecast period (2025-2033). Market penetration of digital payment methods is projected to reach xx% by 2033, up from xx% in 2024. Technological disruptions such as the introduction of innovative payment solutions like BNPL and the continued expansion of mobile wallets are shaping the competitive landscape. The competitive dynamics are characterized by intense rivalry among established players and emerging fintech companies, leading to continuous innovation and price competition. Furthermore, evolving consumer preferences, such as the growing demand for contactless payments and increased security concerns, continue to influence industry developments. The increased focus on regulatory compliance and data security also contributes to the growth and evolution of the payment industry.
Dominant Markets & Segments in Payment Industry in Italy
The Italian payment industry is dominated by the retail segment within the end-user industry classification. This is attributed to the large number of transactions occurring in physical stores and e-commerce platforms. The point-of-sale (POS) payment mode accounts for a significant portion of total transactions, although online sales are experiencing rapid growth and are expected to surpass POS in future years.
Key Drivers for Retail Dominance:
- High consumer spending in retail sector.
- Extensive POS infrastructure throughout the country.
- Strong e-commerce growth driven by rising internet penetration.
- Government initiatives to promote digitalization.
Key Drivers for Online Sales Growth:
- Increasing e-commerce adoption.
- Growing internet penetration.
- Rise of mobile commerce.
The Healthcare and Hospitality segments are also experiencing strong growth, driven by increased digitalization initiatives in these sectors. The “Others” segment is gaining traction, reflecting the diverse applications of payment solutions across multiple verticals.
Payment Industry in Italy Product Developments
Recent product innovations in the Italian payment industry center around mobile payment solutions, contactless technologies, and enhanced security features. The integration of biometric authentication and advanced fraud detection systems are key trends. New applications are emerging in areas such as BNPL and embedded finance. These innovations are enhancing the user experience, increasing security, and driving broader adoption of digital payment methods. The market fit of these products is strong, reflecting the growing demand for convenience and security in payment transactions.
Report Scope & Segmentation Analysis
This report segments the Italian payment industry by several key aspects:
By End-user Industry: Retail, Entertainment, Healthcare, Hospitality, Other End-user Industries. Each segment exhibits varying growth rates and competitive dynamics, with retail currently dominating. Growth projections for each segment are detailed within the full report.
By Mode of Payment: Point of Sale (POS), Online Sales. POS payments are currently dominant, but Online Sales are experiencing rapid growth and are predicted to overtake POS within the forecast period. Competitive intensity varies across these modes, with increased competition in the online sphere.
Others: This category encompasses diverse applications and emerging trends. Market size and competitive dynamics within the "Others" segment are thoroughly examined in the complete report.
Market sizes for each segment are provided for the historical period (2019-2024), the base year (2025), and the forecast period (2025-2033), along with detailed competitive analysis.
Key Drivers of Payment Industry in Italy Growth
The growth of the Italian payment industry is fueled by several factors: Increasing smartphone and internet penetration are driving the shift towards digital payments. Government initiatives promoting digitalization are fostering innovation and competition. The expansion of e-commerce is further increasing demand for online payment solutions. Favorable economic conditions contribute to increased consumer spending and transaction volumes. The growing adoption of contactless payment methods is also contributing to overall growth.
Challenges in the Payment Industry in Italy Sector
The Italian payment industry faces several challenges. Regulatory hurdles and compliance requirements can be complex and costly. Concerns about data security and fraud prevention remain significant. Competition among established players and emerging fintech companies is intense, putting pressure on pricing and profitability margins. Supply chain disruptions may occasionally affect the availability of payment processing equipment.
Emerging Opportunities in Payment Industry in Italy
The Italian payment industry presents several opportunities. The growing popularity of BNPL services represents a substantial emerging market segment. The expansion of mobile wallets and contactless payment methods offers further growth potential. The increased adoption of open banking provides opportunities for developing innovative payment solutions. Furthermore, serving the underserved segments of the population could unlock significant market expansion.
Leading Players in the Payment Industry in Italy Market
- Apple Pay
- Bancomat Pay
- Amazon Pay
- MasterCard
- PayPal
- CartaSi
- Postepay
- MyBank
- Visa
- American Express
Key Developments in Payment Industry in Italy Industry
- November 2021: BBVA partnered with Banca Sella to offer payment services via Fabrick, providing access to local payment services for international and Italian customers.
- January 2022: Worldline acquired Axepta Italy, strengthening its presence in the Italian market.
These developments highlight the strategic moves and consolidation taking place within the industry, influencing its competitive dynamics and future trajectory.
Strategic Outlook for Payment Industry in Italy Market
The Italian payment industry is poised for continued growth, driven by technological innovation, evolving consumer preferences, and supportive regulatory frameworks. Opportunities exist in expanding digital payment adoption, developing innovative solutions, and capitalizing on the growth of e-commerce and mobile commerce. The market's future will be shaped by the interplay of established players, emerging fintechs, and regulatory developments. The strategic focus will likely be on enhancing security, improving the user experience, and expanding into new market segments.
Payment Industry in Italy Segmentation
-
1. Mode of Payment
-
1.1. Point of Sale
- 1.1.1. Card Pay
- 1.1.2. Digital Wallet (includes Mobile Wallets)
- 1.1.3. Cash
- 1.1.4. Others
- 1.2. Online Sale
-
1.1. Point of Sale
-
2. End-user Industry
- 2.1. Retail
- 2.2. Entertainment
- 2.3. Healthcare
- 2.4. Hospitality
- 2.5. Other End-user Industries
Payment Industry in Italy Segmentation By Geography
-
1. North America
- 1.1. United States
- 1.2. Canada
- 1.3. Mexico
-
2. South America
- 2.1. Brazil
- 2.2. Argentina
- 2.3. Rest of South America
-
3. Europe
- 3.1. United Kingdom
- 3.2. Germany
- 3.3. France
- 3.4. Italy
- 3.5. Spain
- 3.6. Russia
- 3.7. Benelux
- 3.8. Nordics
- 3.9. Rest of Europe
-
4. Middle East & Africa
- 4.1. Turkey
- 4.2. Israel
- 4.3. GCC
- 4.4. North Africa
- 4.5. South Africa
- 4.6. Rest of Middle East & Africa
-
5. Asia Pacific
- 5.1. China
- 5.2. India
- 5.3. Japan
- 5.4. South Korea
- 5.5. ASEAN
- 5.6. Oceania
- 5.7. Rest of Asia Pacific
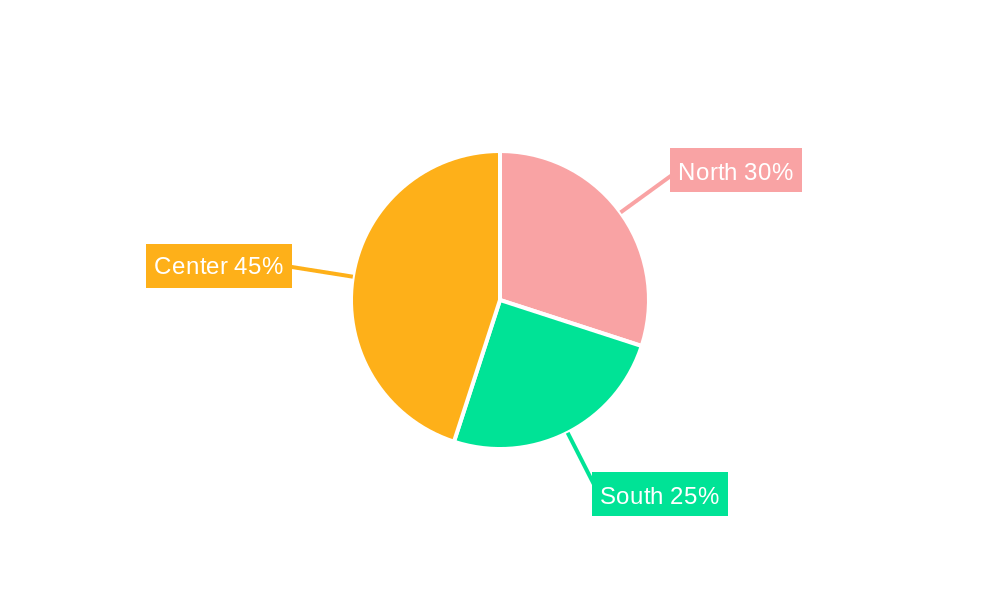
Payment Industry in Italy Regional Market Share
Geographic Coverage of Payment Industry in Italy
Payment Industry in Italy REPORT HIGHLIGHTS
| Aspects | Details |
|---|---|
| Study Period | 2020-2034 |
| Base Year | 2025 |
| Estimated Year | 2026 |
| Forecast Period | 2026-2034 |
| Historical Period | 2020-2025 |
| Growth Rate | CAGR of 6% from 2020-2034 |
| Segmentation |
|
Table of Contents
- 1. Introduction
- 1.1. Research Scope
- 1.2. Market Segmentation
- 1.3. Research Objective
- 1.4. Definitions and Assumptions
- 2. Executive Summary
- 2.1. Market Snapshot
- 3. Market Dynamics
- 3.1. Market Drivers
- 3.2. Market Restrains
- 3.3. Market Trends
- 3.4. Market Opportunities
- 4. Market Factor Analysis
- 4.1. Porters Five Forces
- 4.1.1. Bargaining Power of Suppliers
- 4.1.2. Bargaining Power of Buyers
- 4.1.3. Threat of New Entrants
- 4.1.4. Threat of Substitutes
- 4.1.5. Competitive Rivalry
- 4.2. PESTEL analysis
- 4.3. BCG Analysis
- 4.3.1. Stars (High Growth, High Market Share)
- 4.3.2. Cash Cows (Low Growth, High Market Share)
- 4.3.3. Question Mark (High Growth, Low Market Share)
- 4.3.4. Dogs (Low Growth, Low Market Share)
- 4.4. Ansoff Matrix Analysis
- 4.5. Supply Chain Analysis
- 4.6. Regulatory Landscape
- 4.7. Current Market Potential and Opportunity Assessment (TAM–SAM–SOM Framework)
- 4.8. RAX Analyst Note
- 4.1. Porters Five Forces
- 5. Market Analysis, Insights and Forecast 2021-2033
- 5.1. Market Analysis, Insights and Forecast - by Mode of Payment
- 5.1.1. Point of Sale
- 5.1.1.1. Card Pay
- 5.1.1.2. Digital Wallet (includes Mobile Wallets)
- 5.1.1.3. Cash
- 5.1.1.4. Others
- 5.1.2. Online Sale
- 5.1.1. Point of Sale
- 5.2. Market Analysis, Insights and Forecast - by End-user Industry
- 5.2.1. Retail
- 5.2.2. Entertainment
- 5.2.3. Healthcare
- 5.2.4. Hospitality
- 5.2.5. Other End-user Industries
- 5.3. Market Analysis, Insights and Forecast - by Region
- 5.3.1. North America
- 5.3.2. South America
- 5.3.3. Europe
- 5.3.4. Middle East & Africa
- 5.3.5. Asia Pacific
- 5.1. Market Analysis, Insights and Forecast - by Mode of Payment
- 6. Global Payment Industry in Italy Analysis, Insights and Forecast, 2021-2033
- 6.1. Market Analysis, Insights and Forecast - by Mode of Payment
- 6.1.1. Point of Sale
- 6.1.1.1. Card Pay
- 6.1.1.2. Digital Wallet (includes Mobile Wallets)
- 6.1.1.3. Cash
- 6.1.1.4. Others
- 6.1.2. Online Sale
- 6.1.1. Point of Sale
- 6.2. Market Analysis, Insights and Forecast - by End-user Industry
- 6.2.1. Retail
- 6.2.2. Entertainment
- 6.2.3. Healthcare
- 6.2.4. Hospitality
- 6.2.5. Other End-user Industries
- 6.1. Market Analysis, Insights and Forecast - by Mode of Payment
- 7. North America Payment Industry in Italy Analysis, Insights and Forecast, 2020-2032
- 7.1. Market Analysis, Insights and Forecast - by Mode of Payment
- 7.1.1. Point of Sale
- 7.1.1.1. Card Pay
- 7.1.1.2. Digital Wallet (includes Mobile Wallets)
- 7.1.1.3. Cash
- 7.1.1.4. Others
- 7.1.2. Online Sale
- 7.1.1. Point of Sale
- 7.2. Market Analysis, Insights and Forecast - by End-user Industry
- 7.2.1. Retail
- 7.2.2. Entertainment
- 7.2.3. Healthcare
- 7.2.4. Hospitality
- 7.2.5. Other End-user Industries
- 7.1. Market Analysis, Insights and Forecast - by Mode of Payment
- 8. South America Payment Industry in Italy Analysis, Insights and Forecast, 2020-2032
- 8.1. Market Analysis, Insights and Forecast - by Mode of Payment
- 8.1.1. Point of Sale
- 8.1.1.1. Card Pay
- 8.1.1.2. Digital Wallet (includes Mobile Wallets)
- 8.1.1.3. Cash
- 8.1.1.4. Others
- 8.1.2. Online Sale
- 8.1.1. Point of Sale
- 8.2. Market Analysis, Insights and Forecast - by End-user Industry
- 8.2.1. Retail
- 8.2.2. Entertainment
- 8.2.3. Healthcare
- 8.2.4. Hospitality
- 8.2.5. Other End-user Industries
- 8.1. Market Analysis, Insights and Forecast - by Mode of Payment
- 9. Europe Payment Industry in Italy Analysis, Insights and Forecast, 2020-2032
- 9.1. Market Analysis, Insights and Forecast - by Mode of Payment
- 9.1.1. Point of Sale
- 9.1.1.1. Card Pay
- 9.1.1.2. Digital Wallet (includes Mobile Wallets)
- 9.1.1.3. Cash
- 9.1.1.4. Others
- 9.1.2. Online Sale
- 9.1.1. Point of Sale
- 9.2. Market Analysis, Insights and Forecast - by End-user Industry
- 9.2.1. Retail
- 9.2.2. Entertainment
- 9.2.3. Healthcare
- 9.2.4. Hospitality
- 9.2.5. Other End-user Industries
- 9.1. Market Analysis, Insights and Forecast - by Mode of Payment
- 10. Middle East & Africa Payment Industry in Italy Analysis, Insights and Forecast, 2020-2032
- 10.1. Market Analysis, Insights and Forecast - by Mode of Payment
- 10.1.1. Point of Sale
- 10.1.1.1. Card Pay
- 10.1.1.2. Digital Wallet (includes Mobile Wallets)
- 10.1.1.3. Cash
- 10.1.1.4. Others
- 10.1.2. Online Sale
- 10.1.1. Point of Sale
- 10.2. Market Analysis, Insights and Forecast - by End-user Industry
- 10.2.1. Retail
- 10.2.2. Entertainment
- 10.2.3. Healthcare
- 10.2.4. Hospitality
- 10.2.5. Other End-user Industries
- 10.1. Market Analysis, Insights and Forecast - by Mode of Payment
- 11. Asia Pacific Payment Industry in Italy Analysis, Insights and Forecast, 2020-2032
- 11.1. Market Analysis, Insights and Forecast - by Mode of Payment
- 11.1.1. Point of Sale
- 11.1.1.1. Card Pay
- 11.1.1.2. Digital Wallet (includes Mobile Wallets)
- 11.1.1.3. Cash
- 11.1.1.4. Others
- 11.1.2. Online Sale
- 11.1.1. Point of Sale
- 11.2. Market Analysis, Insights and Forecast - by End-user Industry
- 11.2.1. Retail
- 11.2.2. Entertainment
- 11.2.3. Healthcare
- 11.2.4. Hospitality
- 11.2.5. Other End-user Industries
- 11.1. Market Analysis, Insights and Forecast - by Mode of Payment
- 12. Competitive Analysis
- 12.1. Company Profiles
- 12.1.1 Apple Pay
- 12.1.1.1. Company Overview
- 12.1.1.2. Products
- 12.1.1.3. Company Financials
- 12.1.1.4. SWOT Analysis
- 12.1.2 Bancomat Pay
- 12.1.2.1. Company Overview
- 12.1.2.2. Products
- 12.1.2.3. Company Financials
- 12.1.2.4. SWOT Analysis
- 12.1.3 Amazon Pay
- 12.1.3.1. Company Overview
- 12.1.3.2. Products
- 12.1.3.3. Company Financials
- 12.1.3.4. SWOT Analysis
- 12.1.4 MasterCard
- 12.1.4.1. Company Overview
- 12.1.4.2. Products
- 12.1.4.3. Company Financials
- 12.1.4.4. SWOT Analysis
- 12.1.5 PayPal
- 12.1.5.1. Company Overview
- 12.1.5.2. Products
- 12.1.5.3. Company Financials
- 12.1.5.4. SWOT Analysis
- 12.1.6 CartaSi
- 12.1.6.1. Company Overview
- 12.1.6.2. Products
- 12.1.6.3. Company Financials
- 12.1.6.4. SWOT Analysis
- 12.1.7 Postepay
- 12.1.7.1. Company Overview
- 12.1.7.2. Products
- 12.1.7.3. Company Financials
- 12.1.7.4. SWOT Analysis
- 12.1.8 MyBank
- 12.1.8.1. Company Overview
- 12.1.8.2. Products
- 12.1.8.3. Company Financials
- 12.1.8.4. SWOT Analysis
- 12.1.9 Visa
- 12.1.9.1. Company Overview
- 12.1.9.2. Products
- 12.1.9.3. Company Financials
- 12.1.9.4. SWOT Analysis
- 12.1.10 American Express
- 12.1.10.1. Company Overview
- 12.1.10.2. Products
- 12.1.10.3. Company Financials
- 12.1.10.4. SWOT Analysis
- 12.1.1 Apple Pay
- 12.2. Market Entropy
- 12.2.1 Company's Key Areas Served
- 12.2.2 Recent Developments
- 12.3. Company Market Share Analysis 2025
- 12.3.1 Top 5 Companies Market Share Analysis
- 12.3.2 Top 3 Companies Market Share Analysis
- 12.4. List of Potential Customers
- 13. Research Methodology
List of Figures
- Figure 1: Global Payment Industry in Italy Revenue Breakdown (billion, %) by Region 2025 & 2033
- Figure 2: Global Payment Industry in Italy Volume Breakdown (K Unit, %) by Region 2025 & 2033
- Figure 3: North America Payment Industry in Italy Revenue (billion), by Mode of Payment 2025 & 2033
- Figure 4: North America Payment Industry in Italy Volume (K Unit), by Mode of Payment 2025 & 2033
- Figure 5: North America Payment Industry in Italy Revenue Share (%), by Mode of Payment 2025 & 2033
- Figure 6: North America Payment Industry in Italy Volume Share (%), by Mode of Payment 2025 & 2033
- Figure 7: North America Payment Industry in Italy Revenue (billion), by End-user Industry 2025 & 2033
- Figure 8: North America Payment Industry in Italy Volume (K Unit), by End-user Industry 2025 & 2033
- Figure 9: North America Payment Industry in Italy Revenue Share (%), by End-user Industry 2025 & 2033
- Figure 10: North America Payment Industry in Italy Volume Share (%), by End-user Industry 2025 & 2033
- Figure 11: North America Payment Industry in Italy Revenue (billion), by Country 2025 & 2033
- Figure 12: North America Payment Industry in Italy Volume (K Unit), by Country 2025 & 2033
- Figure 13: North America Payment Industry in Italy Revenue Share (%), by Country 2025 & 2033
- Figure 14: North America Payment Industry in Italy Volume Share (%), by Country 2025 & 2033
- Figure 15: South America Payment Industry in Italy Revenue (billion), by Mode of Payment 2025 & 2033
- Figure 16: South America Payment Industry in Italy Volume (K Unit), by Mode of Payment 2025 & 2033
- Figure 17: South America Payment Industry in Italy Revenue Share (%), by Mode of Payment 2025 & 2033
- Figure 18: South America Payment Industry in Italy Volume Share (%), by Mode of Payment 2025 & 2033
- Figure 19: South America Payment Industry in Italy Revenue (billion), by End-user Industry 2025 & 2033
- Figure 20: South America Payment Industry in Italy Volume (K Unit), by End-user Industry 2025 & 2033
- Figure 21: South America Payment Industry in Italy Revenue Share (%), by End-user Industry 2025 & 2033
- Figure 22: South America Payment Industry in Italy Volume Share (%), by End-user Industry 2025 & 2033
- Figure 23: South America Payment Industry in Italy Revenue (billion), by Country 2025 & 2033
- Figure 24: South America Payment Industry in Italy Volume (K Unit), by Country 2025 & 2033
- Figure 25: South America Payment Industry in Italy Revenue Share (%), by Country 2025 & 2033
- Figure 26: South America Payment Industry in Italy Volume Share (%), by Country 2025 & 2033
- Figure 27: Europe Payment Industry in Italy Revenue (billion), by Mode of Payment 2025 & 2033
- Figure 28: Europe Payment Industry in Italy Volume (K Unit), by Mode of Payment 2025 & 2033
- Figure 29: Europe Payment Industry in Italy Revenue Share (%), by Mode of Payment 2025 & 2033
- Figure 30: Europe Payment Industry in Italy Volume Share (%), by Mode of Payment 2025 & 2033
- Figure 31: Europe Payment Industry in Italy Revenue (billion), by End-user Industry 2025 & 2033
- Figure 32: Europe Payment Industry in Italy Volume (K Unit), by End-user Industry 2025 & 2033
- Figure 33: Europe Payment Industry in Italy Revenue Share (%), by End-user Industry 2025 & 2033
- Figure 34: Europe Payment Industry in Italy Volume Share (%), by End-user Industry 2025 & 2033
- Figure 35: Europe Payment Industry in Italy Revenue (billion), by Country 2025 & 2033
- Figure 36: Europe Payment Industry in Italy Volume (K Unit), by Country 2025 & 2033
- Figure 37: Europe Payment Industry in Italy Revenue Share (%), by Country 2025 & 2033
- Figure 38: Europe Payment Industry in Italy Volume Share (%), by Country 2025 & 2033
- Figure 39: Middle East & Africa Payment Industry in Italy Revenue (billion), by Mode of Payment 2025 & 2033
- Figure 40: Middle East & Africa Payment Industry in Italy Volume (K Unit), by Mode of Payment 2025 & 2033
- Figure 41: Middle East & Africa Payment Industry in Italy Revenue Share (%), by Mode of Payment 2025 & 2033
- Figure 42: Middle East & Africa Payment Industry in Italy Volume Share (%), by Mode of Payment 2025 & 2033
- Figure 43: Middle East & Africa Payment Industry in Italy Revenue (billion), by End-user Industry 2025 & 2033
- Figure 44: Middle East & Africa Payment Industry in Italy Volume (K Unit), by End-user Industry 2025 & 2033
- Figure 45: Middle East & Africa Payment Industry in Italy Revenue Share (%), by End-user Industry 2025 & 2033
- Figure 46: Middle East & Africa Payment Industry in Italy Volume Share (%), by End-user Industry 2025 & 2033
- Figure 47: Middle East & Africa Payment Industry in Italy Revenue (billion), by Country 2025 & 2033
- Figure 48: Middle East & Africa Payment Industry in Italy Volume (K Unit), by Country 2025 & 2033
- Figure 49: Middle East & Africa Payment Industry in Italy Revenue Share (%), by Country 2025 & 2033
- Figure 50: Middle East & Africa Payment Industry in Italy Volume Share (%), by Country 2025 & 2033
- Figure 51: Asia Pacific Payment Industry in Italy Revenue (billion), by Mode of Payment 2025 & 2033
- Figure 52: Asia Pacific Payment Industry in Italy Volume (K Unit), by Mode of Payment 2025 & 2033
- Figure 53: Asia Pacific Payment Industry in Italy Revenue Share (%), by Mode of Payment 2025 & 2033
- Figure 54: Asia Pacific Payment Industry in Italy Volume Share (%), by Mode of Payment 2025 & 2033
- Figure 55: Asia Pacific Payment Industry in Italy Revenue (billion), by End-user Industry 2025 & 2033
- Figure 56: Asia Pacific Payment Industry in Italy Volume (K Unit), by End-user Industry 2025 & 2033
- Figure 57: Asia Pacific Payment Industry in Italy Revenue Share (%), by End-user Industry 2025 & 2033
- Figure 58: Asia Pacific Payment Industry in Italy Volume Share (%), by End-user Industry 2025 & 2033
- Figure 59: Asia Pacific Payment Industry in Italy Revenue (billion), by Country 2025 & 2033
- Figure 60: Asia Pacific Payment Industry in Italy Volume (K Unit), by Country 2025 & 2033
- Figure 61: Asia Pacific Payment Industry in Italy Revenue Share (%), by Country 2025 & 2033
- Figure 62: Asia Pacific Payment Industry in Italy Volume Share (%), by Country 2025 & 2033
List of Tables
- Table 1: Global Payment Industry in Italy Revenue billion Forecast, by Mode of Payment 2020 & 2033
- Table 2: Global Payment Industry in Italy Volume K Unit Forecast, by Mode of Payment 2020 & 2033
- Table 3: Global Payment Industry in Italy Revenue billion Forecast, by End-user Industry 2020 & 2033
- Table 4: Global Payment Industry in Italy Volume K Unit Forecast, by End-user Industry 2020 & 2033
- Table 5: Global Payment Industry in Italy Revenue billion Forecast, by Region 2020 & 2033
- Table 6: Global Payment Industry in Italy Volume K Unit Forecast, by Region 2020 & 2033
- Table 7: Global Payment Industry in Italy Revenue billion Forecast, by Mode of Payment 2020 & 2033
- Table 8: Global Payment Industry in Italy Volume K Unit Forecast, by Mode of Payment 2020 & 2033
- Table 9: Global Payment Industry in Italy Revenue billion Forecast, by End-user Industry 2020 & 2033
- Table 10: Global Payment Industry in Italy Volume K Unit Forecast, by End-user Industry 2020 & 2033
- Table 11: Global Payment Industry in Italy Revenue billion Forecast, by Country 2020 & 2033
- Table 12: Global Payment Industry in Italy Volume K Unit Forecast, by Country 2020 & 2033
- Table 13: United States Payment Industry in Italy Revenue (billion) Forecast, by Application 2020 & 2033
- Table 14: United States Payment Industry in Italy Volume (K Unit) Forecast, by Application 2020 & 2033
- Table 15: Canada Payment Industry in Italy Revenue (billion) Forecast, by Application 2020 & 2033
- Table 16: Canada Payment Industry in Italy Volume (K Unit) Forecast, by Application 2020 & 2033
- Table 17: Mexico Payment Industry in Italy Revenue (billion) Forecast, by Application 2020 & 2033
- Table 18: Mexico Payment Industry in Italy Volume (K Unit) Forecast, by Application 2020 & 2033
- Table 19: Global Payment Industry in Italy Revenue billion Forecast, by Mode of Payment 2020 & 2033
- Table 20: Global Payment Industry in Italy Volume K Unit Forecast, by Mode of Payment 2020 & 2033
- Table 21: Global Payment Industry in Italy Revenue billion Forecast, by End-user Industry 2020 & 2033
- Table 22: Global Payment Industry in Italy Volume K Unit Forecast, by End-user Industry 2020 & 2033
- Table 23: Global Payment Industry in Italy Revenue billion Forecast, by Country 2020 & 2033
- Table 24: Global Payment Industry in Italy Volume K Unit Forecast, by Country 2020 & 2033
- Table 25: Brazil Payment Industry in Italy Revenue (billion) Forecast, by Application 2020 & 2033
- Table 26: Brazil Payment Industry in Italy Volume (K Unit) Forecast, by Application 2020 & 2033
- Table 27: Argentina Payment Industry in Italy Revenue (billion) Forecast, by Application 2020 & 2033
- Table 28: Argentina Payment Industry in Italy Volume (K Unit) Forecast, by Application 2020 & 2033
- Table 29: Rest of South America Payment Industry in Italy Revenue (billion) Forecast, by Application 2020 & 2033
- Table 30: Rest of South America Payment Industry in Italy Volume (K Unit) Forecast, by Application 2020 & 2033
- Table 31: Global Payment Industry in Italy Revenue billion Forecast, by Mode of Payment 2020 & 2033
- Table 32: Global Payment Industry in Italy Volume K Unit Forecast, by Mode of Payment 2020 & 2033
- Table 33: Global Payment Industry in Italy Revenue billion Forecast, by End-user Industry 2020 & 2033
- Table 34: Global Payment Industry in Italy Volume K Unit Forecast, by End-user Industry 2020 & 2033
- Table 35: Global Payment Industry in Italy Revenue billion Forecast, by Country 2020 & 2033
- Table 36: Global Payment Industry in Italy Volume K Unit Forecast, by Country 2020 & 2033
- Table 37: United Kingdom Payment Industry in Italy Revenue (billion) Forecast, by Application 2020 & 2033
- Table 38: United Kingdom Payment Industry in Italy Volume (K Unit) Forecast, by Application 2020 & 2033
- Table 39: Germany Payment Industry in Italy Revenue (billion) Forecast, by Application 2020 & 2033
- Table 40: Germany Payment Industry in Italy Volume (K Unit) Forecast, by Application 2020 & 2033
- Table 41: France Payment Industry in Italy Revenue (billion) Forecast, by Application 2020 & 2033
- Table 42: France Payment Industry in Italy Volume (K Unit) Forecast, by Application 2020 & 2033
- Table 43: Italy Payment Industry in Italy Revenue (billion) Forecast, by Application 2020 & 2033
- Table 44: Italy Payment Industry in Italy Volume (K Unit) Forecast, by Application 2020 & 2033
- Table 45: Spain Payment Industry in Italy Revenue (billion) Forecast, by Application 2020 & 2033
- Table 46: Spain Payment Industry in Italy Volume (K Unit) Forecast, by Application 2020 & 2033
- Table 47: Russia Payment Industry in Italy Revenue (billion) Forecast, by Application 2020 & 2033
- Table 48: Russia Payment Industry in Italy Volume (K Unit) Forecast, by Application 2020 & 2033
- Table 49: Benelux Payment Industry in Italy Revenue (billion) Forecast, by Application 2020 & 2033
- Table 50: Benelux Payment Industry in Italy Volume (K Unit) Forecast, by Application 2020 & 2033
- Table 51: Nordics Payment Industry in Italy Revenue (billion) Forecast, by Application 2020 & 2033
- Table 52: Nordics Payment Industry in Italy Volume (K Unit) Forecast, by Application 2020 & 2033
- Table 53: Rest of Europe Payment Industry in Italy Revenue (billion) Forecast, by Application 2020 & 2033
- Table 54: Rest of Europe Payment Industry in Italy Volume (K Unit) Forecast, by Application 2020 & 2033
- Table 55: Global Payment Industry in Italy Revenue billion Forecast, by Mode of Payment 2020 & 2033
- Table 56: Global Payment Industry in Italy Volume K Unit Forecast, by Mode of Payment 2020 & 2033
- Table 57: Global Payment Industry in Italy Revenue billion Forecast, by End-user Industry 2020 & 2033
- Table 58: Global Payment Industry in Italy Volume K Unit Forecast, by End-user Industry 2020 & 2033
- Table 59: Global Payment Industry in Italy Revenue billion Forecast, by Country 2020 & 2033
- Table 60: Global Payment Industry in Italy Volume K Unit Forecast, by Country 2020 & 2033
- Table 61: Turkey Payment Industry in Italy Revenue (billion) Forecast, by Application 2020 & 2033
- Table 62: Turkey Payment Industry in Italy Volume (K Unit) Forecast, by Application 2020 & 2033
- Table 63: Israel Payment Industry in Italy Revenue (billion) Forecast, by Application 2020 & 2033
- Table 64: Israel Payment Industry in Italy Volume (K Unit) Forecast, by Application 2020 & 2033
- Table 65: GCC Payment Industry in Italy Revenue (billion) Forecast, by Application 2020 & 2033
- Table 66: GCC Payment Industry in Italy Volume (K Unit) Forecast, by Application 2020 & 2033
- Table 67: North Africa Payment Industry in Italy Revenue (billion) Forecast, by Application 2020 & 2033
- Table 68: North Africa Payment Industry in Italy Volume (K Unit) Forecast, by Application 2020 & 2033
- Table 69: South Africa Payment Industry in Italy Revenue (billion) Forecast, by Application 2020 & 2033
- Table 70: South Africa Payment Industry in Italy Volume (K Unit) Forecast, by Application 2020 & 2033
- Table 71: Rest of Middle East & Africa Payment Industry in Italy Revenue (billion) Forecast, by Application 2020 & 2033
- Table 72: Rest of Middle East & Africa Payment Industry in Italy Volume (K Unit) Forecast, by Application 2020 & 2033
- Table 73: Global Payment Industry in Italy Revenue billion Forecast, by Mode of Payment 2020 & 2033
- Table 74: Global Payment Industry in Italy Volume K Unit Forecast, by Mode of Payment 2020 & 2033
- Table 75: Global Payment Industry in Italy Revenue billion Forecast, by End-user Industry 2020 & 2033
- Table 76: Global Payment Industry in Italy Volume K Unit Forecast, by End-user Industry 2020 & 2033
- Table 77: Global Payment Industry in Italy Revenue billion Forecast, by Country 2020 & 2033
- Table 78: Global Payment Industry in Italy Volume K Unit Forecast, by Country 2020 & 2033
- Table 79: China Payment Industry in Italy Revenue (billion) Forecast, by Application 2020 & 2033
- Table 80: China Payment Industry in Italy Volume (K Unit) Forecast, by Application 2020 & 2033
- Table 81: India Payment Industry in Italy Revenue (billion) Forecast, by Application 2020 & 2033
- Table 82: India Payment Industry in Italy Volume (K Unit) Forecast, by Application 2020 & 2033
- Table 83: Japan Payment Industry in Italy Revenue (billion) Forecast, by Application 2020 & 2033
- Table 84: Japan Payment Industry in Italy Volume (K Unit) Forecast, by Application 2020 & 2033
- Table 85: South Korea Payment Industry in Italy Revenue (billion) Forecast, by Application 2020 & 2033
- Table 86: South Korea Payment Industry in Italy Volume (K Unit) Forecast, by Application 2020 & 2033
- Table 87: ASEAN Payment Industry in Italy Revenue (billion) Forecast, by Application 2020 & 2033
- Table 88: ASEAN Payment Industry in Italy Volume (K Unit) Forecast, by Application 2020 & 2033
- Table 89: Oceania Payment Industry in Italy Revenue (billion) Forecast, by Application 2020 & 2033
- Table 90: Oceania Payment Industry in Italy Volume (K Unit) Forecast, by Application 2020 & 2033
- Table 91: Rest of Asia Pacific Payment Industry in Italy Revenue (billion) Forecast, by Application 2020 & 2033
- Table 92: Rest of Asia Pacific Payment Industry in Italy Volume (K Unit) Forecast, by Application 2020 & 2033
Frequently Asked Questions
1. What is the projected Compound Annual Growth Rate (CAGR) of the Payment Industry in Italy?
The projected CAGR is approximately 6%.
2. Which companies are prominent players in the Payment Industry in Italy?
Key companies in the market include Apple Pay, Bancomat Pay, Amazon Pay, MasterCard, PayPal, CartaSi, Postepay, MyBank, Visa, American Express.
3. What are the main segments of the Payment Industry in Italy?
The market segments include Mode of Payment, End-user Industry.
4. Can you provide details about the market size?
The market size is estimated to be USD 14.63 billion as of 2022.
5. What are some drivers contributing to market growth?
Emerging payment methods are widely accepted; Increasing outward-looking consumer base willing to spend overseas; E-commerce is spreading rapidly. with cross-border e-commerce becoming aided by rising purchasing power..
6. What are the notable trends driving market growth?
Increasing Use of Digital Payments for Online Sale.
7. Are there any restraints impacting market growth?
Lack of Proper Computational Security Infrastructure.
8. Can you provide examples of recent developments in the market?
January 2022 - Worldline, a key European leader in the payments and transactional services industry, announced its acquisition of Axepta Italy. The partnership can be seen as a strategic approach by Worldline to enhance its scale, reach and direct presence in Italy.
9. What pricing options are available for accessing the report?
Pricing options include single-user, multi-user, and enterprise licenses priced at USD 3800, USD 4500, and USD 5800 respectively.
10. Is the market size provided in terms of value or volume?
The market size is provided in terms of value, measured in billion and volume, measured in K Unit.
11. Are there any specific market keywords associated with the report?
Yes, the market keyword associated with the report is "Payment Industry in Italy," which aids in identifying and referencing the specific market segment covered.
12. How do I determine which pricing option suits my needs best?
The pricing options vary based on user requirements and access needs. Individual users may opt for single-user licenses, while businesses requiring broader access may choose multi-user or enterprise licenses for cost-effective access to the report.
13. Are there any additional resources or data provided in the Payment Industry in Italy report?
While the report offers comprehensive insights, it's advisable to review the specific contents or supplementary materials provided to ascertain if additional resources or data are available.
14. How can I stay updated on further developments or reports in the Payment Industry in Italy?
To stay informed about further developments, trends, and reports in the Payment Industry in Italy, consider subscribing to industry newsletters, following relevant companies and organizations, or regularly checking reputable industry news sources and publications.
Methodology
Step 1 - Identification of Relevant Samples Size from Population Database


Step 2 - Approaches for Defining Global Market Size (Value, Volume* & Price*)

Note*: In applicable scenarios
Step 3 - Data Sources
Primary Research
- Web Analytics
- Survey Reports
- Research Institute
- Latest Research Reports
- Opinion Leaders
Secondary Research
- Annual Reports
- White Paper
- Latest Press Release
- Industry Association
- Paid Database
- Investor Presentations

Step 4 - Data Triangulation
Involves using different sources of information in order to increase the validity of a study
These sources are likely to be stakeholders in a program - participants, other researchers, program staff, other community members, and so on.
Then we put all data in single framework & apply various statistical tools to find out the dynamic on the market.
During the analysis stage, feedback from the stakeholder groups would be compared to determine areas of agreement as well as areas of divergence