Key Insights
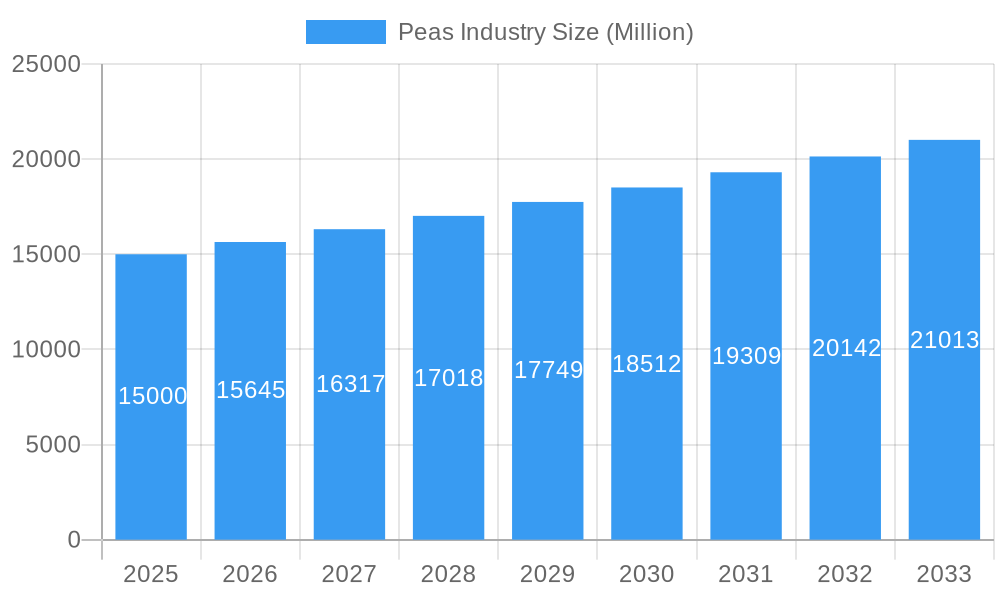
The global Peas Industry is poised for robust growth, projected to reach a market size of approximately USD 15,000 million by 2025, expanding at a Compound Annual Growth Rate (CAGR) of 4.30% through 2033. This upward trajectory is fueled by a confluence of escalating demand for plant-based proteins, increasing consumer awareness regarding the health benefits of peas, and their versatility as a sustainable ingredient across diverse food applications. The rising global population and the growing middle class are significant drivers, particularly in emerging economies within the Asia Pacific and South America regions, where dietary shifts towards healthier and more sustainable food options are gaining momentum. Furthermore, the inherent nutritional profile of peas, rich in protein, fiber, and essential vitamins and minerals, positions them as a key ingredient in the burgeoning functional food and health supplement markets. Innovations in pea processing and product development, leading to a wider array of pea-based ingredients like pea protein isolates, concentrates, and flours, are also instrumental in unlocking new market opportunities and catering to evolving consumer preferences.
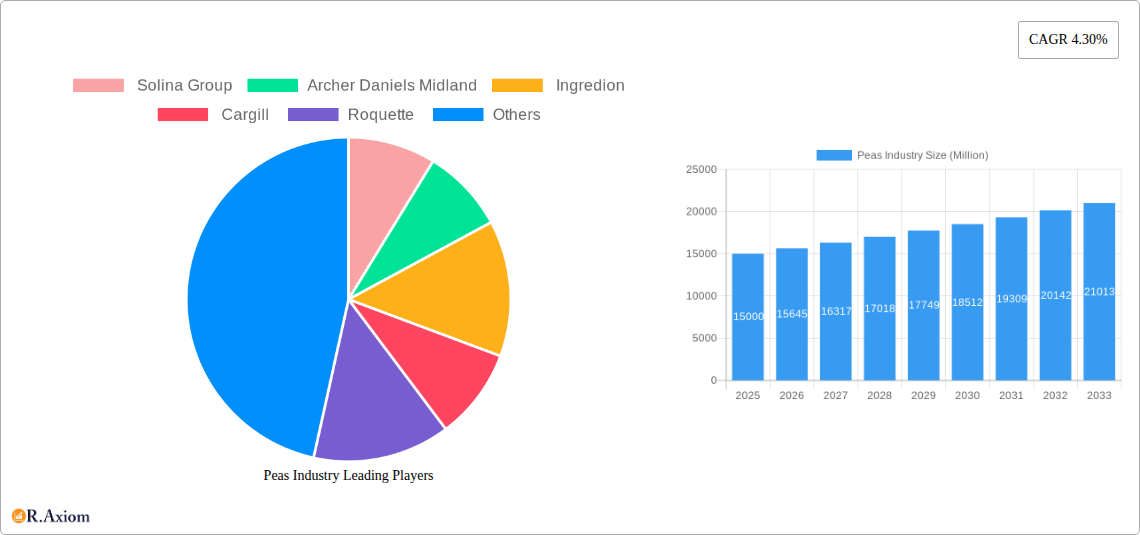
Peas Industry Market Size (In Billion)
Despite the promising outlook, the Peas Industry faces certain restraints that warrant strategic consideration. Fluctuations in raw material prices, influenced by weather patterns, agricultural yields, and geopolitical factors, can impact production costs and profitability. Competition from other pulse crops and alternative protein sources, such as soy, whey, and other plant-based proteins, also presents a challenge. Additionally, consumer perception and the need for further education regarding the taste and texture profiles of pea-based products in certain applications can influence market penetration. However, the industry is actively addressing these challenges through advancements in breeding, cultivation techniques, and sophisticated processing technologies that enhance the sensory attributes and functional properties of pea ingredients. The emphasis on sustainability, with peas being a relatively low-impact crop in terms of water usage and greenhouse gas emissions, further strengthens their appeal in an increasingly environmentally conscious global market. Leading players like Solina Group, Archer Daniels Midland, Ingredion, Cargill, and Roquette are actively investing in research and development to innovate and expand their product portfolios, capitalizing on the sustained growth potential of the global Peas Industry.
Peas Industry Company Market Share
This comprehensive report delves into the dynamic global Peas Industry, offering in-depth analysis and strategic insights for stakeholders. Spanning from 2019 to 2033, with a base and estimated year of 2025, this report provides a granular view of the market's historical performance, current standing, and future trajectory. Leveraging high-traffic keywords such as "pea protein," "plant-based ingredients," "agriculture," "food industry," and "global market analysis," this report aims to maximize search visibility and engage a broad spectrum of industry professionals, investors, and researchers. The analysis covers critical segments including Production Analysis, Consumption Analysis, Import/Export Markets (Value & Volume), and Price Trend Analysis, providing actionable intelligence for strategic decision-making in the evolving peas market.
Peas Industry Market Concentration & Innovation
The global Peas Industry exhibits a moderate to high market concentration, with key players like Solina Group, Archer Daniels Midland, Ingredion, Cargill, and Roquette dominating significant portions of the value chain. Innovation is a primary driver, fueled by the burgeoning demand for plant-based proteins and alternative food ingredients. Regulatory frameworks, particularly concerning food safety standards and labeling for plant-based products, play a crucial role in shaping market dynamics. Product substitutes, such as soy, rice, and other pulse proteins, present a competitive landscape, necessitating continuous product development and differentiation. End-user trends are strongly leaning towards health-conscious consumers seeking sustainable and ethically sourced food options, directly impacting the demand for peas and their derivatives. Mergers and acquisitions (M&A) activities, with recent deal values in the hundreds of millions, signal strategic consolidation and expansion efforts by leading companies to enhance their product portfolios and market reach within the peas sector. These M&A activities are critical in influencing market share and technological advancements.
Peas Industry Industry Trends & Insights
The Peas Industry is experiencing robust growth, driven by an increasing global consumer shift towards plant-based diets and a growing awareness of the environmental and health benefits associated with pea protein. The market is projected to witness a Compound Annual Growth Rate (CAGR) of approximately 7.5% over the forecast period of 2025–2033. Technological disruptions, particularly in processing and extraction techniques, are enabling the production of higher quality and more versatile pea ingredients, thereby expanding their applications across various sectors. Consumer preferences are increasingly favoring ingredients that are non-GMO, allergen-free, and sustainably produced, making peas an attractive alternative to traditional protein sources. The competitive dynamics within the industry are characterized by intense innovation in product development, strategic partnerships, and market penetration efforts by both established food corporations and emerging start-ups. The market penetration of pea-based products is steadily rising, particularly in developed economies, as food manufacturers integrate pea protein into a wider range of products, from plant-based meats and dairy alternatives to nutritional supplements and baked goods. The industry's ability to adapt to evolving consumer demands and leverage technological advancements will be critical for sustained growth and market leadership.
Dominant Markets & Segments in Peas Industry
North America and Europe currently dominate the global Peas Industry due to strong consumer demand for plant-based products and established food manufacturing infrastructure.
- Production Analysis: Key drivers for production dominance include favorable agricultural policies, technological advancements in crop cultivation, and the availability of arable land. Countries with significant pea cultivation, such as Canada and parts of Europe, are at the forefront.
- Consumption Analysis: The consumption analysis highlights a rapid growth in demand, driven by the rising popularity of plant-based diets. Health and wellness trends, coupled with concerns about animal agriculture's environmental impact, are major consumption drivers. The food and beverage sector represents the largest segment of consumption.
- Import Market Analysis (Value & Volume): Major importing regions are those with high consumption and insufficient domestic production, such as many Asian countries and parts of the Middle East. Economic policies that promote food security and trade agreements play a significant role in import volumes and values, which are estimated to be in the range of several billion dollars annually.
- Export Market Analysis (Value & Volume): Leading exporting nations, primarily Canada, are capitalizing on global demand. Favorable export policies, efficient logistics, and high-quality pea production are key to export market dominance. The export market value is projected to reach billions of dollars.
- Price Trend Analysis: Price trends are influenced by factors such as global supply and demand dynamics, input costs for agriculture (fertilizers, labor), geopolitical events impacting trade, and the fluctuating prices of competing protein sources. The price of peas and pea derivatives has seen a steady upward trend, influenced by increased demand and supply chain considerations.
Peas Industry Product Developments
Product developments in the Peas Industry are heavily focused on enhancing the functionality and appeal of pea-based ingredients. Innovations in pea protein isolate and concentrate extraction are yielding products with improved texture, flavor, and solubility, making them more versatile for food manufacturers. The development of organic pea starch and protein lines, as exemplified by Roquette's recent launches, caters to the growing demand for clean-label and sustainable ingredients. Competitive advantages are being carved out through the creation of specialized pea ingredients for specific applications, such as texturized pea protein for meat alternatives or functional pea starches for dairy-free products. Technological advancements in processing are also contributing to allergen-free formulations and improved nutritional profiles.
Report Scope & Segmentation Analysis
This report meticulously segments the Peas Industry across Production Analysis, Consumption Analysis, Import Market Analysis (Value & Volume), Export Market Analysis (Value & Volume), and Price Trend Analysis. Each segment is analyzed with projected growth rates, estimated market sizes in millions of dollars, and an assessment of competitive dynamics. The Production Analysis segment forecasts steady growth due to increased agricultural investment and the adoption of advanced farming techniques. Consumption Analysis reveals significant expansion, driven by evolving dietary habits and the rising demand for plant-based alternatives. Import and Export Market analyses highlight key trade flows and the value of international trade in peas and their derivatives, projected to reach billions of dollars. The Price Trend Analysis examines historical fluctuations and future projections, considering supply-demand imbalances and input costs.
Key Drivers of Peas Industry Growth
The Peas Industry's growth is propelled by several key drivers. The escalating global demand for plant-based protein sources, fueled by health and environmental consciousness, is paramount. Technological advancements in processing and extraction are enabling the development of superior pea ingredients with enhanced functionalities. Supportive government policies and initiatives promoting sustainable agriculture and alternative proteins also contribute significantly. Furthermore, the versatility of peas in various applications, from food and beverages to animal feed and industrial uses, broadens its market appeal. The increasing awareness of pea protein's hypoallergenic and non-GMO attributes further solidifies its position as a preferred ingredient.
Challenges in the Peas Industry Sector
Despite its promising growth, the Peas Industry faces several challenges. Regulatory hurdles related to novel food approvals and stringent quality standards can impede market entry for new products. Supply chain disruptions, including weather-related issues impacting crop yields and logistics, can lead to price volatility and availability concerns. The competitive pressure from other plant-based protein sources, such as soy and whey, necessitates continuous innovation and cost-effectiveness. Additionally, consumer perception and taste preferences for certain pea-based products still require significant development to rival established animal-based alternatives. Ensuring consistent quality and scalability of production remains a critical challenge for market expansion.
Emerging Opportunities in Peas Industry
The Peas Industry is ripe with emerging opportunities. The burgeoning market for clean-label and organic ingredients presents a significant avenue for growth. Expansion into emerging economies with rapidly growing middle classes and increasing health awareness offers vast untapped potential. Innovations in pea starch and protein applications for functional foods, pharmaceuticals, and personal care products are creating new market segments. Furthermore, the development of novel processing techniques to improve the nutritional profile and sensory attributes of pea-based products will unlock further opportunities. The growing interest in sustainable and circular economy models also favors pea-based products due to their lower environmental footprint.
Leading Players in the Peas Industry Market
- Solina Group
- Archer Daniels Midland
- Ingredion
- Cargill
- Roquette
Key Developments in Peas Industry Industry
- October 2022: Roquette, a global leader in plant-based ingredients and a pioneer of plant proteins, launched a new line of organic pea ingredients, organic pea starch, and organic pea protein in the North American and Europe markets to meet customer demand.
- September 2022: Pea growers will have two new options for next year's growing season, with the commercial release of PBA Noosa and PBA Taylor - Agriculture Victoria's latest high-yielding pea varieties. PBA Taylor is the best variety to grow in environments prone to virus diseases as it has resistance to two viruses - pea seed-borne mosaic virus and bean leafroll virus.
- March 2022: Birsa Agriculture University (BAU) developed a new variety Birsa Matar-1 which is adaptable to the climatic condition of Jharkhand, India. The species is also resistant to pests and diseases, which helps to increase productivity.
Strategic Outlook for Peas Industry Market
The strategic outlook for the Peas Industry is exceptionally positive, driven by sustained global demand for plant-based solutions and ongoing innovation. Key growth catalysts include the increasing integration of pea protein into diverse food and beverage categories, from dairy alternatives to meat substitutes, and its expanding use in nutritional supplements and functional foods. The focus on sustainable and ethically sourced ingredients further bolsters the market's potential. Continued investment in research and development for novel applications and improved ingredient functionalities will be crucial for maintaining competitive advantage. Emerging markets represent significant untapped potential, and strategic partnerships will be vital for market penetration and expansion. The industry is well-positioned for continued robust growth in the coming years.
Peas Industry Segmentation
- 1. Production Analysis
- 2. Consumption Analysis
- 3. Import Market Analysis (Value & Volume)
- 4. Export Market Analysis (Value & Volume)
- 5. Price Trend Analysis
Peas Industry Segmentation By Geography
-
1. North America
- 1.1. United States
- 1.2. Canada
-
2. Europe
- 2.1. Russia
- 2.2. United Kingdom
- 2.3. France
- 2.4. Ukraine
-
3. Asia Pacific
- 3.1. China
- 3.2. Australia
- 3.3. India
-
4. South America
- 4.1. Brazil
- 4.2. Argentina
-
5. Africa
- 5.1. South Africa
- 5.2. Egypt
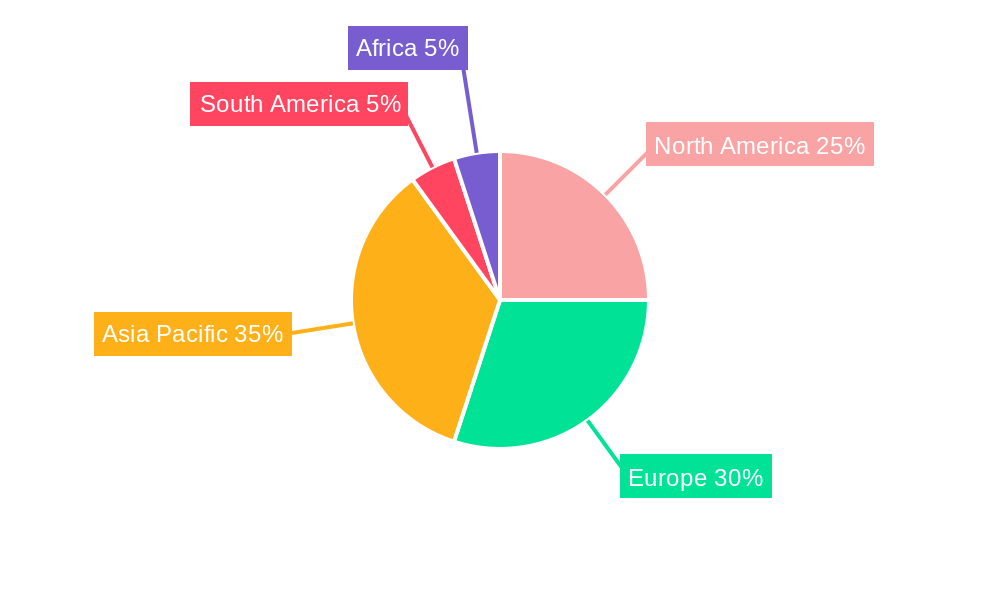
Peas Industry Regional Market Share
Geographic Coverage of Peas Industry
Peas Industry REPORT HIGHLIGHTS
| Aspects | Details |
|---|---|
| Study Period | 2020-2034 |
| Base Year | 2025 |
| Estimated Year | 2026 |
| Forecast Period | 2026-2034 |
| Historical Period | 2020-2025 |
| Growth Rate | CAGR of 4.30% from 2020-2034 |
| Segmentation |
|
Table of Contents
- 1. Introduction
- 1.1. Research Scope
- 1.2. Market Segmentation
- 1.3. Research Objective
- 1.4. Definitions and Assumptions
- 2. Executive Summary
- 2.1. Market Snapshot
- 3. Market Dynamics
- 3.1. Market Drivers
- 3.2. Market Restrains
- 3.3. Market Trends
- 3.4. Market Opportunities
- 4. Market Factor Analysis
- 4.1. Porters Five Forces
- 4.1.1. Bargaining Power of Suppliers
- 4.1.2. Bargaining Power of Buyers
- 4.1.3. Threat of New Entrants
- 4.1.4. Threat of Substitutes
- 4.1.5. Competitive Rivalry
- 4.2. PESTEL analysis
- 4.3. BCG Analysis
- 4.3.1. Stars (High Growth, High Market Share)
- 4.3.2. Cash Cows (Low Growth, High Market Share)
- 4.3.3. Question Mark (High Growth, Low Market Share)
- 4.3.4. Dogs (Low Growth, Low Market Share)
- 4.4. Ansoff Matrix Analysis
- 4.5. Supply Chain Analysis
- 4.6. Regulatory Landscape
- 4.7. Current Market Potential and Opportunity Assessment (TAM–SAM–SOM Framework)
- 4.8. RAX Analyst Note
- 4.1. Porters Five Forces
- 5. Market Analysis, Insights and Forecast 2021-2033
- 5.1. Market Analysis, Insights and Forecast - by Production Analysis
- 5.2. Market Analysis, Insights and Forecast - by Consumption Analysis
- 5.3. Market Analysis, Insights and Forecast - by Import Market Analysis (Value & Volume)
- 5.4. Market Analysis, Insights and Forecast - by Export Market Analysis (Value & Volume)
- 5.5. Market Analysis, Insights and Forecast - by Price Trend Analysis
- 5.6. Market Analysis, Insights and Forecast - by Region
- 5.6.1. North America
- 5.6.2. Europe
- 5.6.3. Asia Pacific
- 5.6.4. South America
- 5.6.5. Africa
- 6. Global Peas Industry Analysis, Insights and Forecast, 2021-2033
- 6.1. Market Analysis, Insights and Forecast - by Production Analysis
- 6.2. Market Analysis, Insights and Forecast - by Consumption Analysis
- 6.3. Market Analysis, Insights and Forecast - by Import Market Analysis (Value & Volume)
- 6.4. Market Analysis, Insights and Forecast - by Export Market Analysis (Value & Volume)
- 6.5. Market Analysis, Insights and Forecast - by Price Trend Analysis
- 7. North America Peas Industry Analysis, Insights and Forecast, 2020-2032
- 7.1. Market Analysis, Insights and Forecast - by Production Analysis
- 7.2. Market Analysis, Insights and Forecast - by Consumption Analysis
- 7.3. Market Analysis, Insights and Forecast - by Import Market Analysis (Value & Volume)
- 7.4. Market Analysis, Insights and Forecast - by Export Market Analysis (Value & Volume)
- 7.5. Market Analysis, Insights and Forecast - by Price Trend Analysis
- 8. Europe Peas Industry Analysis, Insights and Forecast, 2020-2032
- 8.1. Market Analysis, Insights and Forecast - by Production Analysis
- 8.2. Market Analysis, Insights and Forecast - by Consumption Analysis
- 8.3. Market Analysis, Insights and Forecast - by Import Market Analysis (Value & Volume)
- 8.4. Market Analysis, Insights and Forecast - by Export Market Analysis (Value & Volume)
- 8.5. Market Analysis, Insights and Forecast - by Price Trend Analysis
- 9. Asia Pacific Peas Industry Analysis, Insights and Forecast, 2020-2032
- 9.1. Market Analysis, Insights and Forecast - by Production Analysis
- 9.2. Market Analysis, Insights and Forecast - by Consumption Analysis
- 9.3. Market Analysis, Insights and Forecast - by Import Market Analysis (Value & Volume)
- 9.4. Market Analysis, Insights and Forecast - by Export Market Analysis (Value & Volume)
- 9.5. Market Analysis, Insights and Forecast - by Price Trend Analysis
- 10. South America Peas Industry Analysis, Insights and Forecast, 2020-2032
- 10.1. Market Analysis, Insights and Forecast - by Production Analysis
- 10.2. Market Analysis, Insights and Forecast - by Consumption Analysis
- 10.3. Market Analysis, Insights and Forecast - by Import Market Analysis (Value & Volume)
- 10.4. Market Analysis, Insights and Forecast - by Export Market Analysis (Value & Volume)
- 10.5. Market Analysis, Insights and Forecast - by Price Trend Analysis
- 11. Africa Peas Industry Analysis, Insights and Forecast, 2020-2032
- 11.1. Market Analysis, Insights and Forecast - by Production Analysis
- 11.2. Market Analysis, Insights and Forecast - by Consumption Analysis
- 11.3. Market Analysis, Insights and Forecast - by Import Market Analysis (Value & Volume)
- 11.4. Market Analysis, Insights and Forecast - by Export Market Analysis (Value & Volume)
- 11.5. Market Analysis, Insights and Forecast - by Price Trend Analysis
- 12. Competitive Analysis
- 12.1. Company Profiles
- 12.1.1 Solina Group
- 12.1.1.1. Company Overview
- 12.1.1.2. Products
- 12.1.1.3. Company Financials
- 12.1.1.4. SWOT Analysis
- 12.1.2 Archer Daniels Midland
- 12.1.2.1. Company Overview
- 12.1.2.2. Products
- 12.1.2.3. Company Financials
- 12.1.2.4. SWOT Analysis
- 12.1.3 Ingredion
- 12.1.3.1. Company Overview
- 12.1.3.2. Products
- 12.1.3.3. Company Financials
- 12.1.3.4. SWOT Analysis
- 12.1.4 Cargill
- 12.1.4.1. Company Overview
- 12.1.4.2. Products
- 12.1.4.3. Company Financials
- 12.1.4.4. SWOT Analysis
- 12.1.5 Roquette
- 12.1.5.1. Company Overview
- 12.1.5.2. Products
- 12.1.5.3. Company Financials
- 12.1.5.4. SWOT Analysis
- 12.1.1 Solina Group
- 12.2. Market Entropy
- 12.2.1 Company's Key Areas Served
- 12.2.2 Recent Developments
- 12.3. Company Market Share Analysis 2025
- 12.3.1 Top 5 Companies Market Share Analysis
- 12.3.2 Top 3 Companies Market Share Analysis
- 12.4. List of Potential Customers
- 13. Research Methodology
List of Figures
- Figure 1: Global Peas Industry Revenue Breakdown (Million, %) by Region 2025 & 2033
- Figure 2: Global Peas Industry Volume Breakdown (Kiloton, %) by Region 2025 & 2033
- Figure 3: North America Peas Industry Revenue (Million), by Production Analysis 2025 & 2033
- Figure 4: North America Peas Industry Volume (Kiloton), by Production Analysis 2025 & 2033
- Figure 5: North America Peas Industry Revenue Share (%), by Production Analysis 2025 & 2033
- Figure 6: North America Peas Industry Volume Share (%), by Production Analysis 2025 & 2033
- Figure 7: North America Peas Industry Revenue (Million), by Consumption Analysis 2025 & 2033
- Figure 8: North America Peas Industry Volume (Kiloton), by Consumption Analysis 2025 & 2033
- Figure 9: North America Peas Industry Revenue Share (%), by Consumption Analysis 2025 & 2033
- Figure 10: North America Peas Industry Volume Share (%), by Consumption Analysis 2025 & 2033
- Figure 11: North America Peas Industry Revenue (Million), by Import Market Analysis (Value & Volume) 2025 & 2033
- Figure 12: North America Peas Industry Volume (Kiloton), by Import Market Analysis (Value & Volume) 2025 & 2033
- Figure 13: North America Peas Industry Revenue Share (%), by Import Market Analysis (Value & Volume) 2025 & 2033
- Figure 14: North America Peas Industry Volume Share (%), by Import Market Analysis (Value & Volume) 2025 & 2033
- Figure 15: North America Peas Industry Revenue (Million), by Export Market Analysis (Value & Volume) 2025 & 2033
- Figure 16: North America Peas Industry Volume (Kiloton), by Export Market Analysis (Value & Volume) 2025 & 2033
- Figure 17: North America Peas Industry Revenue Share (%), by Export Market Analysis (Value & Volume) 2025 & 2033
- Figure 18: North America Peas Industry Volume Share (%), by Export Market Analysis (Value & Volume) 2025 & 2033
- Figure 19: North America Peas Industry Revenue (Million), by Price Trend Analysis 2025 & 2033
- Figure 20: North America Peas Industry Volume (Kiloton), by Price Trend Analysis 2025 & 2033
- Figure 21: North America Peas Industry Revenue Share (%), by Price Trend Analysis 2025 & 2033
- Figure 22: North America Peas Industry Volume Share (%), by Price Trend Analysis 2025 & 2033
- Figure 23: North America Peas Industry Revenue (Million), by Country 2025 & 2033
- Figure 24: North America Peas Industry Volume (Kiloton), by Country 2025 & 2033
- Figure 25: North America Peas Industry Revenue Share (%), by Country 2025 & 2033
- Figure 26: North America Peas Industry Volume Share (%), by Country 2025 & 2033
- Figure 27: Europe Peas Industry Revenue (Million), by Production Analysis 2025 & 2033
- Figure 28: Europe Peas Industry Volume (Kiloton), by Production Analysis 2025 & 2033
- Figure 29: Europe Peas Industry Revenue Share (%), by Production Analysis 2025 & 2033
- Figure 30: Europe Peas Industry Volume Share (%), by Production Analysis 2025 & 2033
- Figure 31: Europe Peas Industry Revenue (Million), by Consumption Analysis 2025 & 2033
- Figure 32: Europe Peas Industry Volume (Kiloton), by Consumption Analysis 2025 & 2033
- Figure 33: Europe Peas Industry Revenue Share (%), by Consumption Analysis 2025 & 2033
- Figure 34: Europe Peas Industry Volume Share (%), by Consumption Analysis 2025 & 2033
- Figure 35: Europe Peas Industry Revenue (Million), by Import Market Analysis (Value & Volume) 2025 & 2033
- Figure 36: Europe Peas Industry Volume (Kiloton), by Import Market Analysis (Value & Volume) 2025 & 2033
- Figure 37: Europe Peas Industry Revenue Share (%), by Import Market Analysis (Value & Volume) 2025 & 2033
- Figure 38: Europe Peas Industry Volume Share (%), by Import Market Analysis (Value & Volume) 2025 & 2033
- Figure 39: Europe Peas Industry Revenue (Million), by Export Market Analysis (Value & Volume) 2025 & 2033
- Figure 40: Europe Peas Industry Volume (Kiloton), by Export Market Analysis (Value & Volume) 2025 & 2033
- Figure 41: Europe Peas Industry Revenue Share (%), by Export Market Analysis (Value & Volume) 2025 & 2033
- Figure 42: Europe Peas Industry Volume Share (%), by Export Market Analysis (Value & Volume) 2025 & 2033
- Figure 43: Europe Peas Industry Revenue (Million), by Price Trend Analysis 2025 & 2033
- Figure 44: Europe Peas Industry Volume (Kiloton), by Price Trend Analysis 2025 & 2033
- Figure 45: Europe Peas Industry Revenue Share (%), by Price Trend Analysis 2025 & 2033
- Figure 46: Europe Peas Industry Volume Share (%), by Price Trend Analysis 2025 & 2033
- Figure 47: Europe Peas Industry Revenue (Million), by Country 2025 & 2033
- Figure 48: Europe Peas Industry Volume (Kiloton), by Country 2025 & 2033
- Figure 49: Europe Peas Industry Revenue Share (%), by Country 2025 & 2033
- Figure 50: Europe Peas Industry Volume Share (%), by Country 2025 & 2033
- Figure 51: Asia Pacific Peas Industry Revenue (Million), by Production Analysis 2025 & 2033
- Figure 52: Asia Pacific Peas Industry Volume (Kiloton), by Production Analysis 2025 & 2033
- Figure 53: Asia Pacific Peas Industry Revenue Share (%), by Production Analysis 2025 & 2033
- Figure 54: Asia Pacific Peas Industry Volume Share (%), by Production Analysis 2025 & 2033
- Figure 55: Asia Pacific Peas Industry Revenue (Million), by Consumption Analysis 2025 & 2033
- Figure 56: Asia Pacific Peas Industry Volume (Kiloton), by Consumption Analysis 2025 & 2033
- Figure 57: Asia Pacific Peas Industry Revenue Share (%), by Consumption Analysis 2025 & 2033
- Figure 58: Asia Pacific Peas Industry Volume Share (%), by Consumption Analysis 2025 & 2033
- Figure 59: Asia Pacific Peas Industry Revenue (Million), by Import Market Analysis (Value & Volume) 2025 & 2033
- Figure 60: Asia Pacific Peas Industry Volume (Kiloton), by Import Market Analysis (Value & Volume) 2025 & 2033
- Figure 61: Asia Pacific Peas Industry Revenue Share (%), by Import Market Analysis (Value & Volume) 2025 & 2033
- Figure 62: Asia Pacific Peas Industry Volume Share (%), by Import Market Analysis (Value & Volume) 2025 & 2033
- Figure 63: Asia Pacific Peas Industry Revenue (Million), by Export Market Analysis (Value & Volume) 2025 & 2033
- Figure 64: Asia Pacific Peas Industry Volume (Kiloton), by Export Market Analysis (Value & Volume) 2025 & 2033
- Figure 65: Asia Pacific Peas Industry Revenue Share (%), by Export Market Analysis (Value & Volume) 2025 & 2033
- Figure 66: Asia Pacific Peas Industry Volume Share (%), by Export Market Analysis (Value & Volume) 2025 & 2033
- Figure 67: Asia Pacific Peas Industry Revenue (Million), by Price Trend Analysis 2025 & 2033
- Figure 68: Asia Pacific Peas Industry Volume (Kiloton), by Price Trend Analysis 2025 & 2033
- Figure 69: Asia Pacific Peas Industry Revenue Share (%), by Price Trend Analysis 2025 & 2033
- Figure 70: Asia Pacific Peas Industry Volume Share (%), by Price Trend Analysis 2025 & 2033
- Figure 71: Asia Pacific Peas Industry Revenue (Million), by Country 2025 & 2033
- Figure 72: Asia Pacific Peas Industry Volume (Kiloton), by Country 2025 & 2033
- Figure 73: Asia Pacific Peas Industry Revenue Share (%), by Country 2025 & 2033
- Figure 74: Asia Pacific Peas Industry Volume Share (%), by Country 2025 & 2033
- Figure 75: South America Peas Industry Revenue (Million), by Production Analysis 2025 & 2033
- Figure 76: South America Peas Industry Volume (Kiloton), by Production Analysis 2025 & 2033
- Figure 77: South America Peas Industry Revenue Share (%), by Production Analysis 2025 & 2033
- Figure 78: South America Peas Industry Volume Share (%), by Production Analysis 2025 & 2033
- Figure 79: South America Peas Industry Revenue (Million), by Consumption Analysis 2025 & 2033
- Figure 80: South America Peas Industry Volume (Kiloton), by Consumption Analysis 2025 & 2033
- Figure 81: South America Peas Industry Revenue Share (%), by Consumption Analysis 2025 & 2033
- Figure 82: South America Peas Industry Volume Share (%), by Consumption Analysis 2025 & 2033
- Figure 83: South America Peas Industry Revenue (Million), by Import Market Analysis (Value & Volume) 2025 & 2033
- Figure 84: South America Peas Industry Volume (Kiloton), by Import Market Analysis (Value & Volume) 2025 & 2033
- Figure 85: South America Peas Industry Revenue Share (%), by Import Market Analysis (Value & Volume) 2025 & 2033
- Figure 86: South America Peas Industry Volume Share (%), by Import Market Analysis (Value & Volume) 2025 & 2033
- Figure 87: South America Peas Industry Revenue (Million), by Export Market Analysis (Value & Volume) 2025 & 2033
- Figure 88: South America Peas Industry Volume (Kiloton), by Export Market Analysis (Value & Volume) 2025 & 2033
- Figure 89: South America Peas Industry Revenue Share (%), by Export Market Analysis (Value & Volume) 2025 & 2033
- Figure 90: South America Peas Industry Volume Share (%), by Export Market Analysis (Value & Volume) 2025 & 2033
- Figure 91: South America Peas Industry Revenue (Million), by Price Trend Analysis 2025 & 2033
- Figure 92: South America Peas Industry Volume (Kiloton), by Price Trend Analysis 2025 & 2033
- Figure 93: South America Peas Industry Revenue Share (%), by Price Trend Analysis 2025 & 2033
- Figure 94: South America Peas Industry Volume Share (%), by Price Trend Analysis 2025 & 2033
- Figure 95: South America Peas Industry Revenue (Million), by Country 2025 & 2033
- Figure 96: South America Peas Industry Volume (Kiloton), by Country 2025 & 2033
- Figure 97: South America Peas Industry Revenue Share (%), by Country 2025 & 2033
- Figure 98: South America Peas Industry Volume Share (%), by Country 2025 & 2033
- Figure 99: Africa Peas Industry Revenue (Million), by Production Analysis 2025 & 2033
- Figure 100: Africa Peas Industry Volume (Kiloton), by Production Analysis 2025 & 2033
- Figure 101: Africa Peas Industry Revenue Share (%), by Production Analysis 2025 & 2033
- Figure 102: Africa Peas Industry Volume Share (%), by Production Analysis 2025 & 2033
- Figure 103: Africa Peas Industry Revenue (Million), by Consumption Analysis 2025 & 2033
- Figure 104: Africa Peas Industry Volume (Kiloton), by Consumption Analysis 2025 & 2033
- Figure 105: Africa Peas Industry Revenue Share (%), by Consumption Analysis 2025 & 2033
- Figure 106: Africa Peas Industry Volume Share (%), by Consumption Analysis 2025 & 2033
- Figure 107: Africa Peas Industry Revenue (Million), by Import Market Analysis (Value & Volume) 2025 & 2033
- Figure 108: Africa Peas Industry Volume (Kiloton), by Import Market Analysis (Value & Volume) 2025 & 2033
- Figure 109: Africa Peas Industry Revenue Share (%), by Import Market Analysis (Value & Volume) 2025 & 2033
- Figure 110: Africa Peas Industry Volume Share (%), by Import Market Analysis (Value & Volume) 2025 & 2033
- Figure 111: Africa Peas Industry Revenue (Million), by Export Market Analysis (Value & Volume) 2025 & 2033
- Figure 112: Africa Peas Industry Volume (Kiloton), by Export Market Analysis (Value & Volume) 2025 & 2033
- Figure 113: Africa Peas Industry Revenue Share (%), by Export Market Analysis (Value & Volume) 2025 & 2033
- Figure 114: Africa Peas Industry Volume Share (%), by Export Market Analysis (Value & Volume) 2025 & 2033
- Figure 115: Africa Peas Industry Revenue (Million), by Price Trend Analysis 2025 & 2033
- Figure 116: Africa Peas Industry Volume (Kiloton), by Price Trend Analysis 2025 & 2033
- Figure 117: Africa Peas Industry Revenue Share (%), by Price Trend Analysis 2025 & 2033
- Figure 118: Africa Peas Industry Volume Share (%), by Price Trend Analysis 2025 & 2033
- Figure 119: Africa Peas Industry Revenue (Million), by Country 2025 & 2033
- Figure 120: Africa Peas Industry Volume (Kiloton), by Country 2025 & 2033
- Figure 121: Africa Peas Industry Revenue Share (%), by Country 2025 & 2033
- Figure 122: Africa Peas Industry Volume Share (%), by Country 2025 & 2033
List of Tables
- Table 1: Global Peas Industry Revenue Million Forecast, by Production Analysis 2020 & 2033
- Table 2: Global Peas Industry Volume Kiloton Forecast, by Production Analysis 2020 & 2033
- Table 3: Global Peas Industry Revenue Million Forecast, by Consumption Analysis 2020 & 2033
- Table 4: Global Peas Industry Volume Kiloton Forecast, by Consumption Analysis 2020 & 2033
- Table 5: Global Peas Industry Revenue Million Forecast, by Import Market Analysis (Value & Volume) 2020 & 2033
- Table 6: Global Peas Industry Volume Kiloton Forecast, by Import Market Analysis (Value & Volume) 2020 & 2033
- Table 7: Global Peas Industry Revenue Million Forecast, by Export Market Analysis (Value & Volume) 2020 & 2033
- Table 8: Global Peas Industry Volume Kiloton Forecast, by Export Market Analysis (Value & Volume) 2020 & 2033
- Table 9: Global Peas Industry Revenue Million Forecast, by Price Trend Analysis 2020 & 2033
- Table 10: Global Peas Industry Volume Kiloton Forecast, by Price Trend Analysis 2020 & 2033
- Table 11: Global Peas Industry Revenue Million Forecast, by Region 2020 & 2033
- Table 12: Global Peas Industry Volume Kiloton Forecast, by Region 2020 & 2033
- Table 13: Global Peas Industry Revenue Million Forecast, by Production Analysis 2020 & 2033
- Table 14: Global Peas Industry Volume Kiloton Forecast, by Production Analysis 2020 & 2033
- Table 15: Global Peas Industry Revenue Million Forecast, by Consumption Analysis 2020 & 2033
- Table 16: Global Peas Industry Volume Kiloton Forecast, by Consumption Analysis 2020 & 2033
- Table 17: Global Peas Industry Revenue Million Forecast, by Import Market Analysis (Value & Volume) 2020 & 2033
- Table 18: Global Peas Industry Volume Kiloton Forecast, by Import Market Analysis (Value & Volume) 2020 & 2033
- Table 19: Global Peas Industry Revenue Million Forecast, by Export Market Analysis (Value & Volume) 2020 & 2033
- Table 20: Global Peas Industry Volume Kiloton Forecast, by Export Market Analysis (Value & Volume) 2020 & 2033
- Table 21: Global Peas Industry Revenue Million Forecast, by Price Trend Analysis 2020 & 2033
- Table 22: Global Peas Industry Volume Kiloton Forecast, by Price Trend Analysis 2020 & 2033
- Table 23: Global Peas Industry Revenue Million Forecast, by Country 2020 & 2033
- Table 24: Global Peas Industry Volume Kiloton Forecast, by Country 2020 & 2033
- Table 25: United States Peas Industry Revenue (Million) Forecast, by Application 2020 & 2033
- Table 26: United States Peas Industry Volume (Kiloton) Forecast, by Application 2020 & 2033
- Table 27: Canada Peas Industry Revenue (Million) Forecast, by Application 2020 & 2033
- Table 28: Canada Peas Industry Volume (Kiloton) Forecast, by Application 2020 & 2033
- Table 29: Global Peas Industry Revenue Million Forecast, by Production Analysis 2020 & 2033
- Table 30: Global Peas Industry Volume Kiloton Forecast, by Production Analysis 2020 & 2033
- Table 31: Global Peas Industry Revenue Million Forecast, by Consumption Analysis 2020 & 2033
- Table 32: Global Peas Industry Volume Kiloton Forecast, by Consumption Analysis 2020 & 2033
- Table 33: Global Peas Industry Revenue Million Forecast, by Import Market Analysis (Value & Volume) 2020 & 2033
- Table 34: Global Peas Industry Volume Kiloton Forecast, by Import Market Analysis (Value & Volume) 2020 & 2033
- Table 35: Global Peas Industry Revenue Million Forecast, by Export Market Analysis (Value & Volume) 2020 & 2033
- Table 36: Global Peas Industry Volume Kiloton Forecast, by Export Market Analysis (Value & Volume) 2020 & 2033
- Table 37: Global Peas Industry Revenue Million Forecast, by Price Trend Analysis 2020 & 2033
- Table 38: Global Peas Industry Volume Kiloton Forecast, by Price Trend Analysis 2020 & 2033
- Table 39: Global Peas Industry Revenue Million Forecast, by Country 2020 & 2033
- Table 40: Global Peas Industry Volume Kiloton Forecast, by Country 2020 & 2033
- Table 41: Russia Peas Industry Revenue (Million) Forecast, by Application 2020 & 2033
- Table 42: Russia Peas Industry Volume (Kiloton) Forecast, by Application 2020 & 2033
- Table 43: United Kingdom Peas Industry Revenue (Million) Forecast, by Application 2020 & 2033
- Table 44: United Kingdom Peas Industry Volume (Kiloton) Forecast, by Application 2020 & 2033
- Table 45: France Peas Industry Revenue (Million) Forecast, by Application 2020 & 2033
- Table 46: France Peas Industry Volume (Kiloton) Forecast, by Application 2020 & 2033
- Table 47: Ukraine Peas Industry Revenue (Million) Forecast, by Application 2020 & 2033
- Table 48: Ukraine Peas Industry Volume (Kiloton) Forecast, by Application 2020 & 2033
- Table 49: Global Peas Industry Revenue Million Forecast, by Production Analysis 2020 & 2033
- Table 50: Global Peas Industry Volume Kiloton Forecast, by Production Analysis 2020 & 2033
- Table 51: Global Peas Industry Revenue Million Forecast, by Consumption Analysis 2020 & 2033
- Table 52: Global Peas Industry Volume Kiloton Forecast, by Consumption Analysis 2020 & 2033
- Table 53: Global Peas Industry Revenue Million Forecast, by Import Market Analysis (Value & Volume) 2020 & 2033
- Table 54: Global Peas Industry Volume Kiloton Forecast, by Import Market Analysis (Value & Volume) 2020 & 2033
- Table 55: Global Peas Industry Revenue Million Forecast, by Export Market Analysis (Value & Volume) 2020 & 2033
- Table 56: Global Peas Industry Volume Kiloton Forecast, by Export Market Analysis (Value & Volume) 2020 & 2033
- Table 57: Global Peas Industry Revenue Million Forecast, by Price Trend Analysis 2020 & 2033
- Table 58: Global Peas Industry Volume Kiloton Forecast, by Price Trend Analysis 2020 & 2033
- Table 59: Global Peas Industry Revenue Million Forecast, by Country 2020 & 2033
- Table 60: Global Peas Industry Volume Kiloton Forecast, by Country 2020 & 2033
- Table 61: China Peas Industry Revenue (Million) Forecast, by Application 2020 & 2033
- Table 62: China Peas Industry Volume (Kiloton) Forecast, by Application 2020 & 2033
- Table 63: Australia Peas Industry Revenue (Million) Forecast, by Application 2020 & 2033
- Table 64: Australia Peas Industry Volume (Kiloton) Forecast, by Application 2020 & 2033
- Table 65: India Peas Industry Revenue (Million) Forecast, by Application 2020 & 2033
- Table 66: India Peas Industry Volume (Kiloton) Forecast, by Application 2020 & 2033
- Table 67: Global Peas Industry Revenue Million Forecast, by Production Analysis 2020 & 2033
- Table 68: Global Peas Industry Volume Kiloton Forecast, by Production Analysis 2020 & 2033
- Table 69: Global Peas Industry Revenue Million Forecast, by Consumption Analysis 2020 & 2033
- Table 70: Global Peas Industry Volume Kiloton Forecast, by Consumption Analysis 2020 & 2033
- Table 71: Global Peas Industry Revenue Million Forecast, by Import Market Analysis (Value & Volume) 2020 & 2033
- Table 72: Global Peas Industry Volume Kiloton Forecast, by Import Market Analysis (Value & Volume) 2020 & 2033
- Table 73: Global Peas Industry Revenue Million Forecast, by Export Market Analysis (Value & Volume) 2020 & 2033
- Table 74: Global Peas Industry Volume Kiloton Forecast, by Export Market Analysis (Value & Volume) 2020 & 2033
- Table 75: Global Peas Industry Revenue Million Forecast, by Price Trend Analysis 2020 & 2033
- Table 76: Global Peas Industry Volume Kiloton Forecast, by Price Trend Analysis 2020 & 2033
- Table 77: Global Peas Industry Revenue Million Forecast, by Country 2020 & 2033
- Table 78: Global Peas Industry Volume Kiloton Forecast, by Country 2020 & 2033
- Table 79: Brazil Peas Industry Revenue (Million) Forecast, by Application 2020 & 2033
- Table 80: Brazil Peas Industry Volume (Kiloton) Forecast, by Application 2020 & 2033
- Table 81: Argentina Peas Industry Revenue (Million) Forecast, by Application 2020 & 2033
- Table 82: Argentina Peas Industry Volume (Kiloton) Forecast, by Application 2020 & 2033
- Table 83: Global Peas Industry Revenue Million Forecast, by Production Analysis 2020 & 2033
- Table 84: Global Peas Industry Volume Kiloton Forecast, by Production Analysis 2020 & 2033
- Table 85: Global Peas Industry Revenue Million Forecast, by Consumption Analysis 2020 & 2033
- Table 86: Global Peas Industry Volume Kiloton Forecast, by Consumption Analysis 2020 & 2033
- Table 87: Global Peas Industry Revenue Million Forecast, by Import Market Analysis (Value & Volume) 2020 & 2033
- Table 88: Global Peas Industry Volume Kiloton Forecast, by Import Market Analysis (Value & Volume) 2020 & 2033
- Table 89: Global Peas Industry Revenue Million Forecast, by Export Market Analysis (Value & Volume) 2020 & 2033
- Table 90: Global Peas Industry Volume Kiloton Forecast, by Export Market Analysis (Value & Volume) 2020 & 2033
- Table 91: Global Peas Industry Revenue Million Forecast, by Price Trend Analysis 2020 & 2033
- Table 92: Global Peas Industry Volume Kiloton Forecast, by Price Trend Analysis 2020 & 2033
- Table 93: Global Peas Industry Revenue Million Forecast, by Country 2020 & 2033
- Table 94: Global Peas Industry Volume Kiloton Forecast, by Country 2020 & 2033
- Table 95: South Africa Peas Industry Revenue (Million) Forecast, by Application 2020 & 2033
- Table 96: South Africa Peas Industry Volume (Kiloton) Forecast, by Application 2020 & 2033
- Table 97: Egypt Peas Industry Revenue (Million) Forecast, by Application 2020 & 2033
- Table 98: Egypt Peas Industry Volume (Kiloton) Forecast, by Application 2020 & 2033
Frequently Asked Questions
1. What is the projected Compound Annual Growth Rate (CAGR) of the Peas Industry?
The projected CAGR is approximately 4.30%.
2. Which companies are prominent players in the Peas Industry?
Key companies in the market include Solina Group, Archer Daniels Midland, Ingredion, Cargill , Roquette .
3. What are the main segments of the Peas Industry?
The market segments include Production Analysis, Consumption Analysis, Import Market Analysis (Value & Volume), Export Market Analysis (Value & Volume), Price Trend Analysis.
4. Can you provide details about the market size?
The market size is estimated to be USD XXX Million as of 2022.
5. What are some drivers contributing to market growth?
Rising Consumption of Cashew Nuts in the Country; Favorable Government Initiatives.
6. What are the notable trends driving market growth?
Growing Demand for Pea Protein Consumption.
7. Are there any restraints impacting market growth?
Hazardous Climatic Condition Hinders Cashew Production; Stringent Regulations Related to Food Quality Standards.
8. Can you provide examples of recent developments in the market?
October 2022: Roquette, a global leader in plant-based ingredients and a pioneer of plant proteins, launched a new line of organic pea ingredients, organic pea starch, and organic pea protein in the North American and Europe markets to meet customer demand.
9. What pricing options are available for accessing the report?
Pricing options include single-user, multi-user, and enterprise licenses priced at USD 4750, USD 5250, and USD 8750 respectively.
10. Is the market size provided in terms of value or volume?
The market size is provided in terms of value, measured in Million and volume, measured in Kiloton.
11. Are there any specific market keywords associated with the report?
Yes, the market keyword associated with the report is "Peas Industry," which aids in identifying and referencing the specific market segment covered.
12. How do I determine which pricing option suits my needs best?
The pricing options vary based on user requirements and access needs. Individual users may opt for single-user licenses, while businesses requiring broader access may choose multi-user or enterprise licenses for cost-effective access to the report.
13. Are there any additional resources or data provided in the Peas Industry report?
While the report offers comprehensive insights, it's advisable to review the specific contents or supplementary materials provided to ascertain if additional resources or data are available.
14. How can I stay updated on further developments or reports in the Peas Industry?
To stay informed about further developments, trends, and reports in the Peas Industry, consider subscribing to industry newsletters, following relevant companies and organizations, or regularly checking reputable industry news sources and publications.
Methodology
Step 1 - Identification of Relevant Samples Size from Population Database


Step 2 - Approaches for Defining Global Market Size (Value, Volume* & Price*)

Note*: In applicable scenarios
Step 3 - Data Sources
Primary Research
- Web Analytics
- Survey Reports
- Research Institute
- Latest Research Reports
- Opinion Leaders
Secondary Research
- Annual Reports
- White Paper
- Latest Press Release
- Industry Association
- Paid Database
- Investor Presentations

Step 4 - Data Triangulation
Involves using different sources of information in order to increase the validity of a study
These sources are likely to be stakeholders in a program - participants, other researchers, program staff, other community members, and so on.
Then we put all data in single framework & apply various statistical tools to find out the dynamic on the market.
During the analysis stage, feedback from the stakeholder groups would be compared to determine areas of agreement as well as areas of divergence

