

Key Insights
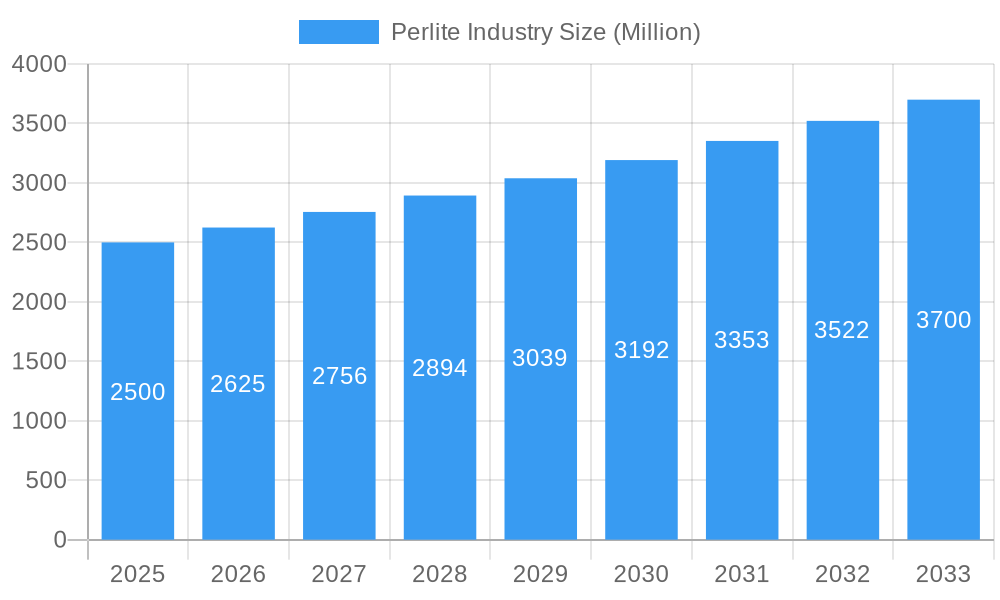
The global perlite market, valued at approximately $2.45 billion in 2025, is projected to achieve a Compound Annual Growth Rate (CAGR) of 5.78% between 2025 and 2033. This significant growth is propelled by escalating demand for lightweight, energy-efficient construction materials, driving perlite's use in insulation. The agricultural sector's expansion further boosts demand for agro-perlite, enhancing soil quality. The filtration and industrial sectors also contribute, utilizing perlite as a filter aid and abrasive. Technological innovations in processing and new applications further solidify market prospects. While raw material price volatility and environmental considerations present challenges, the overall market outlook is robust.
Perlite Industry Market Size (In Billion)
Regional dynamics indicate Asia-Pacific, led by China and India, will spearhead market growth due to robust infrastructure development and a thriving agricultural sector. North America and Europe will remain key contributors, driven by construction and sustainable building initiatives. Expanded perlite dominates product segments, followed by agro-perlite, aligning with construction and agricultural demands. Insulation applications are expected to lead due to the imperative for energy-efficient buildings. The market is characterized by fragmentation, with multinational corporations and regional players competing through innovation, strategic alliances, and geographic expansion.
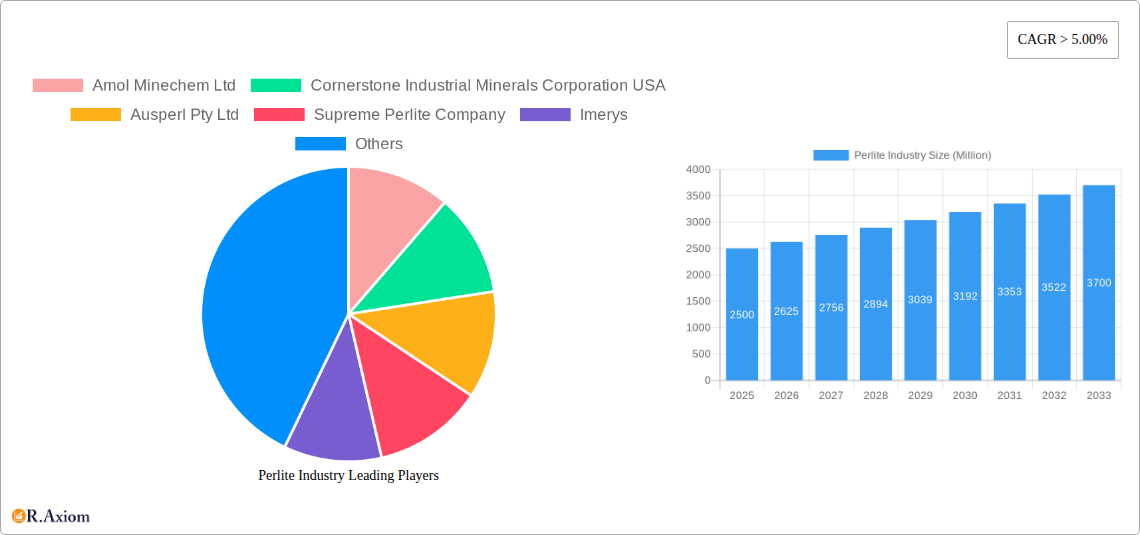
Perlite Industry Company Market Share
Perlite Industry: A Comprehensive Market Report (2019-2033)
This detailed report provides a comprehensive analysis of the global perlite industry, encompassing market size, growth projections, segment analysis, competitive landscape, and key industry trends from 2019 to 2033. The report leverages extensive research to offer actionable insights for industry stakeholders, investors, and businesses seeking to navigate this dynamic market. The study period spans 2019-2033, with 2025 serving as the base and estimated year. The forecast period is 2025-2033, while the historical period covers 2019-2024. The global market size is estimated at xx Million in 2025 and is projected to reach xx Million by 2033.
Perlite Industry Market Concentration & Innovation
The global perlite market exhibits a moderately concentrated structure, with a few major players holding significant market share. However, a number of smaller, regional players also contribute significantly to the overall market volume. The market share of the top five companies is estimated at approximately xx%, leaving ample opportunities for both established and emerging players. Innovation in the perlite industry is driven by the ongoing need for improved product performance, cost reduction, and sustainability. Key areas of innovation include developing higher-performance expanded perlite with enhanced insulation properties, exploring new applications for perlite in emerging industries, and optimizing production processes to improve efficiency and reduce environmental impact.
- Market Concentration: Top 5 players hold approximately xx% market share in 2025.
- Innovation Drivers: Improved product performance, cost reduction, sustainability initiatives.
- Regulatory Frameworks: Vary by region, impacting production and application.
- Product Substitutes: Include other insulation materials (e.g., fiberglass, cellulose), impacting market competitiveness.
- End-User Trends: Growing demand from construction, agriculture, and industrial sectors.
- M&A Activities: Recent deals, such as Titan Cement's acquisition of a share in Aegean Perlites in February 2023, reflect industry consolidation and strategic resource access. The total value of M&A deals in the period 2019-2024 is estimated at xx Million.
Perlite Industry Industry Trends & Insights
The perlite industry is experiencing significant growth, driven by several key factors. The increasing demand for sustainable building materials, coupled with stringent building codes promoting energy efficiency, has fueled the adoption of perlite in insulation applications. Furthermore, the growing awareness of perlite's versatility in various applications, including agriculture (agro-perlite), filtration, and fireproofing, has broadened its market reach. Technological advancements, such as the development of high-performance expanded perlite with improved thermal and acoustic insulation properties, are contributing to market expansion. The competitive landscape is characterized by both established players and emerging companies, leading to continuous innovation and product development. The global perlite market is projected to witness a CAGR of xx% during the forecast period (2025-2033), with market penetration steadily increasing across various sectors. Price increases announced by companies like Silica Holdings in April 2022 reflect ongoing inflationary pressures affecting raw materials and logistics.
Dominant Markets & Segments in Perlite Industry
The construction sector currently dominates the perlite market globally, with expanded perlite being the most widely used product type. Geographically, North America and Europe represent significant markets, driven by robust construction activity and stringent building codes emphasizing energy efficiency. However, Asia-Pacific is witnessing rapid growth, spurred by increasing infrastructure development and rising disposable incomes.
- Leading Region: North America currently holds the largest market share.
- Leading Country: United States holds significant market share within North America.
- Leading Product Type: Expanded perlite dominates the market due to its versatility and wide range of applications.
- Leading Application: Insulation is the dominant application segment, followed by fillers and filtration.
- Key Drivers (North America): Stringent building codes, high construction activity, energy efficiency mandates.
- Key Drivers (Asia-Pacific): Rising infrastructure development, increasing disposable incomes, industrialization.
Dominance Analysis: The dominance of North America and Europe is attributed to mature construction sectors and established regulatory frameworks promoting sustainable building practices. The Asia-Pacific region's rapid growth stems from substantial infrastructure projects and a growing middle class demanding improved living standards.
Perlite Industry Product Developments
Recent product innovations focus on enhancing the performance characteristics of expanded perlite, such as improved thermal insulation, increased fire resistance, and enhanced filtration capabilities. These advancements are driven by the need to meet the evolving demands of various industries, including construction, agriculture, and industrial filtration. The market is witnessing the development of specialized perlite grades tailored for specific applications, improving overall market fit and competitiveness.
Report Scope & Segmentation Analysis
This report segments the perlite market based on product type (expanded perlite, agro-perlite, Vapex, other product types) and application (fillers, fireproofing, insulation, filtration, abrasives, other applications). Each segment's growth projections, market size, and competitive dynamics are analyzed in detail. The expanded perlite segment holds the largest market share, with consistent growth projections driven by its diverse applications. The insulation application segment is projected to maintain its dominance due to its vital role in energy-efficient construction.
Key Drivers of Perlite Industry Growth
Several key factors fuel the growth of the perlite industry:
- Increasing demand for sustainable building materials: Stringent building codes and environmental regulations are pushing the adoption of eco-friendly insulation materials like perlite.
- Growing construction activity: Global infrastructure development and urbanization are major drivers of perlite demand in construction applications.
- Technological advancements: Improvements in perlite production techniques and the development of high-performance grades enhance product quality and expand market potential.
Challenges in the Perlite Industry Sector
The perlite industry faces several challenges:
- Fluctuations in raw material prices: The cost of raw materials significantly impacts perlite production costs and profitability.
- Supply chain disruptions: Global events can disrupt perlite supply chains, impacting production and delivery.
- Competition from substitute materials: Other insulation materials and fillers pose significant competitive pressure. These challenges impact profitability and market share.
Emerging Opportunities in Perlite Industry
Emerging trends and opportunities include:
- Expansion into new markets: Growing demand in developing economies presents significant opportunities for perlite producers.
- Development of new applications: Research and development efforts are exploring new applications for perlite in various industries, such as renewable energy.
- Focus on sustainability: The increasing demand for sustainable products will further enhance the market prospects for perlite.
Leading Players in the Perlite Industry Market
- Amol Minechem Ltd
- Cornerstone Industrial Minerals Corporation USA
- Ausperl Pty Ltd
- Supreme Perlite Company
- Imerys
- Termolita
- Profiltra BV
- Midwest Perlite
- Carolina Perlite Co Inc
- Azer Perlite Corporation
- Blue Pacific Minerals
- Omya AG
- Mianeh Prlite Expanding Co Ltd
- Saudi Perlite Industries
- Bergama Mining Perlite
Key Developments in Perlite Industry Industry
- February 2023: Titan Cement acquired a share in Aegean Perlites, aiming to increase its pozzolan-based products and reduce CO2 emissions. This signals a strategic move towards sustainability in the cement industry and increased demand for pozzolan and perlite resources.
- April 2022: Silica Holdings, Inc. announced price increases for perlite products due to inflationary pressures. This highlights the impact of macroeconomic factors on the perlite market.
Strategic Outlook for Perlite Industry Market
The perlite industry is poised for continued growth, driven by increasing demand for sustainable and high-performance building materials and the exploration of new applications. The focus on sustainability and innovation will shape the future market dynamics, offering opportunities for companies that prioritize eco-friendly production and product development. Expanding into new markets and developing specialized perlite grades tailored for specific applications will further enhance market penetration and profitability.
Perlite Industry Segmentation
-
1. Product Type
- 1.1. Expanded Perlite
- 1.2. Agro-perlite
- 1.3. Vapex
- 1.4. Other Product Types
-
2. Application
- 2.1. Fillers
- 2.2. Fire-proofing
- 2.3. Insulation
- 2.4. Filtration
- 2.5. Abrasives
- 2.6. Other Applications
Perlite Industry Segmentation By Geography
-
1. Asia Pacific
- 1.1. China
- 1.2. India
- 1.3. Japan
- 1.4. South Korea
- 1.5. Rest of Asia Pacific
-
2. North America
- 2.1. United States
- 2.2. Canada
- 2.3. Mexico
- 2.4. Rest of North America
-
3. Europe
- 3.1. Germany
- 3.2. United Kingdom
- 3.3. France
- 3.4. Italy
- 3.5. Russia
- 3.6. Rest of Europe
-
4. South America
- 4.1. Brazil
- 4.2. Argentina
- 4.3. Rest of South America
-
5. Middle East and Africa
- 5.1. Saudi Arabia
- 5.2. South Africa
- 5.3. UAE
- 5.4. Rest of Middle East and Africa
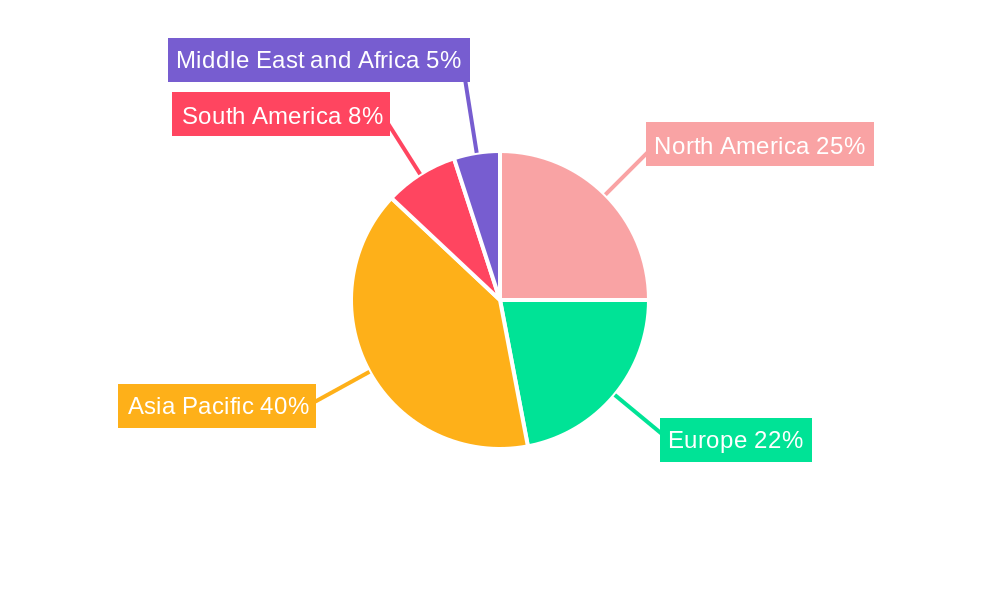
Perlite Industry Regional Market Share
Geographic Coverage of Perlite Industry
Perlite Industry REPORT HIGHLIGHTS
| Aspects | Details |
|---|---|
| Study Period | 2020-2034 |
| Base Year | 2025 |
| Estimated Year | 2026 |
| Forecast Period | 2026-2034 |
| Historical Period | 2020-2025 |
| Growth Rate | CAGR of 5.78% from 2020-2034 |
| Segmentation |
|
Table of Contents
- 1. Introduction
- 1.1. Research Scope
- 1.2. Market Segmentation
- 1.3. Research Objective
- 1.4. Definitions and Assumptions
- 2. Executive Summary
- 2.1. Market Snapshot
- 3. Market Dynamics
- 3.1. Market Drivers
- 3.2. Market Restrains
- 3.3. Market Trends
- 3.4. Market Opportunities
- 4. Market Factor Analysis
- 4.1. Porters Five Forces
- 4.1.1. Bargaining Power of Suppliers
- 4.1.2. Bargaining Power of Buyers
- 4.1.3. Threat of New Entrants
- 4.1.4. Threat of Substitutes
- 4.1.5. Competitive Rivalry
- 4.2. PESTEL analysis
- 4.3. BCG Analysis
- 4.3.1. Stars (High Growth, High Market Share)
- 4.3.2. Cash Cows (Low Growth, High Market Share)
- 4.3.3. Question Mark (High Growth, Low Market Share)
- 4.3.4. Dogs (Low Growth, Low Market Share)
- 4.4. Ansoff Matrix Analysis
- 4.5. Supply Chain Analysis
- 4.6. Regulatory Landscape
- 4.7. Current Market Potential and Opportunity Assessment (TAM–SAM–SOM Framework)
- 4.8. RAX Analyst Note
- 4.1. Porters Five Forces
- 5. Market Analysis, Insights and Forecast 2021-2033
- 5.1. Market Analysis, Insights and Forecast - by Product Type
- 5.1.1. Expanded Perlite
- 5.1.2. Agro-perlite
- 5.1.3. Vapex
- 5.1.4. Other Product Types
- 5.2. Market Analysis, Insights and Forecast - by Application
- 5.2.1. Fillers
- 5.2.2. Fire-proofing
- 5.2.3. Insulation
- 5.2.4. Filtration
- 5.2.5. Abrasives
- 5.2.6. Other Applications
- 5.3. Market Analysis, Insights and Forecast - by Region
- 5.3.1. Asia Pacific
- 5.3.2. North America
- 5.3.3. Europe
- 5.3.4. South America
- 5.3.5. Middle East and Africa
- 5.1. Market Analysis, Insights and Forecast - by Product Type
- 6. Global Perlite Industry Analysis, Insights and Forecast, 2021-2033
- 6.1. Market Analysis, Insights and Forecast - by Product Type
- 6.1.1. Expanded Perlite
- 6.1.2. Agro-perlite
- 6.1.3. Vapex
- 6.1.4. Other Product Types
- 6.2. Market Analysis, Insights and Forecast - by Application
- 6.2.1. Fillers
- 6.2.2. Fire-proofing
- 6.2.3. Insulation
- 6.2.4. Filtration
- 6.2.5. Abrasives
- 6.2.6. Other Applications
- 6.1. Market Analysis, Insights and Forecast - by Product Type
- 7. Asia Pacific Perlite Industry Analysis, Insights and Forecast, 2020-2032
- 7.1. Market Analysis, Insights and Forecast - by Product Type
- 7.1.1. Expanded Perlite
- 7.1.2. Agro-perlite
- 7.1.3. Vapex
- 7.1.4. Other Product Types
- 7.2. Market Analysis, Insights and Forecast - by Application
- 7.2.1. Fillers
- 7.2.2. Fire-proofing
- 7.2.3. Insulation
- 7.2.4. Filtration
- 7.2.5. Abrasives
- 7.2.6. Other Applications
- 7.1. Market Analysis, Insights and Forecast - by Product Type
- 8. North America Perlite Industry Analysis, Insights and Forecast, 2020-2032
- 8.1. Market Analysis, Insights and Forecast - by Product Type
- 8.1.1. Expanded Perlite
- 8.1.2. Agro-perlite
- 8.1.3. Vapex
- 8.1.4. Other Product Types
- 8.2. Market Analysis, Insights and Forecast - by Application
- 8.2.1. Fillers
- 8.2.2. Fire-proofing
- 8.2.3. Insulation
- 8.2.4. Filtration
- 8.2.5. Abrasives
- 8.2.6. Other Applications
- 8.1. Market Analysis, Insights and Forecast - by Product Type
- 9. Europe Perlite Industry Analysis, Insights and Forecast, 2020-2032
- 9.1. Market Analysis, Insights and Forecast - by Product Type
- 9.1.1. Expanded Perlite
- 9.1.2. Agro-perlite
- 9.1.3. Vapex
- 9.1.4. Other Product Types
- 9.2. Market Analysis, Insights and Forecast - by Application
- 9.2.1. Fillers
- 9.2.2. Fire-proofing
- 9.2.3. Insulation
- 9.2.4. Filtration
- 9.2.5. Abrasives
- 9.2.6. Other Applications
- 9.1. Market Analysis, Insights and Forecast - by Product Type
- 10. South America Perlite Industry Analysis, Insights and Forecast, 2020-2032
- 10.1. Market Analysis, Insights and Forecast - by Product Type
- 10.1.1. Expanded Perlite
- 10.1.2. Agro-perlite
- 10.1.3. Vapex
- 10.1.4. Other Product Types
- 10.2. Market Analysis, Insights and Forecast - by Application
- 10.2.1. Fillers
- 10.2.2. Fire-proofing
- 10.2.3. Insulation
- 10.2.4. Filtration
- 10.2.5. Abrasives
- 10.2.6. Other Applications
- 10.1. Market Analysis, Insights and Forecast - by Product Type
- 11. Middle East and Africa Perlite Industry Analysis, Insights and Forecast, 2020-2032
- 11.1. Market Analysis, Insights and Forecast - by Product Type
- 11.1.1. Expanded Perlite
- 11.1.2. Agro-perlite
- 11.1.3. Vapex
- 11.1.4. Other Product Types
- 11.2. Market Analysis, Insights and Forecast - by Application
- 11.2.1. Fillers
- 11.2.2. Fire-proofing
- 11.2.3. Insulation
- 11.2.4. Filtration
- 11.2.5. Abrasives
- 11.2.6. Other Applications
- 11.1. Market Analysis, Insights and Forecast - by Product Type
- 12. Competitive Analysis
- 12.1. Company Profiles
- 12.1.1 Amol Minechem Ltd
- 12.1.1.1. Company Overview
- 12.1.1.2. Products
- 12.1.1.3. Company Financials
- 12.1.1.4. SWOT Analysis
- 12.1.2 Cornerstone Industrial Minerals Corporation USA
- 12.1.2.1. Company Overview
- 12.1.2.2. Products
- 12.1.2.3. Company Financials
- 12.1.2.4. SWOT Analysis
- 12.1.3 Ausperl Pty Ltd
- 12.1.3.1. Company Overview
- 12.1.3.2. Products
- 12.1.3.3. Company Financials
- 12.1.3.4. SWOT Analysis
- 12.1.4 Supreme Perlite Company
- 12.1.4.1. Company Overview
- 12.1.4.2. Products
- 12.1.4.3. Company Financials
- 12.1.4.4. SWOT Analysis
- 12.1.5 Imerys
- 12.1.5.1. Company Overview
- 12.1.5.2. Products
- 12.1.5.3. Company Financials
- 12.1.5.4. SWOT Analysis
- 12.1.6 Termolita
- 12.1.6.1. Company Overview
- 12.1.6.2. Products
- 12.1.6.3. Company Financials
- 12.1.6.4. SWOT Analysis
- 12.1.7 Profiltra BV
- 12.1.7.1. Company Overview
- 12.1.7.2. Products
- 12.1.7.3. Company Financials
- 12.1.7.4. SWOT Analysis
- 12.1.8 Midwest Perlite
- 12.1.8.1. Company Overview
- 12.1.8.2. Products
- 12.1.8.3. Company Financials
- 12.1.8.4. SWOT Analysis
- 12.1.9 Carolina Perlite Co Inc
- 12.1.9.1. Company Overview
- 12.1.9.2. Products
- 12.1.9.3. Company Financials
- 12.1.9.4. SWOT Analysis
- 12.1.10 Azer Perlite Corporation
- 12.1.10.1. Company Overview
- 12.1.10.2. Products
- 12.1.10.3. Company Financials
- 12.1.10.4. SWOT Analysis
- 12.1.11 Blue Pacific Minerals
- 12.1.11.1. Company Overview
- 12.1.11.2. Products
- 12.1.11.3. Company Financials
- 12.1.11.4. SWOT Analysis
- 12.1.12 Omya AG
- 12.1.12.1. Company Overview
- 12.1.12.2. Products
- 12.1.12.3. Company Financials
- 12.1.12.4. SWOT Analysis
- 12.1.13 Mianeh Prlite Expanding Co Ltd
- 12.1.13.1. Company Overview
- 12.1.13.2. Products
- 12.1.13.3. Company Financials
- 12.1.13.4. SWOT Analysis
- 12.1.14 Saudi Perlite Industries
- 12.1.14.1. Company Overview
- 12.1.14.2. Products
- 12.1.14.3. Company Financials
- 12.1.14.4. SWOT Analysis
- 12.1.15 Bergama Mining Perlite
- 12.1.15.1. Company Overview
- 12.1.15.2. Products
- 12.1.15.3. Company Financials
- 12.1.15.4. SWOT Analysis
- 12.1.1 Amol Minechem Ltd
- 12.2. Market Entropy
- 12.2.1 Company's Key Areas Served
- 12.2.2 Recent Developments
- 12.3. Company Market Share Analysis 2025
- 12.3.1 Top 5 Companies Market Share Analysis
- 12.3.2 Top 3 Companies Market Share Analysis
- 12.4. List of Potential Customers
- 13. Research Methodology
List of Figures
- Figure 1: Global Perlite Industry Revenue Breakdown (billion, %) by Region 2025 & 2033
- Figure 2: Global Perlite Industry Volume Breakdown (K Tons, %) by Region 2025 & 2033
- Figure 3: Asia Pacific Perlite Industry Revenue (billion), by Product Type 2025 & 2033
- Figure 4: Asia Pacific Perlite Industry Volume (K Tons), by Product Type 2025 & 2033
- Figure 5: Asia Pacific Perlite Industry Revenue Share (%), by Product Type 2025 & 2033
- Figure 6: Asia Pacific Perlite Industry Volume Share (%), by Product Type 2025 & 2033
- Figure 7: Asia Pacific Perlite Industry Revenue (billion), by Application 2025 & 2033
- Figure 8: Asia Pacific Perlite Industry Volume (K Tons), by Application 2025 & 2033
- Figure 9: Asia Pacific Perlite Industry Revenue Share (%), by Application 2025 & 2033
- Figure 10: Asia Pacific Perlite Industry Volume Share (%), by Application 2025 & 2033
- Figure 11: Asia Pacific Perlite Industry Revenue (billion), by Country 2025 & 2033
- Figure 12: Asia Pacific Perlite Industry Volume (K Tons), by Country 2025 & 2033
- Figure 13: Asia Pacific Perlite Industry Revenue Share (%), by Country 2025 & 2033
- Figure 14: Asia Pacific Perlite Industry Volume Share (%), by Country 2025 & 2033
- Figure 15: North America Perlite Industry Revenue (billion), by Product Type 2025 & 2033
- Figure 16: North America Perlite Industry Volume (K Tons), by Product Type 2025 & 2033
- Figure 17: North America Perlite Industry Revenue Share (%), by Product Type 2025 & 2033
- Figure 18: North America Perlite Industry Volume Share (%), by Product Type 2025 & 2033
- Figure 19: North America Perlite Industry Revenue (billion), by Application 2025 & 2033
- Figure 20: North America Perlite Industry Volume (K Tons), by Application 2025 & 2033
- Figure 21: North America Perlite Industry Revenue Share (%), by Application 2025 & 2033
- Figure 22: North America Perlite Industry Volume Share (%), by Application 2025 & 2033
- Figure 23: North America Perlite Industry Revenue (billion), by Country 2025 & 2033
- Figure 24: North America Perlite Industry Volume (K Tons), by Country 2025 & 2033
- Figure 25: North America Perlite Industry Revenue Share (%), by Country 2025 & 2033
- Figure 26: North America Perlite Industry Volume Share (%), by Country 2025 & 2033
- Figure 27: Europe Perlite Industry Revenue (billion), by Product Type 2025 & 2033
- Figure 28: Europe Perlite Industry Volume (K Tons), by Product Type 2025 & 2033
- Figure 29: Europe Perlite Industry Revenue Share (%), by Product Type 2025 & 2033
- Figure 30: Europe Perlite Industry Volume Share (%), by Product Type 2025 & 2033
- Figure 31: Europe Perlite Industry Revenue (billion), by Application 2025 & 2033
- Figure 32: Europe Perlite Industry Volume (K Tons), by Application 2025 & 2033
- Figure 33: Europe Perlite Industry Revenue Share (%), by Application 2025 & 2033
- Figure 34: Europe Perlite Industry Volume Share (%), by Application 2025 & 2033
- Figure 35: Europe Perlite Industry Revenue (billion), by Country 2025 & 2033
- Figure 36: Europe Perlite Industry Volume (K Tons), by Country 2025 & 2033
- Figure 37: Europe Perlite Industry Revenue Share (%), by Country 2025 & 2033
- Figure 38: Europe Perlite Industry Volume Share (%), by Country 2025 & 2033
- Figure 39: South America Perlite Industry Revenue (billion), by Product Type 2025 & 2033
- Figure 40: South America Perlite Industry Volume (K Tons), by Product Type 2025 & 2033
- Figure 41: South America Perlite Industry Revenue Share (%), by Product Type 2025 & 2033
- Figure 42: South America Perlite Industry Volume Share (%), by Product Type 2025 & 2033
- Figure 43: South America Perlite Industry Revenue (billion), by Application 2025 & 2033
- Figure 44: South America Perlite Industry Volume (K Tons), by Application 2025 & 2033
- Figure 45: South America Perlite Industry Revenue Share (%), by Application 2025 & 2033
- Figure 46: South America Perlite Industry Volume Share (%), by Application 2025 & 2033
- Figure 47: South America Perlite Industry Revenue (billion), by Country 2025 & 2033
- Figure 48: South America Perlite Industry Volume (K Tons), by Country 2025 & 2033
- Figure 49: South America Perlite Industry Revenue Share (%), by Country 2025 & 2033
- Figure 50: South America Perlite Industry Volume Share (%), by Country 2025 & 2033
- Figure 51: Middle East and Africa Perlite Industry Revenue (billion), by Product Type 2025 & 2033
- Figure 52: Middle East and Africa Perlite Industry Volume (K Tons), by Product Type 2025 & 2033
- Figure 53: Middle East and Africa Perlite Industry Revenue Share (%), by Product Type 2025 & 2033
- Figure 54: Middle East and Africa Perlite Industry Volume Share (%), by Product Type 2025 & 2033
- Figure 55: Middle East and Africa Perlite Industry Revenue (billion), by Application 2025 & 2033
- Figure 56: Middle East and Africa Perlite Industry Volume (K Tons), by Application 2025 & 2033
- Figure 57: Middle East and Africa Perlite Industry Revenue Share (%), by Application 2025 & 2033
- Figure 58: Middle East and Africa Perlite Industry Volume Share (%), by Application 2025 & 2033
- Figure 59: Middle East and Africa Perlite Industry Revenue (billion), by Country 2025 & 2033
- Figure 60: Middle East and Africa Perlite Industry Volume (K Tons), by Country 2025 & 2033
- Figure 61: Middle East and Africa Perlite Industry Revenue Share (%), by Country 2025 & 2033
- Figure 62: Middle East and Africa Perlite Industry Volume Share (%), by Country 2025 & 2033
List of Tables
- Table 1: Global Perlite Industry Revenue billion Forecast, by Product Type 2020 & 2033
- Table 2: Global Perlite Industry Volume K Tons Forecast, by Product Type 2020 & 2033
- Table 3: Global Perlite Industry Revenue billion Forecast, by Application 2020 & 2033
- Table 4: Global Perlite Industry Volume K Tons Forecast, by Application 2020 & 2033
- Table 5: Global Perlite Industry Revenue billion Forecast, by Region 2020 & 2033
- Table 6: Global Perlite Industry Volume K Tons Forecast, by Region 2020 & 2033
- Table 7: Global Perlite Industry Revenue billion Forecast, by Product Type 2020 & 2033
- Table 8: Global Perlite Industry Volume K Tons Forecast, by Product Type 2020 & 2033
- Table 9: Global Perlite Industry Revenue billion Forecast, by Application 2020 & 2033
- Table 10: Global Perlite Industry Volume K Tons Forecast, by Application 2020 & 2033
- Table 11: Global Perlite Industry Revenue billion Forecast, by Country 2020 & 2033
- Table 12: Global Perlite Industry Volume K Tons Forecast, by Country 2020 & 2033
- Table 13: China Perlite Industry Revenue (billion) Forecast, by Application 2020 & 2033
- Table 14: China Perlite Industry Volume (K Tons) Forecast, by Application 2020 & 2033
- Table 15: India Perlite Industry Revenue (billion) Forecast, by Application 2020 & 2033
- Table 16: India Perlite Industry Volume (K Tons) Forecast, by Application 2020 & 2033
- Table 17: Japan Perlite Industry Revenue (billion) Forecast, by Application 2020 & 2033
- Table 18: Japan Perlite Industry Volume (K Tons) Forecast, by Application 2020 & 2033
- Table 19: South Korea Perlite Industry Revenue (billion) Forecast, by Application 2020 & 2033
- Table 20: South Korea Perlite Industry Volume (K Tons) Forecast, by Application 2020 & 2033
- Table 21: Rest of Asia Pacific Perlite Industry Revenue (billion) Forecast, by Application 2020 & 2033
- Table 22: Rest of Asia Pacific Perlite Industry Volume (K Tons) Forecast, by Application 2020 & 2033
- Table 23: Global Perlite Industry Revenue billion Forecast, by Product Type 2020 & 2033
- Table 24: Global Perlite Industry Volume K Tons Forecast, by Product Type 2020 & 2033
- Table 25: Global Perlite Industry Revenue billion Forecast, by Application 2020 & 2033
- Table 26: Global Perlite Industry Volume K Tons Forecast, by Application 2020 & 2033
- Table 27: Global Perlite Industry Revenue billion Forecast, by Country 2020 & 2033
- Table 28: Global Perlite Industry Volume K Tons Forecast, by Country 2020 & 2033
- Table 29: United States Perlite Industry Revenue (billion) Forecast, by Application 2020 & 2033
- Table 30: United States Perlite Industry Volume (K Tons) Forecast, by Application 2020 & 2033
- Table 31: Canada Perlite Industry Revenue (billion) Forecast, by Application 2020 & 2033
- Table 32: Canada Perlite Industry Volume (K Tons) Forecast, by Application 2020 & 2033
- Table 33: Mexico Perlite Industry Revenue (billion) Forecast, by Application 2020 & 2033
- Table 34: Mexico Perlite Industry Volume (K Tons) Forecast, by Application 2020 & 2033
- Table 35: Rest of North America Perlite Industry Revenue (billion) Forecast, by Application 2020 & 2033
- Table 36: Rest of North America Perlite Industry Volume (K Tons) Forecast, by Application 2020 & 2033
- Table 37: Global Perlite Industry Revenue billion Forecast, by Product Type 2020 & 2033
- Table 38: Global Perlite Industry Volume K Tons Forecast, by Product Type 2020 & 2033
- Table 39: Global Perlite Industry Revenue billion Forecast, by Application 2020 & 2033
- Table 40: Global Perlite Industry Volume K Tons Forecast, by Application 2020 & 2033
- Table 41: Global Perlite Industry Revenue billion Forecast, by Country 2020 & 2033
- Table 42: Global Perlite Industry Volume K Tons Forecast, by Country 2020 & 2033
- Table 43: Germany Perlite Industry Revenue (billion) Forecast, by Application 2020 & 2033
- Table 44: Germany Perlite Industry Volume (K Tons) Forecast, by Application 2020 & 2033
- Table 45: United Kingdom Perlite Industry Revenue (billion) Forecast, by Application 2020 & 2033
- Table 46: United Kingdom Perlite Industry Volume (K Tons) Forecast, by Application 2020 & 2033
- Table 47: France Perlite Industry Revenue (billion) Forecast, by Application 2020 & 2033
- Table 48: France Perlite Industry Volume (K Tons) Forecast, by Application 2020 & 2033
- Table 49: Italy Perlite Industry Revenue (billion) Forecast, by Application 2020 & 2033
- Table 50: Italy Perlite Industry Volume (K Tons) Forecast, by Application 2020 & 2033
- Table 51: Russia Perlite Industry Revenue (billion) Forecast, by Application 2020 & 2033
- Table 52: Russia Perlite Industry Volume (K Tons) Forecast, by Application 2020 & 2033
- Table 53: Rest of Europe Perlite Industry Revenue (billion) Forecast, by Application 2020 & 2033
- Table 54: Rest of Europe Perlite Industry Volume (K Tons) Forecast, by Application 2020 & 2033
- Table 55: Global Perlite Industry Revenue billion Forecast, by Product Type 2020 & 2033
- Table 56: Global Perlite Industry Volume K Tons Forecast, by Product Type 2020 & 2033
- Table 57: Global Perlite Industry Revenue billion Forecast, by Application 2020 & 2033
- Table 58: Global Perlite Industry Volume K Tons Forecast, by Application 2020 & 2033
- Table 59: Global Perlite Industry Revenue billion Forecast, by Country 2020 & 2033
- Table 60: Global Perlite Industry Volume K Tons Forecast, by Country 2020 & 2033
- Table 61: Brazil Perlite Industry Revenue (billion) Forecast, by Application 2020 & 2033
- Table 62: Brazil Perlite Industry Volume (K Tons) Forecast, by Application 2020 & 2033
- Table 63: Argentina Perlite Industry Revenue (billion) Forecast, by Application 2020 & 2033
- Table 64: Argentina Perlite Industry Volume (K Tons) Forecast, by Application 2020 & 2033
- Table 65: Rest of South America Perlite Industry Revenue (billion) Forecast, by Application 2020 & 2033
- Table 66: Rest of South America Perlite Industry Volume (K Tons) Forecast, by Application 2020 & 2033
- Table 67: Global Perlite Industry Revenue billion Forecast, by Product Type 2020 & 2033
- Table 68: Global Perlite Industry Volume K Tons Forecast, by Product Type 2020 & 2033
- Table 69: Global Perlite Industry Revenue billion Forecast, by Application 2020 & 2033
- Table 70: Global Perlite Industry Volume K Tons Forecast, by Application 2020 & 2033
- Table 71: Global Perlite Industry Revenue billion Forecast, by Country 2020 & 2033
- Table 72: Global Perlite Industry Volume K Tons Forecast, by Country 2020 & 2033
- Table 73: Saudi Arabia Perlite Industry Revenue (billion) Forecast, by Application 2020 & 2033
- Table 74: Saudi Arabia Perlite Industry Volume (K Tons) Forecast, by Application 2020 & 2033
- Table 75: South Africa Perlite Industry Revenue (billion) Forecast, by Application 2020 & 2033
- Table 76: South Africa Perlite Industry Volume (K Tons) Forecast, by Application 2020 & 2033
- Table 77: UAE Perlite Industry Revenue (billion) Forecast, by Application 2020 & 2033
- Table 78: UAE Perlite Industry Volume (K Tons) Forecast, by Application 2020 & 2033
- Table 79: Rest of Middle East and Africa Perlite Industry Revenue (billion) Forecast, by Application 2020 & 2033
- Table 80: Rest of Middle East and Africa Perlite Industry Volume (K Tons) Forecast, by Application 2020 & 2033
Frequently Asked Questions
1. What is the projected Compound Annual Growth Rate (CAGR) of the Perlite Industry?
The projected CAGR is approximately 5.78%.
2. Which companies are prominent players in the Perlite Industry?
Key companies in the market include Amol Minechem Ltd, Cornerstone Industrial Minerals Corporation USA, Ausperl Pty Ltd, Supreme Perlite Company, Imerys, Termolita, Profiltra BV, Midwest Perlite, Carolina Perlite Co Inc, Azer Perlite Corporation, Blue Pacific Minerals, Omya AG, Mianeh Prlite Expanding Co Ltd, Saudi Perlite Industries, Bergama Mining Perlite.
3. What are the main segments of the Perlite Industry?
The market segments include Product Type, Application.
4. Can you provide details about the market size?
The market size is estimated to be USD 2.45 billion as of 2022.
5. What are some drivers contributing to market growth?
Surge in Demand in the Agricultural and Construction Industries; Increasing Usage in the Metallurgical Industry; Other Drivers.
6. What are the notable trends driving market growth?
Increasing Demand from Construction Sector.
7. Are there any restraints impacting market growth?
Availability of Substitutes; Health Problems Due to Prolonged Exposure; Other Restraints.
8. Can you provide examples of recent developments in the market?
February 2023: Titan Cement acquired a share in Aegean Perlites. The company operates perlite and pozzolan quarries on the island of Yali. It also has access to port facilities. Titan Group says it is investing in direct access to pozzolan reserves to increase its volume of pozzolan-based cementitious products with a lower clinker factor. The deal is connected to Titan's target to reduce its CO2 emissions by 35% by 2030, compared to 1990 levels, and increase the share of green products in its portfolio to over 50%.
9. What pricing options are available for accessing the report?
Pricing options include single-user, multi-user, and enterprise licenses priced at USD 4750, USD 5250, and USD 8750 respectively.
10. Is the market size provided in terms of value or volume?
The market size is provided in terms of value, measured in billion and volume, measured in K Tons.
11. Are there any specific market keywords associated with the report?
Yes, the market keyword associated with the report is "Perlite Industry," which aids in identifying and referencing the specific market segment covered.
12. How do I determine which pricing option suits my needs best?
The pricing options vary based on user requirements and access needs. Individual users may opt for single-user licenses, while businesses requiring broader access may choose multi-user or enterprise licenses for cost-effective access to the report.
13. Are there any additional resources or data provided in the Perlite Industry report?
While the report offers comprehensive insights, it's advisable to review the specific contents or supplementary materials provided to ascertain if additional resources or data are available.
14. How can I stay updated on further developments or reports in the Perlite Industry?
To stay informed about further developments, trends, and reports in the Perlite Industry, consider subscribing to industry newsletters, following relevant companies and organizations, or regularly checking reputable industry news sources and publications.
Methodology
Step 1 - Identification of Relevant Samples Size from Population Database


Step 2 - Approaches for Defining Global Market Size (Value, Volume* & Price*)

Note*: In applicable scenarios
Step 3 - Data Sources
Primary Research
- Web Analytics
- Survey Reports
- Research Institute
- Latest Research Reports
- Opinion Leaders
Secondary Research
- Annual Reports
- White Paper
- Latest Press Release
- Industry Association
- Paid Database
- Investor Presentations

Step 4 - Data Triangulation
Involves using different sources of information in order to increase the validity of a study
These sources are likely to be stakeholders in a program - participants, other researchers, program staff, other community members, and so on.
Then we put all data in single framework & apply various statistical tools to find out the dynamic on the market.
During the analysis stage, feedback from the stakeholder groups would be compared to determine areas of agreement as well as areas of divergence