Key Insights
The global personal dosimetry market is projected for significant expansion, anticipating a market size of $3.28 billion by 2025, growing at a Compound Annual Growth Rate (CAGR) of 4.5% through 2033. This growth is propelled by heightened awareness of radiation risks across various industries and stringent regulatory requirements for radiation monitoring. The Medical sector remains the primary driver, owing to the extensive use of diagnostic imaging (X-rays, CT scans) and radiotherapy, necessitating precise dosimetry for personnel and patients. The Scientific Research segment, including nuclear, particle physics, and environmental studies, also shows robust demand for accurate dose assessment for safety and compliance. The Industrial and Nuclear Plant segment, vital for nuclear power generation, industrial radiography, and high-radiation environments, continues to be a key contributor.
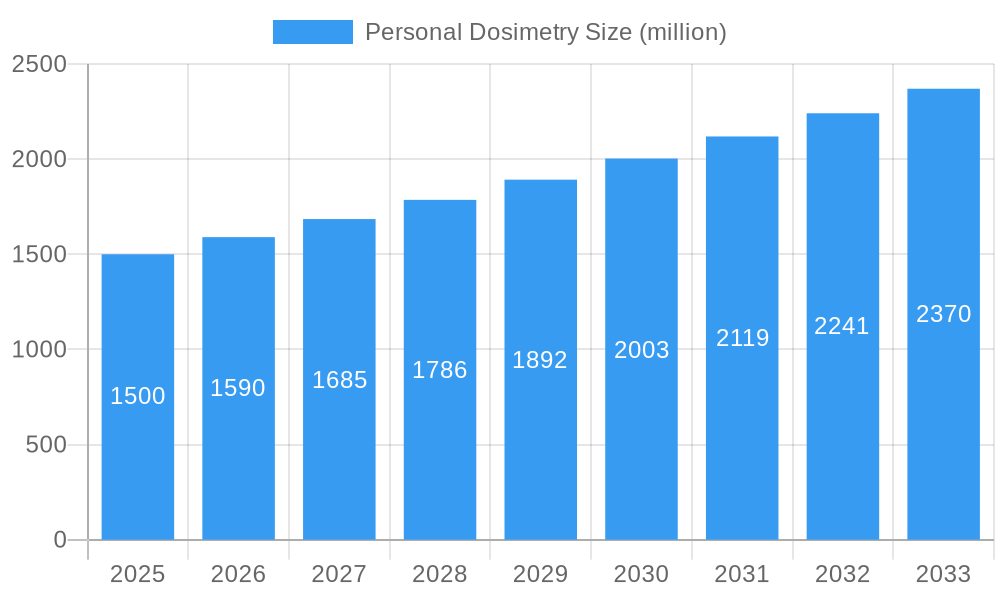
Personal Dosimetry Market Size (In Billion)
Technological advancements are further stimulating market growth. The adoption of Electronic Personal Dosimeters (EPDs) and advanced Thermoluminescent Dosimeters (TLDs) provides real-time monitoring, enhanced accuracy, and user-friendliness. Emerging trends include IoT integration for remote data access, facilitating proactive radiation safety management. However, initial investment costs for advanced equipment and the necessity for specialized training may present adoption challenges, particularly in developing economies. North America and Europe currently dominate, supported by developed healthcare systems, strong regulations, and substantial safety investments. The Asia Pacific region is forecast to exhibit the most rapid growth, driven by industrialization, increasing healthcare spending, and a rising emphasis on nuclear safety and research in key markets.
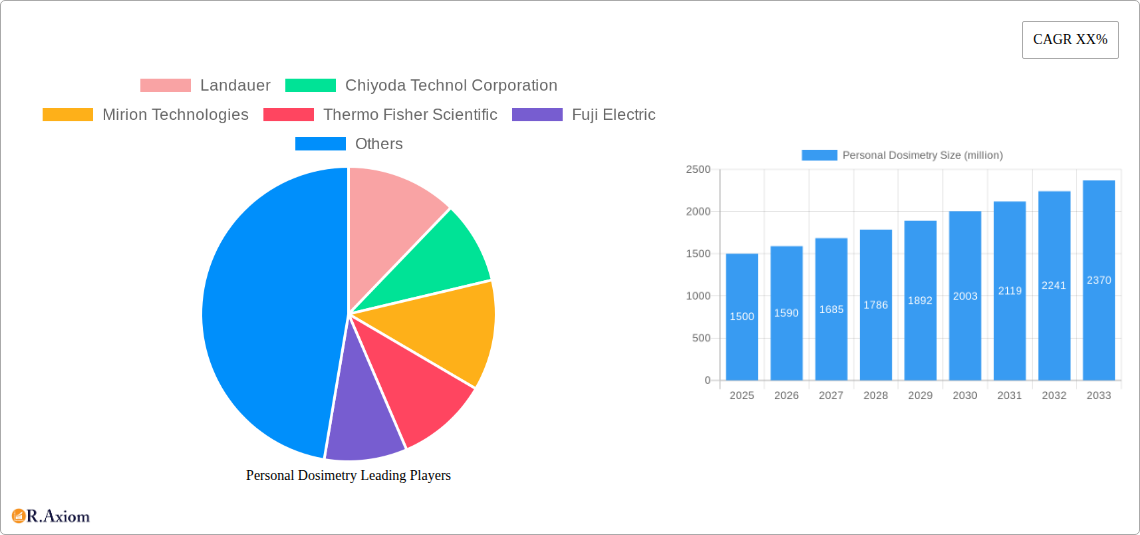
Personal Dosimetry Company Market Share
Personal Dosimetry Market: Comprehensive Analysis and Future Outlook (2019-2033)
This in-depth report provides a meticulous analysis of the global Personal Dosimetry market, forecasting its trajectory from 2019 to 2033. Covering historical trends, current market dynamics, and future projections, this research is an indispensable resource for industry stakeholders seeking to understand market concentration, innovation drivers, dominant segments, and key growth catalysts. With a base year of 2025 and a forecast period of 2025–2033, this report offers actionable insights into market penetration, technological disruptions, and competitive landscapes, empowering informed strategic decision-making.
Personal Dosimetry Market Concentration & Innovation
The personal dosimetry market exhibits a moderate to high concentration, with key players like Landauer, Mirion Technologies, and Thermo Fisher Scientific holding significant market share, estimated to be over 500 million USD collectively. Innovation in this sector is primarily driven by advancements in detector technologies, miniaturization, and the integration of real-time monitoring capabilities. Regulatory frameworks, such as those set by the International Atomic Energy Agency (IAEA) and national radiation protection authorities, play a crucial role in shaping product development and market access. Product substitutes, while present in some niche applications, are generally less effective than specialized dosimetry solutions. End-user trends indicate a growing demand for more sophisticated and user-friendly devices, particularly in healthcare and industrial sectors. Mergers and acquisitions (M&A) activities are observed, with recent deals valued in the range of 100 million USD to 300 million USD, aimed at consolidating market presence and acquiring technological expertise.
- Market Share Snapshot: Leading companies collectively hold over 500 million USD in market share.
- Innovation Drivers: Real-time monitoring, miniaturization, advanced detector materials.
- Regulatory Impact: IAEA and national bodies significantly influence product standards.
- M&A Activity: Deals ranging from 100 million USD to 300 million USD are common.
Personal Dosimetry Industry Trends & Insights
The global personal dosimetry market is projected to witness robust growth, driven by increasing awareness of radiation hazards across various industries and a heightened focus on occupational safety. The market is expected to expand at a Compound Annual Growth Rate (CAGR) of approximately 7.5% over the forecast period, reaching an estimated market value exceeding 2,500 million USD by 2033. Technological advancements are at the forefront of this growth, with a significant shift towards digital and active dosimeters offering real-time data acquisition and immediate feedback, moving away from traditional passive methods. This technological disruption is leading to improved accuracy, enhanced data management, and more efficient radiation monitoring protocols. Consumer preferences are evolving, with a demand for lighter, more compact, and user-friendly devices that can seamlessly integrate into existing workflows. Furthermore, the increasing adoption of sophisticated radiation detection technologies in emerging economies, coupled with stricter regulatory compliances globally, are significant market penetration boosters. Competitive dynamics are characterized by intense innovation, strategic partnerships, and a focus on specialized applications. The market penetration for advanced personal dosimetry solutions is expected to rise significantly, particularly in the medical and industrial sectors, reaching over 60% by the end of the forecast period.
Dominant Markets & Segments in Personal Dosimetry
The Industrial and Nuclear Plant application segment is anticipated to dominate the personal dosimetry market throughout the forecast period, accounting for an estimated 40% of the total market revenue, projected to exceed 1,000 million USD by 2033. This dominance is fueled by stringent safety regulations in nuclear power generation, widespread use of radioactive materials in industrial radiography, and the increasing demand for precise radiation exposure monitoring in manufacturing and research facilities dealing with ionizing radiation. Economic policies promoting industrial growth and nuclear energy expansion in developing nations further bolster this segment. Infrastructure development in emerging economies also plays a vital role.
- Key Drivers for Industrial and Nuclear Plant Dominance:
- Strict occupational safety regulations in nuclear power and industrial settings.
- Growth in industrial radiography and non-destructive testing applications.
- Increased investment in nuclear energy infrastructure globally.
- Demand for accurate and reliable real-time radiation monitoring.
The Medical application segment represents another significant and rapidly growing area, expected to capture approximately 35% of the market share, projected to reach over 875 million USD by 2033. This growth is driven by the increasing use of radiation therapy, diagnostic imaging procedures (such as CT scans and PET scans), and the expanding field of nuclear medicine. Healthcare providers are prioritizing patient and healthcare professional safety, necessitating advanced personal dosimetry solutions to monitor cumulative radiation doses. The proliferation of advanced medical technologies and the growing incidence of radiation-related medical treatments are key contributors.
- Key Drivers for Medical Segment Growth:
- Rising number of diagnostic imaging and radiation therapy procedures.
- Emphasis on patient and healthcare professional radiation safety protocols.
- Development and adoption of new nuclear medicine applications.
- Technological advancements in imaging modalities requiring precise dosimetry.
Among the types of personal dosimeters, Thermoluminescent Dosimeters (TLD) are expected to maintain a significant market share due to their established reliability and cost-effectiveness in certain applications, particularly in historical data collection and less dynamic monitoring scenarios, estimated to hold around 25% of the market value. However, Optical Stimulated Luminescence (OSL) dosimeters are rapidly gaining traction, projected to account for approximately 40% of the market by 2033, due to their reusability, higher sensitivity, and faster readout times, making them ideal for routine occupational monitoring. Active Type dosimeters, offering real-time data and advanced features, are expected to witness the highest growth rate, capturing an estimated 20% of the market, driven by demand for immediate feedback and enhanced safety management. Radiophotoluminescent (RPL) dosimeters will likely hold a smaller but stable share, around 15%, valued for their specific applications and long-term stability.
- Dominance by Type - Key Insights:
- OSL: Leading growth due to reusability and efficiency.
- Active Type: Highest growth potential driven by real-time monitoring.
- TLD: Continued relevance for cost-effective and historical monitoring.
- RPL: Niche applications ensuring stable market presence.
Personal Dosimetry Product Developments
Recent product developments in personal dosimetry are characterized by a strong emphasis on enhanced accuracy, real-time monitoring capabilities, and user-friendliness. Companies are investing in integrating advanced detector materials for greater sensitivity and broader energy response. The miniaturization of active dosimeters allows for greater wearability and seamless integration into personal protective equipment. Furthermore, the development of cloud-based data management platforms facilitates efficient tracking, reporting, and analysis of radiation exposure data, providing crucial insights for safety protocols. These innovations offer competitive advantages by meeting the evolving needs for comprehensive radiation safety management across diverse applications.
Report Scope & Segmentation Analysis
This report meticulously segments the personal dosimetry market across key Application and Type categories.
Application Segments: The market is analyzed based on its application in Medical (including radiotherapy, diagnostic imaging), Scientific Research (laboratories, academic institutions), Industrial and Nuclear Plant (power generation, manufacturing, radiography), and Others (security, emergency response). Each segment's projected growth, market size, and competitive dynamics are detailed.
Type Segments: The analysis further categorizes the market by the type of dosimetry technology employed, including Thermoluminescent Dosimeters (TLD), Optical Stimulated Luminescence (OSL), Radiophotoluminescent (RPL), and Active Type dosimeters. Growth projections and market share for each type are provided, with a focus on technological advancements and adoption trends.
Key Drivers of Personal Dosimetry Growth
Several key drivers are propelling the growth of the personal dosimetry market. Technologically, the increasing sophistication of semiconductor detectors and the development of novel phosphors are enhancing the sensitivity and accuracy of dosimeters. Economically, rising global healthcare expenditures, coupled with a growing emphasis on nuclear energy as a carbon-neutral power source, are creating substantial demand. Regulatory drivers, such as the enforcement of stricter occupational radiation exposure limits by national and international bodies, compel industries to adopt advanced personal dosimetry solutions. The expanding applications in industrial radiography and non-destructive testing further contribute to market expansion.
Challenges in the Personal Dosimetry Sector
The personal dosimetry sector faces several challenges that could impede its growth. Regulatory hurdles, including the complex approval processes for new technologies and variations in standards across different regions, can slow down market entry. Supply chain issues, particularly concerning the availability of critical raw materials and components for advanced detectors, can lead to production delays and increased costs. Intense competitive pressures, with a large number of established and emerging players, often result in price erosion. Furthermore, the initial capital investment required for advanced dosimetry systems and infrastructure can be a barrier for smaller organizations.
Emerging Opportunities in Personal Dosimetry
Emerging opportunities in the personal dosimetry market are abundant and diverse. The growing adoption of wearable technology presents a significant opportunity for the development of highly integrated and discreet personal dosimeters. The expansion of the medical sector, particularly in emerging economies, and the increasing utilization of diagnostic imaging and radiotherapy create a sustained demand. Furthermore, the development of AI-powered analytics platforms for personal dosimetry data offers opportunities for predictive safety measures and optimized radiation management. The increasing focus on cybersecurity for radiation monitoring data also presents an avenue for innovation and market differentiation.
Leading Players in the Personal Dosimetry Market
- Landauer
- Chiyoda Technol Corporation
- Mirion Technologies
- Thermo Fisher Scientific
- Fuji Electric
- Hitachi Aloka
- Bertin Instruments
- Tracerco
- ATOMTEX
- Ludlum Measurements
- XZ LAB
- Arrow-Tech
- Renri
- RadPro International GmbH
- Dosimetrics
Key Developments in Personal Dosimetry Industry
- 2023 November: Launch of new generation OSL dosimeters with enhanced sensitivity and wider energy range.
- 2023 September: Mirion Technologies acquires a leading active dosimetry solutions provider to expand its real-time monitoring portfolio.
- 2023 July: Thermo Fisher Scientific introduces a cloud-based platform for integrated radiation dose management.
- 2023 March: Fuji Electric develops compact, wireless active dosimeters for improved worker safety in industrial environments.
- 2022 December: IAEA revises guidelines for occupational radiation protection, emphasizing real-time monitoring and advanced dosimetry.
- 2022 October: Landauer announces strategic partnership with a leading AI firm to enhance data analytics for radiation exposure.
- 2022 April: Bertin Instruments launches a new suite of personal electronic dosimeters with integrated GPS and alarm functions.
- 2021 November: Expansion of OSL technology adoption in medical imaging facilities to reduce long-term costs.
- 2021 July: Tracerco develops specialized dosimetry solutions for the offshore oil and gas industry.
- 2021 February: ATOMTEX introduces advanced personal alarm dosimeters for emergency response personnel.
Strategic Outlook for Personal Dosimetry Market
The strategic outlook for the personal dosimetry market remains exceptionally strong, driven by an unyielding commitment to occupational safety, advancements in radiation detection technology, and expanding applications across critical sectors. The forecast period is poised for sustained growth, with a particular emphasis on smart, connected, and real-time dosimetry solutions. Companies that invest in R&D for next-generation detectors, integrate data analytics for proactive safety management, and adapt to evolving regulatory landscapes will be best positioned for success. The increasing demand for personalized radiation monitoring and the growing awareness of the importance of accurate dose assessment will continue to fuel market expansion, making it a highly attractive sector for strategic investment and innovation.
Personal Dosimetry Segmentation
-
1. Application
- 1.1. Medical
- 1.2. Scientific Research
- 1.3. Industrial and Nuclear Plant
- 1.4. Others
-
2. Types
- 2.1. TLD
- 2.2. OSL
- 2.3. RPL
- 2.4. Active Type
Personal Dosimetry Segmentation By Geography
-
1. North America
- 1.1. United States
- 1.2. Canada
- 1.3. Mexico
-
2. South America
- 2.1. Brazil
- 2.2. Argentina
- 2.3. Rest of South America
-
3. Europe
- 3.1. United Kingdom
- 3.2. Germany
- 3.3. France
- 3.4. Italy
- 3.5. Spain
- 3.6. Russia
- 3.7. Benelux
- 3.8. Nordics
- 3.9. Rest of Europe
-
4. Middle East & Africa
- 4.1. Turkey
- 4.2. Israel
- 4.3. GCC
- 4.4. North Africa
- 4.5. South Africa
- 4.6. Rest of Middle East & Africa
-
5. Asia Pacific
- 5.1. China
- 5.2. India
- 5.3. Japan
- 5.4. South Korea
- 5.5. ASEAN
- 5.6. Oceania
- 5.7. Rest of Asia Pacific
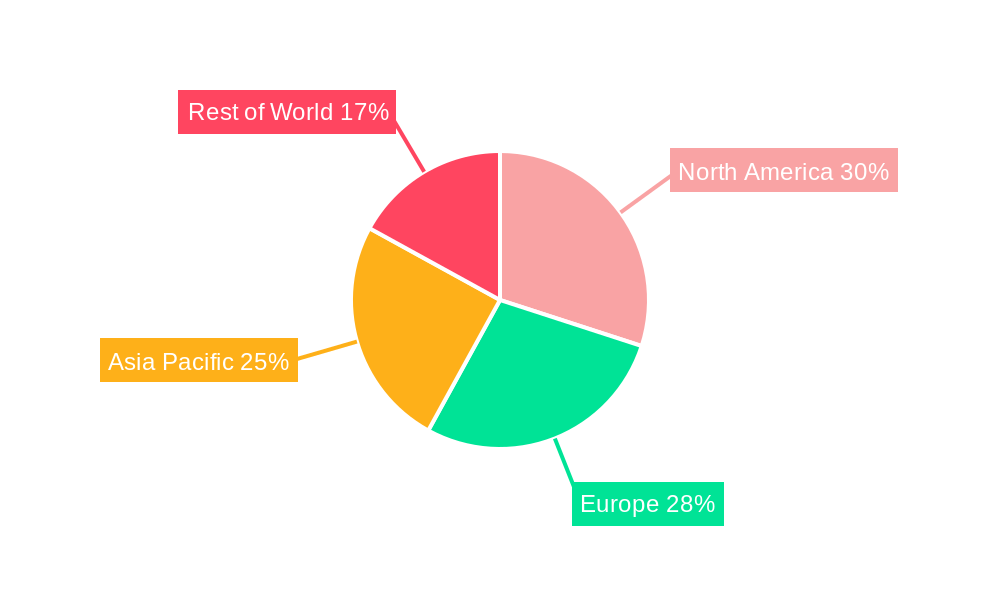
Personal Dosimetry Regional Market Share
Geographic Coverage of Personal Dosimetry
Personal Dosimetry REPORT HIGHLIGHTS
| Aspects | Details |
|---|---|
| Study Period | 2020-2034 |
| Base Year | 2025 |
| Estimated Year | 2026 |
| Forecast Period | 2026-2034 |
| Historical Period | 2020-2025 |
| Growth Rate | CAGR of 4.5% from 2020-2034 |
| Segmentation |
|
Table of Contents
- 1. Introduction
- 1.1. Research Scope
- 1.2. Market Segmentation
- 1.3. Research Methodology
- 1.4. Definitions and Assumptions
- 2. Executive Summary
- 2.1. Introduction
- 3. Market Dynamics
- 3.1. Introduction
- 3.2. Market Drivers
- 3.3. Market Restrains
- 3.4. Market Trends
- 4. Market Factor Analysis
- 4.1. Porters Five Forces
- 4.2. Supply/Value Chain
- 4.3. PESTEL analysis
- 4.4. Market Entropy
- 4.5. Patent/Trademark Analysis
- 5. Global Personal Dosimetry Analysis, Insights and Forecast, 2020-2032
- 5.1. Market Analysis, Insights and Forecast - by Application
- 5.1.1. Medical
- 5.1.2. Scientific Research
- 5.1.3. Industrial and Nuclear Plant
- 5.1.4. Others
- 5.2. Market Analysis, Insights and Forecast - by Types
- 5.2.1. TLD
- 5.2.2. OSL
- 5.2.3. RPL
- 5.2.4. Active Type
- 5.3. Market Analysis, Insights and Forecast - by Region
- 5.3.1. North America
- 5.3.2. South America
- 5.3.3. Europe
- 5.3.4. Middle East & Africa
- 5.3.5. Asia Pacific
- 5.1. Market Analysis, Insights and Forecast - by Application
- 6. North America Personal Dosimetry Analysis, Insights and Forecast, 2020-2032
- 6.1. Market Analysis, Insights and Forecast - by Application
- 6.1.1. Medical
- 6.1.2. Scientific Research
- 6.1.3. Industrial and Nuclear Plant
- 6.1.4. Others
- 6.2. Market Analysis, Insights and Forecast - by Types
- 6.2.1. TLD
- 6.2.2. OSL
- 6.2.3. RPL
- 6.2.4. Active Type
- 6.1. Market Analysis, Insights and Forecast - by Application
- 7. South America Personal Dosimetry Analysis, Insights and Forecast, 2020-2032
- 7.1. Market Analysis, Insights and Forecast - by Application
- 7.1.1. Medical
- 7.1.2. Scientific Research
- 7.1.3. Industrial and Nuclear Plant
- 7.1.4. Others
- 7.2. Market Analysis, Insights and Forecast - by Types
- 7.2.1. TLD
- 7.2.2. OSL
- 7.2.3. RPL
- 7.2.4. Active Type
- 7.1. Market Analysis, Insights and Forecast - by Application
- 8. Europe Personal Dosimetry Analysis, Insights and Forecast, 2020-2032
- 8.1. Market Analysis, Insights and Forecast - by Application
- 8.1.1. Medical
- 8.1.2. Scientific Research
- 8.1.3. Industrial and Nuclear Plant
- 8.1.4. Others
- 8.2. Market Analysis, Insights and Forecast - by Types
- 8.2.1. TLD
- 8.2.2. OSL
- 8.2.3. RPL
- 8.2.4. Active Type
- 8.1. Market Analysis, Insights and Forecast - by Application
- 9. Middle East & Africa Personal Dosimetry Analysis, Insights and Forecast, 2020-2032
- 9.1. Market Analysis, Insights and Forecast - by Application
- 9.1.1. Medical
- 9.1.2. Scientific Research
- 9.1.3. Industrial and Nuclear Plant
- 9.1.4. Others
- 9.2. Market Analysis, Insights and Forecast - by Types
- 9.2.1. TLD
- 9.2.2. OSL
- 9.2.3. RPL
- 9.2.4. Active Type
- 9.1. Market Analysis, Insights and Forecast - by Application
- 10. Asia Pacific Personal Dosimetry Analysis, Insights and Forecast, 2020-2032
- 10.1. Market Analysis, Insights and Forecast - by Application
- 10.1.1. Medical
- 10.1.2. Scientific Research
- 10.1.3. Industrial and Nuclear Plant
- 10.1.4. Others
- 10.2. Market Analysis, Insights and Forecast - by Types
- 10.2.1. TLD
- 10.2.2. OSL
- 10.2.3. RPL
- 10.2.4. Active Type
- 10.1. Market Analysis, Insights and Forecast - by Application
- 11. Competitive Analysis
- 11.1. Global Market Share Analysis 2025
- 11.2. Company Profiles
- 11.2.1 Landauer
- 11.2.1.1. Overview
- 11.2.1.2. Products
- 11.2.1.3. SWOT Analysis
- 11.2.1.4. Recent Developments
- 11.2.1.5. Financials (Based on Availability)
- 11.2.2 Chiyoda Technol Corporation
- 11.2.2.1. Overview
- 11.2.2.2. Products
- 11.2.2.3. SWOT Analysis
- 11.2.2.4. Recent Developments
- 11.2.2.5. Financials (Based on Availability)
- 11.2.3 Mirion Technologies
- 11.2.3.1. Overview
- 11.2.3.2. Products
- 11.2.3.3. SWOT Analysis
- 11.2.3.4. Recent Developments
- 11.2.3.5. Financials (Based on Availability)
- 11.2.4 Thermo Fisher Scientific
- 11.2.4.1. Overview
- 11.2.4.2. Products
- 11.2.4.3. SWOT Analysis
- 11.2.4.4. Recent Developments
- 11.2.4.5. Financials (Based on Availability)
- 11.2.5 Fuji Electric
- 11.2.5.1. Overview
- 11.2.5.2. Products
- 11.2.5.3. SWOT Analysis
- 11.2.5.4. Recent Developments
- 11.2.5.5. Financials (Based on Availability)
- 11.2.6 Hitachi Aloka
- 11.2.6.1. Overview
- 11.2.6.2. Products
- 11.2.6.3. SWOT Analysis
- 11.2.6.4. Recent Developments
- 11.2.6.5. Financials (Based on Availability)
- 11.2.7 Bertin Instruments
- 11.2.7.1. Overview
- 11.2.7.2. Products
- 11.2.7.3. SWOT Analysis
- 11.2.7.4. Recent Developments
- 11.2.7.5. Financials (Based on Availability)
- 11.2.8 Tracerco
- 11.2.8.1. Overview
- 11.2.8.2. Products
- 11.2.8.3. SWOT Analysis
- 11.2.8.4. Recent Developments
- 11.2.8.5. Financials (Based on Availability)
- 11.2.9 ATOMTEX
- 11.2.9.1. Overview
- 11.2.9.2. Products
- 11.2.9.3. SWOT Analysis
- 11.2.9.4. Recent Developments
- 11.2.9.5. Financials (Based on Availability)
- 11.2.10 Ludlum Measurements
- 11.2.10.1. Overview
- 11.2.10.2. Products
- 11.2.10.3. SWOT Analysis
- 11.2.10.4. Recent Developments
- 11.2.10.5. Financials (Based on Availability)
- 11.2.11 XZ LAB
- 11.2.11.1. Overview
- 11.2.11.2. Products
- 11.2.11.3. SWOT Analysis
- 11.2.11.4. Recent Developments
- 11.2.11.5. Financials (Based on Availability)
- 11.2.12 Arrow-Tech
- 11.2.12.1. Overview
- 11.2.12.2. Products
- 11.2.12.3. SWOT Analysis
- 11.2.12.4. Recent Developments
- 11.2.12.5. Financials (Based on Availability)
- 11.2.13 Renri
- 11.2.13.1. Overview
- 11.2.13.2. Products
- 11.2.13.3. SWOT Analysis
- 11.2.13.4. Recent Developments
- 11.2.13.5. Financials (Based on Availability)
- 11.2.14 RadPro International GmbH
- 11.2.14.1. Overview
- 11.2.14.2. Products
- 11.2.14.3. SWOT Analysis
- 11.2.14.4. Recent Developments
- 11.2.14.5. Financials (Based on Availability)
- 11.2.15 Dosimetrics
- 11.2.15.1. Overview
- 11.2.15.2. Products
- 11.2.15.3. SWOT Analysis
- 11.2.15.4. Recent Developments
- 11.2.15.5. Financials (Based on Availability)
- 11.2.1 Landauer
List of Figures
- Figure 1: Global Personal Dosimetry Revenue Breakdown (billion, %) by Region 2025 & 2033
- Figure 2: Global Personal Dosimetry Volume Breakdown (K, %) by Region 2025 & 2033
- Figure 3: North America Personal Dosimetry Revenue (billion), by Application 2025 & 2033
- Figure 4: North America Personal Dosimetry Volume (K), by Application 2025 & 2033
- Figure 5: North America Personal Dosimetry Revenue Share (%), by Application 2025 & 2033
- Figure 6: North America Personal Dosimetry Volume Share (%), by Application 2025 & 2033
- Figure 7: North America Personal Dosimetry Revenue (billion), by Types 2025 & 2033
- Figure 8: North America Personal Dosimetry Volume (K), by Types 2025 & 2033
- Figure 9: North America Personal Dosimetry Revenue Share (%), by Types 2025 & 2033
- Figure 10: North America Personal Dosimetry Volume Share (%), by Types 2025 & 2033
- Figure 11: North America Personal Dosimetry Revenue (billion), by Country 2025 & 2033
- Figure 12: North America Personal Dosimetry Volume (K), by Country 2025 & 2033
- Figure 13: North America Personal Dosimetry Revenue Share (%), by Country 2025 & 2033
- Figure 14: North America Personal Dosimetry Volume Share (%), by Country 2025 & 2033
- Figure 15: South America Personal Dosimetry Revenue (billion), by Application 2025 & 2033
- Figure 16: South America Personal Dosimetry Volume (K), by Application 2025 & 2033
- Figure 17: South America Personal Dosimetry Revenue Share (%), by Application 2025 & 2033
- Figure 18: South America Personal Dosimetry Volume Share (%), by Application 2025 & 2033
- Figure 19: South America Personal Dosimetry Revenue (billion), by Types 2025 & 2033
- Figure 20: South America Personal Dosimetry Volume (K), by Types 2025 & 2033
- Figure 21: South America Personal Dosimetry Revenue Share (%), by Types 2025 & 2033
- Figure 22: South America Personal Dosimetry Volume Share (%), by Types 2025 & 2033
- Figure 23: South America Personal Dosimetry Revenue (billion), by Country 2025 & 2033
- Figure 24: South America Personal Dosimetry Volume (K), by Country 2025 & 2033
- Figure 25: South America Personal Dosimetry Revenue Share (%), by Country 2025 & 2033
- Figure 26: South America Personal Dosimetry Volume Share (%), by Country 2025 & 2033
- Figure 27: Europe Personal Dosimetry Revenue (billion), by Application 2025 & 2033
- Figure 28: Europe Personal Dosimetry Volume (K), by Application 2025 & 2033
- Figure 29: Europe Personal Dosimetry Revenue Share (%), by Application 2025 & 2033
- Figure 30: Europe Personal Dosimetry Volume Share (%), by Application 2025 & 2033
- Figure 31: Europe Personal Dosimetry Revenue (billion), by Types 2025 & 2033
- Figure 32: Europe Personal Dosimetry Volume (K), by Types 2025 & 2033
- Figure 33: Europe Personal Dosimetry Revenue Share (%), by Types 2025 & 2033
- Figure 34: Europe Personal Dosimetry Volume Share (%), by Types 2025 & 2033
- Figure 35: Europe Personal Dosimetry Revenue (billion), by Country 2025 & 2033
- Figure 36: Europe Personal Dosimetry Volume (K), by Country 2025 & 2033
- Figure 37: Europe Personal Dosimetry Revenue Share (%), by Country 2025 & 2033
- Figure 38: Europe Personal Dosimetry Volume Share (%), by Country 2025 & 2033
- Figure 39: Middle East & Africa Personal Dosimetry Revenue (billion), by Application 2025 & 2033
- Figure 40: Middle East & Africa Personal Dosimetry Volume (K), by Application 2025 & 2033
- Figure 41: Middle East & Africa Personal Dosimetry Revenue Share (%), by Application 2025 & 2033
- Figure 42: Middle East & Africa Personal Dosimetry Volume Share (%), by Application 2025 & 2033
- Figure 43: Middle East & Africa Personal Dosimetry Revenue (billion), by Types 2025 & 2033
- Figure 44: Middle East & Africa Personal Dosimetry Volume (K), by Types 2025 & 2033
- Figure 45: Middle East & Africa Personal Dosimetry Revenue Share (%), by Types 2025 & 2033
- Figure 46: Middle East & Africa Personal Dosimetry Volume Share (%), by Types 2025 & 2033
- Figure 47: Middle East & Africa Personal Dosimetry Revenue (billion), by Country 2025 & 2033
- Figure 48: Middle East & Africa Personal Dosimetry Volume (K), by Country 2025 & 2033
- Figure 49: Middle East & Africa Personal Dosimetry Revenue Share (%), by Country 2025 & 2033
- Figure 50: Middle East & Africa Personal Dosimetry Volume Share (%), by Country 2025 & 2033
- Figure 51: Asia Pacific Personal Dosimetry Revenue (billion), by Application 2025 & 2033
- Figure 52: Asia Pacific Personal Dosimetry Volume (K), by Application 2025 & 2033
- Figure 53: Asia Pacific Personal Dosimetry Revenue Share (%), by Application 2025 & 2033
- Figure 54: Asia Pacific Personal Dosimetry Volume Share (%), by Application 2025 & 2033
- Figure 55: Asia Pacific Personal Dosimetry Revenue (billion), by Types 2025 & 2033
- Figure 56: Asia Pacific Personal Dosimetry Volume (K), by Types 2025 & 2033
- Figure 57: Asia Pacific Personal Dosimetry Revenue Share (%), by Types 2025 & 2033
- Figure 58: Asia Pacific Personal Dosimetry Volume Share (%), by Types 2025 & 2033
- Figure 59: Asia Pacific Personal Dosimetry Revenue (billion), by Country 2025 & 2033
- Figure 60: Asia Pacific Personal Dosimetry Volume (K), by Country 2025 & 2033
- Figure 61: Asia Pacific Personal Dosimetry Revenue Share (%), by Country 2025 & 2033
- Figure 62: Asia Pacific Personal Dosimetry Volume Share (%), by Country 2025 & 2033
List of Tables
- Table 1: Global Personal Dosimetry Revenue billion Forecast, by Application 2020 & 2033
- Table 2: Global Personal Dosimetry Volume K Forecast, by Application 2020 & 2033
- Table 3: Global Personal Dosimetry Revenue billion Forecast, by Types 2020 & 2033
- Table 4: Global Personal Dosimetry Volume K Forecast, by Types 2020 & 2033
- Table 5: Global Personal Dosimetry Revenue billion Forecast, by Region 2020 & 2033
- Table 6: Global Personal Dosimetry Volume K Forecast, by Region 2020 & 2033
- Table 7: Global Personal Dosimetry Revenue billion Forecast, by Application 2020 & 2033
- Table 8: Global Personal Dosimetry Volume K Forecast, by Application 2020 & 2033
- Table 9: Global Personal Dosimetry Revenue billion Forecast, by Types 2020 & 2033
- Table 10: Global Personal Dosimetry Volume K Forecast, by Types 2020 & 2033
- Table 11: Global Personal Dosimetry Revenue billion Forecast, by Country 2020 & 2033
- Table 12: Global Personal Dosimetry Volume K Forecast, by Country 2020 & 2033
- Table 13: United States Personal Dosimetry Revenue (billion) Forecast, by Application 2020 & 2033
- Table 14: United States Personal Dosimetry Volume (K) Forecast, by Application 2020 & 2033
- Table 15: Canada Personal Dosimetry Revenue (billion) Forecast, by Application 2020 & 2033
- Table 16: Canada Personal Dosimetry Volume (K) Forecast, by Application 2020 & 2033
- Table 17: Mexico Personal Dosimetry Revenue (billion) Forecast, by Application 2020 & 2033
- Table 18: Mexico Personal Dosimetry Volume (K) Forecast, by Application 2020 & 2033
- Table 19: Global Personal Dosimetry Revenue billion Forecast, by Application 2020 & 2033
- Table 20: Global Personal Dosimetry Volume K Forecast, by Application 2020 & 2033
- Table 21: Global Personal Dosimetry Revenue billion Forecast, by Types 2020 & 2033
- Table 22: Global Personal Dosimetry Volume K Forecast, by Types 2020 & 2033
- Table 23: Global Personal Dosimetry Revenue billion Forecast, by Country 2020 & 2033
- Table 24: Global Personal Dosimetry Volume K Forecast, by Country 2020 & 2033
- Table 25: Brazil Personal Dosimetry Revenue (billion) Forecast, by Application 2020 & 2033
- Table 26: Brazil Personal Dosimetry Volume (K) Forecast, by Application 2020 & 2033
- Table 27: Argentina Personal Dosimetry Revenue (billion) Forecast, by Application 2020 & 2033
- Table 28: Argentina Personal Dosimetry Volume (K) Forecast, by Application 2020 & 2033
- Table 29: Rest of South America Personal Dosimetry Revenue (billion) Forecast, by Application 2020 & 2033
- Table 30: Rest of South America Personal Dosimetry Volume (K) Forecast, by Application 2020 & 2033
- Table 31: Global Personal Dosimetry Revenue billion Forecast, by Application 2020 & 2033
- Table 32: Global Personal Dosimetry Volume K Forecast, by Application 2020 & 2033
- Table 33: Global Personal Dosimetry Revenue billion Forecast, by Types 2020 & 2033
- Table 34: Global Personal Dosimetry Volume K Forecast, by Types 2020 & 2033
- Table 35: Global Personal Dosimetry Revenue billion Forecast, by Country 2020 & 2033
- Table 36: Global Personal Dosimetry Volume K Forecast, by Country 2020 & 2033
- Table 37: United Kingdom Personal Dosimetry Revenue (billion) Forecast, by Application 2020 & 2033
- Table 38: United Kingdom Personal Dosimetry Volume (K) Forecast, by Application 2020 & 2033
- Table 39: Germany Personal Dosimetry Revenue (billion) Forecast, by Application 2020 & 2033
- Table 40: Germany Personal Dosimetry Volume (K) Forecast, by Application 2020 & 2033
- Table 41: France Personal Dosimetry Revenue (billion) Forecast, by Application 2020 & 2033
- Table 42: France Personal Dosimetry Volume (K) Forecast, by Application 2020 & 2033
- Table 43: Italy Personal Dosimetry Revenue (billion) Forecast, by Application 2020 & 2033
- Table 44: Italy Personal Dosimetry Volume (K) Forecast, by Application 2020 & 2033
- Table 45: Spain Personal Dosimetry Revenue (billion) Forecast, by Application 2020 & 2033
- Table 46: Spain Personal Dosimetry Volume (K) Forecast, by Application 2020 & 2033
- Table 47: Russia Personal Dosimetry Revenue (billion) Forecast, by Application 2020 & 2033
- Table 48: Russia Personal Dosimetry Volume (K) Forecast, by Application 2020 & 2033
- Table 49: Benelux Personal Dosimetry Revenue (billion) Forecast, by Application 2020 & 2033
- Table 50: Benelux Personal Dosimetry Volume (K) Forecast, by Application 2020 & 2033
- Table 51: Nordics Personal Dosimetry Revenue (billion) Forecast, by Application 2020 & 2033
- Table 52: Nordics Personal Dosimetry Volume (K) Forecast, by Application 2020 & 2033
- Table 53: Rest of Europe Personal Dosimetry Revenue (billion) Forecast, by Application 2020 & 2033
- Table 54: Rest of Europe Personal Dosimetry Volume (K) Forecast, by Application 2020 & 2033
- Table 55: Global Personal Dosimetry Revenue billion Forecast, by Application 2020 & 2033
- Table 56: Global Personal Dosimetry Volume K Forecast, by Application 2020 & 2033
- Table 57: Global Personal Dosimetry Revenue billion Forecast, by Types 2020 & 2033
- Table 58: Global Personal Dosimetry Volume K Forecast, by Types 2020 & 2033
- Table 59: Global Personal Dosimetry Revenue billion Forecast, by Country 2020 & 2033
- Table 60: Global Personal Dosimetry Volume K Forecast, by Country 2020 & 2033
- Table 61: Turkey Personal Dosimetry Revenue (billion) Forecast, by Application 2020 & 2033
- Table 62: Turkey Personal Dosimetry Volume (K) Forecast, by Application 2020 & 2033
- Table 63: Israel Personal Dosimetry Revenue (billion) Forecast, by Application 2020 & 2033
- Table 64: Israel Personal Dosimetry Volume (K) Forecast, by Application 2020 & 2033
- Table 65: GCC Personal Dosimetry Revenue (billion) Forecast, by Application 2020 & 2033
- Table 66: GCC Personal Dosimetry Volume (K) Forecast, by Application 2020 & 2033
- Table 67: North Africa Personal Dosimetry Revenue (billion) Forecast, by Application 2020 & 2033
- Table 68: North Africa Personal Dosimetry Volume (K) Forecast, by Application 2020 & 2033
- Table 69: South Africa Personal Dosimetry Revenue (billion) Forecast, by Application 2020 & 2033
- Table 70: South Africa Personal Dosimetry Volume (K) Forecast, by Application 2020 & 2033
- Table 71: Rest of Middle East & Africa Personal Dosimetry Revenue (billion) Forecast, by Application 2020 & 2033
- Table 72: Rest of Middle East & Africa Personal Dosimetry Volume (K) Forecast, by Application 2020 & 2033
- Table 73: Global Personal Dosimetry Revenue billion Forecast, by Application 2020 & 2033
- Table 74: Global Personal Dosimetry Volume K Forecast, by Application 2020 & 2033
- Table 75: Global Personal Dosimetry Revenue billion Forecast, by Types 2020 & 2033
- Table 76: Global Personal Dosimetry Volume K Forecast, by Types 2020 & 2033
- Table 77: Global Personal Dosimetry Revenue billion Forecast, by Country 2020 & 2033
- Table 78: Global Personal Dosimetry Volume K Forecast, by Country 2020 & 2033
- Table 79: China Personal Dosimetry Revenue (billion) Forecast, by Application 2020 & 2033
- Table 80: China Personal Dosimetry Volume (K) Forecast, by Application 2020 & 2033
- Table 81: India Personal Dosimetry Revenue (billion) Forecast, by Application 2020 & 2033
- Table 82: India Personal Dosimetry Volume (K) Forecast, by Application 2020 & 2033
- Table 83: Japan Personal Dosimetry Revenue (billion) Forecast, by Application 2020 & 2033
- Table 84: Japan Personal Dosimetry Volume (K) Forecast, by Application 2020 & 2033
- Table 85: South Korea Personal Dosimetry Revenue (billion) Forecast, by Application 2020 & 2033
- Table 86: South Korea Personal Dosimetry Volume (K) Forecast, by Application 2020 & 2033
- Table 87: ASEAN Personal Dosimetry Revenue (billion) Forecast, by Application 2020 & 2033
- Table 88: ASEAN Personal Dosimetry Volume (K) Forecast, by Application 2020 & 2033
- Table 89: Oceania Personal Dosimetry Revenue (billion) Forecast, by Application 2020 & 2033
- Table 90: Oceania Personal Dosimetry Volume (K) Forecast, by Application 2020 & 2033
- Table 91: Rest of Asia Pacific Personal Dosimetry Revenue (billion) Forecast, by Application 2020 & 2033
- Table 92: Rest of Asia Pacific Personal Dosimetry Volume (K) Forecast, by Application 2020 & 2033
Frequently Asked Questions
1. What is the projected Compound Annual Growth Rate (CAGR) of the Personal Dosimetry?
The projected CAGR is approximately 4.5%.
2. Which companies are prominent players in the Personal Dosimetry?
Key companies in the market include Landauer, Chiyoda Technol Corporation, Mirion Technologies, Thermo Fisher Scientific, Fuji Electric, Hitachi Aloka, Bertin Instruments, Tracerco, ATOMTEX, Ludlum Measurements, XZ LAB, Arrow-Tech, Renri, RadPro International GmbH, Dosimetrics.
3. What are the main segments of the Personal Dosimetry?
The market segments include Application, Types.
4. Can you provide details about the market size?
The market size is estimated to be USD 3.28 billion as of 2022.
5. What are some drivers contributing to market growth?
N/A
6. What are the notable trends driving market growth?
N/A
7. Are there any restraints impacting market growth?
N/A
8. Can you provide examples of recent developments in the market?
N/A
9. What pricing options are available for accessing the report?
Pricing options include single-user, multi-user, and enterprise licenses priced at USD 3350.00, USD 5025.00, and USD 6700.00 respectively.
10. Is the market size provided in terms of value or volume?
The market size is provided in terms of value, measured in billion and volume, measured in K.
11. Are there any specific market keywords associated with the report?
Yes, the market keyword associated with the report is "Personal Dosimetry," which aids in identifying and referencing the specific market segment covered.
12. How do I determine which pricing option suits my needs best?
The pricing options vary based on user requirements and access needs. Individual users may opt for single-user licenses, while businesses requiring broader access may choose multi-user or enterprise licenses for cost-effective access to the report.
13. Are there any additional resources or data provided in the Personal Dosimetry report?
While the report offers comprehensive insights, it's advisable to review the specific contents or supplementary materials provided to ascertain if additional resources or data are available.
14. How can I stay updated on further developments or reports in the Personal Dosimetry?
To stay informed about further developments, trends, and reports in the Personal Dosimetry, consider subscribing to industry newsletters, following relevant companies and organizations, or regularly checking reputable industry news sources and publications.
Methodology
Step 1 - Identification of Relevant Samples Size from Population Database


Step 2 - Approaches for Defining Global Market Size (Value, Volume* & Price*)

Note*: In applicable scenarios
Step 3 - Data Sources
Primary Research
- Web Analytics
- Survey Reports
- Research Institute
- Latest Research Reports
- Opinion Leaders
Secondary Research
- Annual Reports
- White Paper
- Latest Press Release
- Industry Association
- Paid Database
- Investor Presentations

Step 4 - Data Triangulation
Involves using different sources of information in order to increase the validity of a study
These sources are likely to be stakeholders in a program - participants, other researchers, program staff, other community members, and so on.
Then we put all data in single framework & apply various statistical tools to find out the dynamic on the market.
During the analysis stage, feedback from the stakeholder groups would be compared to determine areas of agreement as well as areas of divergence

