

Key Insights
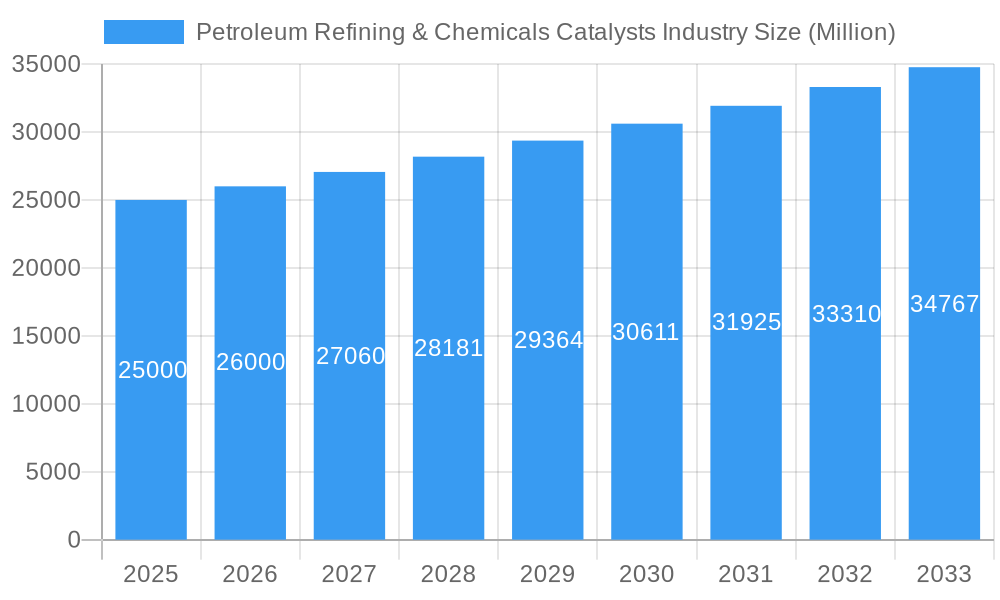
The global Petroleum Refining & Chemicals Catalysts market is projected for substantial growth, driven by increasing demand for refined petroleum products and the expanding petrochemical industry. The market size is estimated at $10096.57 million in 2025, with a projected Compound Annual Growth Rate (CAGR) of 4.3% from 2025 to 2033. Key growth drivers include rising global energy consumption, necessitating advanced catalysts for enhanced refining efficiency, and the burgeoning demand for petrochemicals like plastics and fertilizers, spurring investment in new catalyst-dependent synthesis processes. Technological innovations in catalyst selectivity and durability, particularly the adoption of zeolites and metal-organic frameworks, further propel market expansion. The Asia-Pacific region, led by China and India, is anticipated to lead market dominance due to rapid industrialization. Challenges include stringent environmental regulations and volatile crude oil prices. The competitive landscape features both multinational corporations and specialized manufacturers, fostering innovation and price competition.
Petroleum Refining & Chemicals Catalysts Industry Market Size (In Billion)
Market segmentation highlights significant opportunities across diverse applications. Petroleum refining catalysts remain a core segment due to continued reliance on fossil fuels, though sustainable energy trends may influence long-term growth. The chemical synthesis segment shows robust expansion, fueled by escalating demand for chemicals and polymers. Catalyst materials are varied, including metals, organometallic catalysts, and molecular sieves. Geographically, North America and Europe exhibit steady growth, while the Asia-Pacific region is poised for the fastest expansion, presenting substantial investment opportunities in emerging markets and technological advancements. Understanding these market dynamics is crucial for stakeholders navigating this evolving industry.
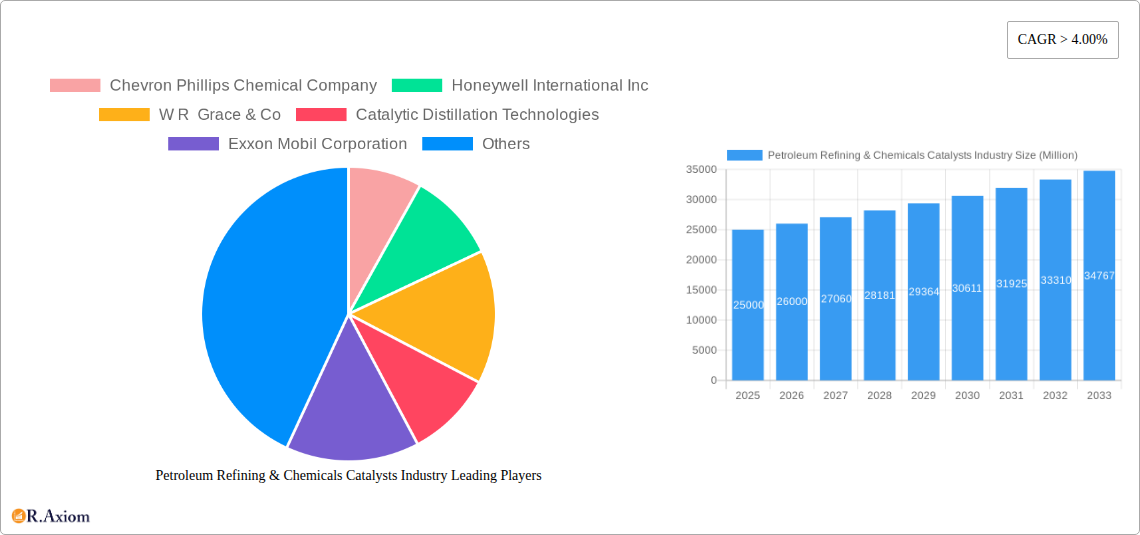
Petroleum Refining & Chemicals Catalysts Industry Company Market Share
Petroleum Refining & Chemicals Catalysts Industry: A Comprehensive Market Report (2019-2033)
This detailed report provides a comprehensive analysis of the Petroleum Refining & Chemicals Catalysts industry, covering market size, growth projections, key players, and emerging trends from 2019 to 2033. The study period encompasses historical data (2019-2024), a base year (2025), and a forecast period (2025-2033). The report is crucial for industry stakeholders, investors, and strategic decision-makers seeking actionable insights into this dynamic market.
Petroleum Refining & Chemicals Catalysts Industry Market Concentration & Innovation
The Petroleum Refining & Chemicals Catalysts market exhibits a moderately concentrated structure, with a handful of multinational corporations holding significant market share. In 2025, the top five players—ExxonMobil Corporation, BASF SE, Honeywell International Inc, Johnson Matthey Inc, and Chevron Phillips Chemical Company—are estimated to collectively control approximately xx% of the global market. This concentration is driven by substantial R&D investments, economies of scale, and established distribution networks. However, the market also accommodates several smaller, specialized players focusing on niche applications or innovative catalyst technologies.
Innovation within the industry is fueled by the constant need to improve catalyst efficiency, selectivity, and longevity. Stringent environmental regulations regarding emissions and waste management are further driving innovation toward cleaner and more sustainable catalyst technologies. The increasing demand for high-quality fuels and chemicals, coupled with growing concerns about climate change, necessitates continuous advancements in catalyst design and manufacturing processes.
Mergers and acquisitions (M&A) activity has been relatively moderate in recent years, with deal values averaging approximately $xx Million annually during the historical period. These activities primarily focus on expanding product portfolios, acquiring specialized technologies, and gaining access to new markets. Examples include (but are not limited to) the acquisition of [insert specific example of M&A, if available, otherwise remove this sentence].
Petroleum Refining & Chemicals Catalysts Industry Industry Trends & Insights
The global Petroleum Refining & Chemicals Catalysts market is experiencing robust growth, driven by several key factors. The expanding petrochemical industry, particularly in emerging economies, is a significant driver. Furthermore, advancements in refining processes, such as fluid catalytic cracking (FCC) and hydrocracking, are increasing demand for high-performance catalysts. The global market is expected to register a Compound Annual Growth Rate (CAGR) of xx% during the forecast period (2025-2033), reaching an estimated value of $xx Million by 2033. This growth is further supported by increasing investments in research and development, leading to the development of novel catalyst materials with enhanced efficiency and selectivity. Market penetration of advanced catalysts, such as zeolites and metal-organic frameworks (MOFs), is gradually increasing, though traditional catalysts still dominate the market. Competitive dynamics are characterized by both intense rivalry among established players and the emergence of new entrants with innovative technologies. Consumer preferences are shifting towards environmentally friendly and cost-effective catalysts, which are further shaping the market landscape.
Dominant Markets & Segments in Petroleum Refining & Chemicals Catalysts Industry
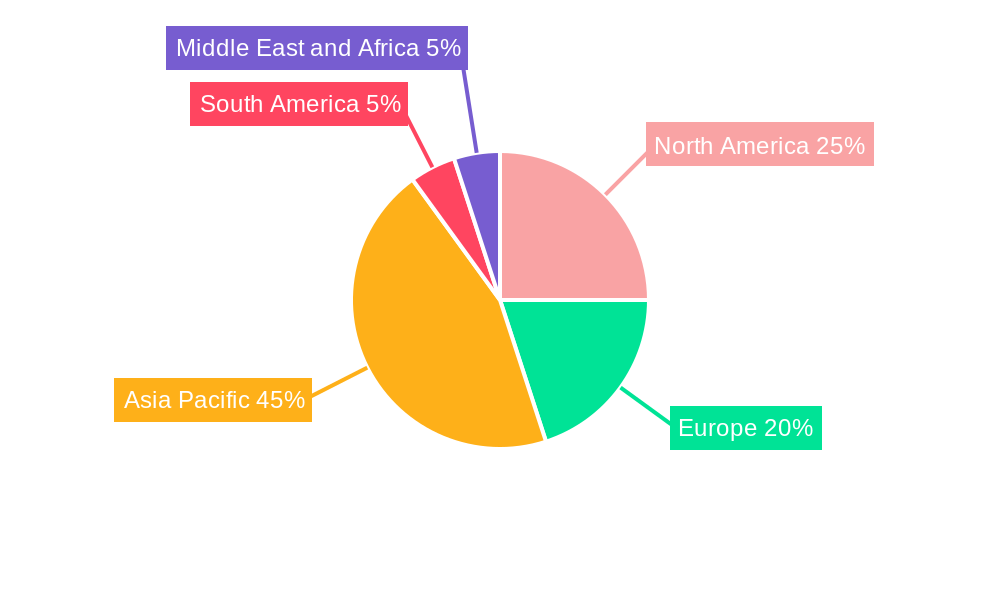
Dominant Regions/Countries: The Asia-Pacific region is projected to maintain its position as the dominant market for petroleum refining & chemicals catalysts throughout the forecast period. This dominance is primarily driven by the region's robust economic growth, expanding petrochemical industry, and increasing energy demand. Countries like China and India are key contributors to this regional growth.
- Key Drivers in Asia-Pacific:
- Rapid industrialization and urbanization
- Significant investments in refining capacity expansion
- Growing demand for transportation fuels and petrochemicals
- Supportive government policies and initiatives
Dominant Segments:
- Application: Petroleum refining remains the largest application segment, accounting for approximately xx% of the total market value in 2025. This is due to the widespread use of catalysts in various refining processes.
- Material: Metals and organometallic catalysts hold the largest market share within the material segment. Their high activity and selectivity make them indispensable in many refining and chemical synthesis processes.
- Other Chemical Compounds: This segment is experiencing significant growth due to the development and adoption of novel catalyst materials.
Petroleum Refining & Chemicals Catalysts Industry Product Developments
Recent product innovations focus on enhancing catalyst performance, lifespan, and sustainability. This includes the development of more active and selective catalysts, improved catalyst formulations for specific applications, and the incorporation of environmentally benign materials. Several companies are exploring the use of nanotechnology to create catalysts with enhanced surface area and improved activity. These advancements are driving improved efficiency in refining and chemical synthesis processes, leading to reduced costs and minimized environmental impact. The market is also seeing an increase in the demand for tailored catalysts designed for specific applications, offering competitive advantages to manufacturers.
Report Scope & Segmentation Analysis
This report provides a detailed segmentation analysis across various parameters:
Application: Petroleum Refining, Isomerization, Synthesis Gas Processes, Polymerization. Each application segment shows distinct growth trajectories and competitive landscapes, reflecting varying technological advancements and market needs. The petroleum refining segment is projected to maintain its dominance.
Material: Metals and Organometallic Catalysts, Metallic Compounds (e.g., Aluminosilicates), Molecular Sieves, Other Chemical Compounds (e.g., Other Materials). This segmentation highlights the diverse range of materials used in catalyst manufacturing and their respective market shares. Metals and organometallic catalysts are expected to remain the dominant segment, given their wide application.
Key Drivers of Petroleum Refining & Chemicals Catalysts Industry Growth
The growth of the petroleum refining & chemicals catalysts industry is driven by several key factors: the expansion of the global petrochemical industry, increasing demand for high-quality fuels and chemicals, stricter environmental regulations promoting cleaner technologies, and ongoing advancements in catalyst design and manufacturing processes. Technological improvements, such as the development of more efficient and selective catalysts, also contribute to market expansion. Government incentives and support for renewable energy sources, while seemingly contradictory, indirectly impact demand by increasing the need for efficient refining processes to generate feedstocks for biofuels and other applications.
Challenges in the Petroleum Refining & Chemicals Catalysts Industry Sector
The industry faces several challenges. Fluctuations in raw material prices and supply chain disruptions can significantly impact production costs and profitability. Stringent environmental regulations pose both challenges and opportunities, requiring the development of more sustainable and environmentally friendly catalysts. Furthermore, intense competition among established players and the emergence of new technologies are increasing pressure on profit margins. Finally, the cyclical nature of the energy industry contributes to demand variability, influencing market stability.
Emerging Opportunities in Petroleum Refining & Chemicals Catalysts Industry
Emerging opportunities lie in the development of more sustainable and environmentally friendly catalysts. This includes the use of renewable feedstocks, the design of catalysts with reduced environmental impact, and the development of efficient catalyst recycling and recovery processes. Furthermore, advancements in nanotechnology and materials science offer significant potential for creating novel catalyst materials with enhanced performance. Expanding into emerging markets and developing specialized catalysts for niche applications also present attractive growth avenues.
Leading Players in the Petroleum Refining & Chemicals Catalysts Industry Market
- Chevron Phillips Chemical Company
- Honeywell International Inc
- W R Grace & Co
- Catalytic Distillation Technologies
- Exxon Mobil Corporation
- INEOS Technologies
- Johnson Matthey Inc
- Evonik Industries AG
- Wako Chemicals USA Inc
- KBR Inc
- BASF SE
- Eka Chemicals AB
- Zeochem LLC
- Zeolyst International
- Chicago Bridge & Iron Company
- Dow
- Bayer Technology Services
- Nova Chemicals Corp
- Clariant International Ltd
- Eastman Chemical Co
Key Developments in Petroleum Refining & Chemicals Catalysts Industry Industry
- 2022 Q4: BASF SE announced the launch of a new generation of hydrocracking catalysts, enhancing efficiency and reducing emissions.
- 2023 Q1: ExxonMobil Corporation invested $xx Million in expanding its catalyst production facility in [Location].
- 2023 Q3: A joint venture between Honeywell International Inc and [Partner Company] was established to develop innovative catalysts for sustainable fuel production. (Note: Replace bracketed information with actual data if available)
Strategic Outlook for Petroleum Refining & Chemicals Catalysts Industry Market
The future of the petroleum refining & chemicals catalysts market appears promising, driven by continued growth in the petrochemical industry, increasing demand for higher-quality fuels and chemicals, and the ongoing development of more efficient and sustainable catalyst technologies. The industry's commitment to R&D, coupled with evolving consumer preferences and environmental regulations, will shape the market landscape. Opportunities exist in the development of specialized catalysts for emerging applications and the utilization of advanced materials to enhance catalyst performance and lifespan. The market is poised for steady growth, albeit with some cyclical variations influenced by global economic conditions and energy market dynamics.
Petroleum Refining & Chemicals Catalysts Industry Segmentation
-
1. Material
-
1.1. Metals and Organometallic Catalysts
- 1.1.1. Inexpensive Metals
- 1.1.2. Precious Metals
- 1.1.3. Metallic Compounds
-
1.2. Aluminosilicates
- 1.2.1. Zeolites
- 1.2.2. Molecular Sieves
-
1.3. Chemical Compounds
- 1.3.1. Peroxides
- 1.3.2. Acids
- 1.3.3. Amines
- 1.3.4. Other Chemical Compounds
- 1.4. Other Materials
-
1.1. Metals and Organometallic Catalysts
-
2. Application
-
2.1. Petroleum Refining
- 2.1.1. Fluid Catalytic Cracking (FCC)
- 2.1.2. Hydrocracking
- 2.1.3. Hydrotreating
- 2.1.4. Alkylation
- 2.1.5. Reforming
- 2.1.6. Isomerization
-
2.2. Chemical Synthesis
- 2.2.1. Organic Synthesis
- 2.2.2. Oxidation
- 2.2.3. Hydrogenation
- 2.2.4. Dehydrogenation
- 2.2.5. Synthesis Gas Processes
-
2.3. Polymerization
- 2.3.1. Polyolefins
- 2.3.2. Condensation Polymers
- 2.3.3. Thermosetting Polymers
- 2.3.4. Additional Polymers
-
2.1. Petroleum Refining
Petroleum Refining & Chemicals Catalysts Industry Segmentation By Geography
-
1. Asia Pacific
- 1.1. China
- 1.2. India
- 1.3. Japan
- 1.4. South Korea
- 1.5. ASEAN Countries
- 1.6. Rest of Asia Pacific
-
2. North America
- 2.1. United States
- 2.2. Canada
- 2.3. Mexico
-
3. Europe
- 3.1. Germany
- 3.2. United Kingdom
- 3.3. Italy
- 3.4. France
- 3.5. Rest of Europe
-
4. South America
- 4.1. Brazil
- 4.2. Argentina
- 4.3. Rest of South America
-
5. Middle East and Africa
- 5.1. Saudi Arabia
- 5.2. South Africa
- 5.3. Rest of Middle East and Africa
Petroleum Refining & Chemicals Catalysts Industry Regional Market Share
Geographic Coverage of Petroleum Refining & Chemicals Catalysts Industry
Petroleum Refining & Chemicals Catalysts Industry REPORT HIGHLIGHTS
| Aspects | Details |
|---|---|
| Study Period | 2020-2034 |
| Base Year | 2025 |
| Estimated Year | 2026 |
| Forecast Period | 2026-2034 |
| Historical Period | 2020-2025 |
| Growth Rate | CAGR of 4.3% from 2020-2034 |
| Segmentation |
|
Table of Contents
- 1. Introduction
- 1.1. Research Scope
- 1.2. Market Segmentation
- 1.3. Research Objective
- 1.4. Definitions and Assumptions
- 2. Executive Summary
- 2.1. Market Snapshot
- 3. Market Dynamics
- 3.1. Market Drivers
- 3.2. Market Restrains
- 3.3. Market Trends
- 3.4. Market Opportunities
- 4. Market Factor Analysis
- 4.1. Porters Five Forces
- 4.1.1. Bargaining Power of Suppliers
- 4.1.2. Bargaining Power of Buyers
- 4.1.3. Threat of New Entrants
- 4.1.4. Threat of Substitutes
- 4.1.5. Competitive Rivalry
- 4.2. PESTEL analysis
- 4.3. BCG Analysis
- 4.3.1. Stars (High Growth, High Market Share)
- 4.3.2. Cash Cows (Low Growth, High Market Share)
- 4.3.3. Question Mark (High Growth, Low Market Share)
- 4.3.4. Dogs (Low Growth, Low Market Share)
- 4.4. Ansoff Matrix Analysis
- 4.5. Supply Chain Analysis
- 4.6. Regulatory Landscape
- 4.7. Current Market Potential and Opportunity Assessment (TAM–SAM–SOM Framework)
- 4.8. RAX Analyst Note
- 4.1. Porters Five Forces
- 5. Market Analysis, Insights and Forecast 2021-2033
- 5.1. Market Analysis, Insights and Forecast - by Material
- 5.1.1. Metals and Organometallic Catalysts
- 5.1.1.1. Inexpensive Metals
- 5.1.1.2. Precious Metals
- 5.1.1.3. Metallic Compounds
- 5.1.2. Aluminosilicates
- 5.1.2.1. Zeolites
- 5.1.2.2. Molecular Sieves
- 5.1.3. Chemical Compounds
- 5.1.3.1. Peroxides
- 5.1.3.2. Acids
- 5.1.3.3. Amines
- 5.1.3.4. Other Chemical Compounds
- 5.1.4. Other Materials
- 5.1.1. Metals and Organometallic Catalysts
- 5.2. Market Analysis, Insights and Forecast - by Application
- 5.2.1. Petroleum Refining
- 5.2.1.1. Fluid Catalytic Cracking (FCC)
- 5.2.1.2. Hydrocracking
- 5.2.1.3. Hydrotreating
- 5.2.1.4. Alkylation
- 5.2.1.5. Reforming
- 5.2.1.6. Isomerization
- 5.2.2. Chemical Synthesis
- 5.2.2.1. Organic Synthesis
- 5.2.2.2. Oxidation
- 5.2.2.3. Hydrogenation
- 5.2.2.4. Dehydrogenation
- 5.2.2.5. Synthesis Gas Processes
- 5.2.3. Polymerization
- 5.2.3.1. Polyolefins
- 5.2.3.2. Condensation Polymers
- 5.2.3.3. Thermosetting Polymers
- 5.2.3.4. Additional Polymers
- 5.2.1. Petroleum Refining
- 5.3. Market Analysis, Insights and Forecast - by Region
- 5.3.1. Asia Pacific
- 5.3.2. North America
- 5.3.3. Europe
- 5.3.4. South America
- 5.3.5. Middle East and Africa
- 5.1. Market Analysis, Insights and Forecast - by Material
- 6. Global Petroleum Refining & Chemicals Catalysts Industry Analysis, Insights and Forecast, 2021-2033
- 6.1. Market Analysis, Insights and Forecast - by Material
- 6.1.1. Metals and Organometallic Catalysts
- 6.1.1.1. Inexpensive Metals
- 6.1.1.2. Precious Metals
- 6.1.1.3. Metallic Compounds
- 6.1.2. Aluminosilicates
- 6.1.2.1. Zeolites
- 6.1.2.2. Molecular Sieves
- 6.1.3. Chemical Compounds
- 6.1.3.1. Peroxides
- 6.1.3.2. Acids
- 6.1.3.3. Amines
- 6.1.3.4. Other Chemical Compounds
- 6.1.4. Other Materials
- 6.1.1. Metals and Organometallic Catalysts
- 6.2. Market Analysis, Insights and Forecast - by Application
- 6.2.1. Petroleum Refining
- 6.2.1.1. Fluid Catalytic Cracking (FCC)
- 6.2.1.2. Hydrocracking
- 6.2.1.3. Hydrotreating
- 6.2.1.4. Alkylation
- 6.2.1.5. Reforming
- 6.2.1.6. Isomerization
- 6.2.2. Chemical Synthesis
- 6.2.2.1. Organic Synthesis
- 6.2.2.2. Oxidation
- 6.2.2.3. Hydrogenation
- 6.2.2.4. Dehydrogenation
- 6.2.2.5. Synthesis Gas Processes
- 6.2.3. Polymerization
- 6.2.3.1. Polyolefins
- 6.2.3.2. Condensation Polymers
- 6.2.3.3. Thermosetting Polymers
- 6.2.3.4. Additional Polymers
- 6.2.1. Petroleum Refining
- 6.1. Market Analysis, Insights and Forecast - by Material
- 7. Asia Pacific Petroleum Refining & Chemicals Catalysts Industry Analysis, Insights and Forecast, 2020-2032
- 7.1. Market Analysis, Insights and Forecast - by Material
- 7.1.1. Metals and Organometallic Catalysts
- 7.1.1.1. Inexpensive Metals
- 7.1.1.2. Precious Metals
- 7.1.1.3. Metallic Compounds
- 7.1.2. Aluminosilicates
- 7.1.2.1. Zeolites
- 7.1.2.2. Molecular Sieves
- 7.1.3. Chemical Compounds
- 7.1.3.1. Peroxides
- 7.1.3.2. Acids
- 7.1.3.3. Amines
- 7.1.3.4. Other Chemical Compounds
- 7.1.4. Other Materials
- 7.1.1. Metals and Organometallic Catalysts
- 7.2. Market Analysis, Insights and Forecast - by Application
- 7.2.1. Petroleum Refining
- 7.2.1.1. Fluid Catalytic Cracking (FCC)
- 7.2.1.2. Hydrocracking
- 7.2.1.3. Hydrotreating
- 7.2.1.4. Alkylation
- 7.2.1.5. Reforming
- 7.2.1.6. Isomerization
- 7.2.2. Chemical Synthesis
- 7.2.2.1. Organic Synthesis
- 7.2.2.2. Oxidation
- 7.2.2.3. Hydrogenation
- 7.2.2.4. Dehydrogenation
- 7.2.2.5. Synthesis Gas Processes
- 7.2.3. Polymerization
- 7.2.3.1. Polyolefins
- 7.2.3.2. Condensation Polymers
- 7.2.3.3. Thermosetting Polymers
- 7.2.3.4. Additional Polymers
- 7.2.1. Petroleum Refining
- 7.1. Market Analysis, Insights and Forecast - by Material
- 8. North America Petroleum Refining & Chemicals Catalysts Industry Analysis, Insights and Forecast, 2020-2032
- 8.1. Market Analysis, Insights and Forecast - by Material
- 8.1.1. Metals and Organometallic Catalysts
- 8.1.1.1. Inexpensive Metals
- 8.1.1.2. Precious Metals
- 8.1.1.3. Metallic Compounds
- 8.1.2. Aluminosilicates
- 8.1.2.1. Zeolites
- 8.1.2.2. Molecular Sieves
- 8.1.3. Chemical Compounds
- 8.1.3.1. Peroxides
- 8.1.3.2. Acids
- 8.1.3.3. Amines
- 8.1.3.4. Other Chemical Compounds
- 8.1.4. Other Materials
- 8.1.1. Metals and Organometallic Catalysts
- 8.2. Market Analysis, Insights and Forecast - by Application
- 8.2.1. Petroleum Refining
- 8.2.1.1. Fluid Catalytic Cracking (FCC)
- 8.2.1.2. Hydrocracking
- 8.2.1.3. Hydrotreating
- 8.2.1.4. Alkylation
- 8.2.1.5. Reforming
- 8.2.1.6. Isomerization
- 8.2.2. Chemical Synthesis
- 8.2.2.1. Organic Synthesis
- 8.2.2.2. Oxidation
- 8.2.2.3. Hydrogenation
- 8.2.2.4. Dehydrogenation
- 8.2.2.5. Synthesis Gas Processes
- 8.2.3. Polymerization
- 8.2.3.1. Polyolefins
- 8.2.3.2. Condensation Polymers
- 8.2.3.3. Thermosetting Polymers
- 8.2.3.4. Additional Polymers
- 8.2.1. Petroleum Refining
- 8.1. Market Analysis, Insights and Forecast - by Material
- 9. Europe Petroleum Refining & Chemicals Catalysts Industry Analysis, Insights and Forecast, 2020-2032
- 9.1. Market Analysis, Insights and Forecast - by Material
- 9.1.1. Metals and Organometallic Catalysts
- 9.1.1.1. Inexpensive Metals
- 9.1.1.2. Precious Metals
- 9.1.1.3. Metallic Compounds
- 9.1.2. Aluminosilicates
- 9.1.2.1. Zeolites
- 9.1.2.2. Molecular Sieves
- 9.1.3. Chemical Compounds
- 9.1.3.1. Peroxides
- 9.1.3.2. Acids
- 9.1.3.3. Amines
- 9.1.3.4. Other Chemical Compounds
- 9.1.4. Other Materials
- 9.1.1. Metals and Organometallic Catalysts
- 9.2. Market Analysis, Insights and Forecast - by Application
- 9.2.1. Petroleum Refining
- 9.2.1.1. Fluid Catalytic Cracking (FCC)
- 9.2.1.2. Hydrocracking
- 9.2.1.3. Hydrotreating
- 9.2.1.4. Alkylation
- 9.2.1.5. Reforming
- 9.2.1.6. Isomerization
- 9.2.2. Chemical Synthesis
- 9.2.2.1. Organic Synthesis
- 9.2.2.2. Oxidation
- 9.2.2.3. Hydrogenation
- 9.2.2.4. Dehydrogenation
- 9.2.2.5. Synthesis Gas Processes
- 9.2.3. Polymerization
- 9.2.3.1. Polyolefins
- 9.2.3.2. Condensation Polymers
- 9.2.3.3. Thermosetting Polymers
- 9.2.3.4. Additional Polymers
- 9.2.1. Petroleum Refining
- 9.1. Market Analysis, Insights and Forecast - by Material
- 10. South America Petroleum Refining & Chemicals Catalysts Industry Analysis, Insights and Forecast, 2020-2032
- 10.1. Market Analysis, Insights and Forecast - by Material
- 10.1.1. Metals and Organometallic Catalysts
- 10.1.1.1. Inexpensive Metals
- 10.1.1.2. Precious Metals
- 10.1.1.3. Metallic Compounds
- 10.1.2. Aluminosilicates
- 10.1.2.1. Zeolites
- 10.1.2.2. Molecular Sieves
- 10.1.3. Chemical Compounds
- 10.1.3.1. Peroxides
- 10.1.3.2. Acids
- 10.1.3.3. Amines
- 10.1.3.4. Other Chemical Compounds
- 10.1.4. Other Materials
- 10.1.1. Metals and Organometallic Catalysts
- 10.2. Market Analysis, Insights and Forecast - by Application
- 10.2.1. Petroleum Refining
- 10.2.1.1. Fluid Catalytic Cracking (FCC)
- 10.2.1.2. Hydrocracking
- 10.2.1.3. Hydrotreating
- 10.2.1.4. Alkylation
- 10.2.1.5. Reforming
- 10.2.1.6. Isomerization
- 10.2.2. Chemical Synthesis
- 10.2.2.1. Organic Synthesis
- 10.2.2.2. Oxidation
- 10.2.2.3. Hydrogenation
- 10.2.2.4. Dehydrogenation
- 10.2.2.5. Synthesis Gas Processes
- 10.2.3. Polymerization
- 10.2.3.1. Polyolefins
- 10.2.3.2. Condensation Polymers
- 10.2.3.3. Thermosetting Polymers
- 10.2.3.4. Additional Polymers
- 10.2.1. Petroleum Refining
- 10.1. Market Analysis, Insights and Forecast - by Material
- 11. Middle East and Africa Petroleum Refining & Chemicals Catalysts Industry Analysis, Insights and Forecast, 2020-2032
- 11.1. Market Analysis, Insights and Forecast - by Material
- 11.1.1. Metals and Organometallic Catalysts
- 11.1.1.1. Inexpensive Metals
- 11.1.1.2. Precious Metals
- 11.1.1.3. Metallic Compounds
- 11.1.2. Aluminosilicates
- 11.1.2.1. Zeolites
- 11.1.2.2. Molecular Sieves
- 11.1.3. Chemical Compounds
- 11.1.3.1. Peroxides
- 11.1.3.2. Acids
- 11.1.3.3. Amines
- 11.1.3.4. Other Chemical Compounds
- 11.1.4. Other Materials
- 11.1.1. Metals and Organometallic Catalysts
- 11.2. Market Analysis, Insights and Forecast - by Application
- 11.2.1. Petroleum Refining
- 11.2.1.1. Fluid Catalytic Cracking (FCC)
- 11.2.1.2. Hydrocracking
- 11.2.1.3. Hydrotreating
- 11.2.1.4. Alkylation
- 11.2.1.5. Reforming
- 11.2.1.6. Isomerization
- 11.2.2. Chemical Synthesis
- 11.2.2.1. Organic Synthesis
- 11.2.2.2. Oxidation
- 11.2.2.3. Hydrogenation
- 11.2.2.4. Dehydrogenation
- 11.2.2.5. Synthesis Gas Processes
- 11.2.3. Polymerization
- 11.2.3.1. Polyolefins
- 11.2.3.2. Condensation Polymers
- 11.2.3.3. Thermosetting Polymers
- 11.2.3.4. Additional Polymers
- 11.2.1. Petroleum Refining
- 11.1. Market Analysis, Insights and Forecast - by Material
- 12. Competitive Analysis
- 12.1. Company Profiles
- 12.1.1 Chevron Phillips Chemical Company
- 12.1.1.1. Company Overview
- 12.1.1.2. Products
- 12.1.1.3. Company Financials
- 12.1.1.4. SWOT Analysis
- 12.1.2 Honeywell International Inc
- 12.1.2.1. Company Overview
- 12.1.2.2. Products
- 12.1.2.3. Company Financials
- 12.1.2.4. SWOT Analysis
- 12.1.3 W R Grace & Co
- 12.1.3.1. Company Overview
- 12.1.3.2. Products
- 12.1.3.3. Company Financials
- 12.1.3.4. SWOT Analysis
- 12.1.4 Catalytic Distillation Technologies
- 12.1.4.1. Company Overview
- 12.1.4.2. Products
- 12.1.4.3. Company Financials
- 12.1.4.4. SWOT Analysis
- 12.1.5 Exxon Mobil Corporation
- 12.1.5.1. Company Overview
- 12.1.5.2. Products
- 12.1.5.3. Company Financials
- 12.1.5.4. SWOT Analysis
- 12.1.6 INEOS Technologies
- 12.1.6.1. Company Overview
- 12.1.6.2. Products
- 12.1.6.3. Company Financials
- 12.1.6.4. SWOT Analysis
- 12.1.7 Johnson Matthey Inc
- 12.1.7.1. Company Overview
- 12.1.7.2. Products
- 12.1.7.3. Company Financials
- 12.1.7.4. SWOT Analysis
- 12.1.8 Evonik Industries AG
- 12.1.8.1. Company Overview
- 12.1.8.2. Products
- 12.1.8.3. Company Financials
- 12.1.8.4. SWOT Analysis
- 12.1.9 Wako Chemicals USA Inc
- 12.1.9.1. Company Overview
- 12.1.9.2. Products
- 12.1.9.3. Company Financials
- 12.1.9.4. SWOT Analysis
- 12.1.10 KBR Inc
- 12.1.10.1. Company Overview
- 12.1.10.2. Products
- 12.1.10.3. Company Financials
- 12.1.10.4. SWOT Analysis
- 12.1.11 BASF SE
- 12.1.11.1. Company Overview
- 12.1.11.2. Products
- 12.1.11.3. Company Financials
- 12.1.11.4. SWOT Analysis
- 12.1.12 Eka Chemicals AB
- 12.1.12.1. Company Overview
- 12.1.12.2. Products
- 12.1.12.3. Company Financials
- 12.1.12.4. SWOT Analysis
- 12.1.13 Zeochem LLC
- 12.1.13.1. Company Overview
- 12.1.13.2. Products
- 12.1.13.3. Company Financials
- 12.1.13.4. SWOT Analysis
- 12.1.14 Zeolyst International*List Not Exhaustive
- 12.1.14.1. Company Overview
- 12.1.14.2. Products
- 12.1.14.3. Company Financials
- 12.1.14.4. SWOT Analysis
- 12.1.15 Chicago Bridge & Iron Company
- 12.1.15.1. Company Overview
- 12.1.15.2. Products
- 12.1.15.3. Company Financials
- 12.1.15.4. SWOT Analysis
- 12.1.16 Dow
- 12.1.16.1. Company Overview
- 12.1.16.2. Products
- 12.1.16.3. Company Financials
- 12.1.16.4. SWOT Analysis
- 12.1.17 Bayer Technology Services
- 12.1.17.1. Company Overview
- 12.1.17.2. Products
- 12.1.17.3. Company Financials
- 12.1.17.4. SWOT Analysis
- 12.1.18 Nova Chemicals Corp
- 12.1.18.1. Company Overview
- 12.1.18.2. Products
- 12.1.18.3. Company Financials
- 12.1.18.4. SWOT Analysis
- 12.1.19 Clariant International Ltd
- 12.1.19.1. Company Overview
- 12.1.19.2. Products
- 12.1.19.3. Company Financials
- 12.1.19.4. SWOT Analysis
- 12.1.20 Eastman Chemical Co
- 12.1.20.1. Company Overview
- 12.1.20.2. Products
- 12.1.20.3. Company Financials
- 12.1.20.4. SWOT Analysis
- 12.1.1 Chevron Phillips Chemical Company
- 12.2. Market Entropy
- 12.2.1 Company's Key Areas Served
- 12.2.2 Recent Developments
- 12.3. Company Market Share Analysis 2025
- 12.3.1 Top 5 Companies Market Share Analysis
- 12.3.2 Top 3 Companies Market Share Analysis
- 12.4. List of Potential Customers
- 13. Research Methodology
List of Figures
- Figure 1: Global Petroleum Refining & Chemicals Catalysts Industry Revenue Breakdown (million, %) by Region 2025 & 2033
- Figure 2: Asia Pacific Petroleum Refining & Chemicals Catalysts Industry Revenue (million), by Material 2025 & 2033
- Figure 3: Asia Pacific Petroleum Refining & Chemicals Catalysts Industry Revenue Share (%), by Material 2025 & 2033
- Figure 4: Asia Pacific Petroleum Refining & Chemicals Catalysts Industry Revenue (million), by Application 2025 & 2033
- Figure 5: Asia Pacific Petroleum Refining & Chemicals Catalysts Industry Revenue Share (%), by Application 2025 & 2033
- Figure 6: Asia Pacific Petroleum Refining & Chemicals Catalysts Industry Revenue (million), by Country 2025 & 2033
- Figure 7: Asia Pacific Petroleum Refining & Chemicals Catalysts Industry Revenue Share (%), by Country 2025 & 2033
- Figure 8: North America Petroleum Refining & Chemicals Catalysts Industry Revenue (million), by Material 2025 & 2033
- Figure 9: North America Petroleum Refining & Chemicals Catalysts Industry Revenue Share (%), by Material 2025 & 2033
- Figure 10: North America Petroleum Refining & Chemicals Catalysts Industry Revenue (million), by Application 2025 & 2033
- Figure 11: North America Petroleum Refining & Chemicals Catalysts Industry Revenue Share (%), by Application 2025 & 2033
- Figure 12: North America Petroleum Refining & Chemicals Catalysts Industry Revenue (million), by Country 2025 & 2033
- Figure 13: North America Petroleum Refining & Chemicals Catalysts Industry Revenue Share (%), by Country 2025 & 2033
- Figure 14: Europe Petroleum Refining & Chemicals Catalysts Industry Revenue (million), by Material 2025 & 2033
- Figure 15: Europe Petroleum Refining & Chemicals Catalysts Industry Revenue Share (%), by Material 2025 & 2033
- Figure 16: Europe Petroleum Refining & Chemicals Catalysts Industry Revenue (million), by Application 2025 & 2033
- Figure 17: Europe Petroleum Refining & Chemicals Catalysts Industry Revenue Share (%), by Application 2025 & 2033
- Figure 18: Europe Petroleum Refining & Chemicals Catalysts Industry Revenue (million), by Country 2025 & 2033
- Figure 19: Europe Petroleum Refining & Chemicals Catalysts Industry Revenue Share (%), by Country 2025 & 2033
- Figure 20: South America Petroleum Refining & Chemicals Catalysts Industry Revenue (million), by Material 2025 & 2033
- Figure 21: South America Petroleum Refining & Chemicals Catalysts Industry Revenue Share (%), by Material 2025 & 2033
- Figure 22: South America Petroleum Refining & Chemicals Catalysts Industry Revenue (million), by Application 2025 & 2033
- Figure 23: South America Petroleum Refining & Chemicals Catalysts Industry Revenue Share (%), by Application 2025 & 2033
- Figure 24: South America Petroleum Refining & Chemicals Catalysts Industry Revenue (million), by Country 2025 & 2033
- Figure 25: South America Petroleum Refining & Chemicals Catalysts Industry Revenue Share (%), by Country 2025 & 2033
- Figure 26: Middle East and Africa Petroleum Refining & Chemicals Catalysts Industry Revenue (million), by Material 2025 & 2033
- Figure 27: Middle East and Africa Petroleum Refining & Chemicals Catalysts Industry Revenue Share (%), by Material 2025 & 2033
- Figure 28: Middle East and Africa Petroleum Refining & Chemicals Catalysts Industry Revenue (million), by Application 2025 & 2033
- Figure 29: Middle East and Africa Petroleum Refining & Chemicals Catalysts Industry Revenue Share (%), by Application 2025 & 2033
- Figure 30: Middle East and Africa Petroleum Refining & Chemicals Catalysts Industry Revenue (million), by Country 2025 & 2033
- Figure 31: Middle East and Africa Petroleum Refining & Chemicals Catalysts Industry Revenue Share (%), by Country 2025 & 2033
List of Tables
- Table 1: Global Petroleum Refining & Chemicals Catalysts Industry Revenue million Forecast, by Material 2020 & 2033
- Table 2: Global Petroleum Refining & Chemicals Catalysts Industry Revenue million Forecast, by Application 2020 & 2033
- Table 3: Global Petroleum Refining & Chemicals Catalysts Industry Revenue million Forecast, by Region 2020 & 2033
- Table 4: Global Petroleum Refining & Chemicals Catalysts Industry Revenue million Forecast, by Material 2020 & 2033
- Table 5: Global Petroleum Refining & Chemicals Catalysts Industry Revenue million Forecast, by Application 2020 & 2033
- Table 6: Global Petroleum Refining & Chemicals Catalysts Industry Revenue million Forecast, by Country 2020 & 2033
- Table 7: China Petroleum Refining & Chemicals Catalysts Industry Revenue (million) Forecast, by Application 2020 & 2033
- Table 8: India Petroleum Refining & Chemicals Catalysts Industry Revenue (million) Forecast, by Application 2020 & 2033
- Table 9: Japan Petroleum Refining & Chemicals Catalysts Industry Revenue (million) Forecast, by Application 2020 & 2033
- Table 10: South Korea Petroleum Refining & Chemicals Catalysts Industry Revenue (million) Forecast, by Application 2020 & 2033
- Table 11: ASEAN Countries Petroleum Refining & Chemicals Catalysts Industry Revenue (million) Forecast, by Application 2020 & 2033
- Table 12: Rest of Asia Pacific Petroleum Refining & Chemicals Catalysts Industry Revenue (million) Forecast, by Application 2020 & 2033
- Table 13: Global Petroleum Refining & Chemicals Catalysts Industry Revenue million Forecast, by Material 2020 & 2033
- Table 14: Global Petroleum Refining & Chemicals Catalysts Industry Revenue million Forecast, by Application 2020 & 2033
- Table 15: Global Petroleum Refining & Chemicals Catalysts Industry Revenue million Forecast, by Country 2020 & 2033
- Table 16: United States Petroleum Refining & Chemicals Catalysts Industry Revenue (million) Forecast, by Application 2020 & 2033
- Table 17: Canada Petroleum Refining & Chemicals Catalysts Industry Revenue (million) Forecast, by Application 2020 & 2033
- Table 18: Mexico Petroleum Refining & Chemicals Catalysts Industry Revenue (million) Forecast, by Application 2020 & 2033
- Table 19: Global Petroleum Refining & Chemicals Catalysts Industry Revenue million Forecast, by Material 2020 & 2033
- Table 20: Global Petroleum Refining & Chemicals Catalysts Industry Revenue million Forecast, by Application 2020 & 2033
- Table 21: Global Petroleum Refining & Chemicals Catalysts Industry Revenue million Forecast, by Country 2020 & 2033
- Table 22: Germany Petroleum Refining & Chemicals Catalysts Industry Revenue (million) Forecast, by Application 2020 & 2033
- Table 23: United Kingdom Petroleum Refining & Chemicals Catalysts Industry Revenue (million) Forecast, by Application 2020 & 2033
- Table 24: Italy Petroleum Refining & Chemicals Catalysts Industry Revenue (million) Forecast, by Application 2020 & 2033
- Table 25: France Petroleum Refining & Chemicals Catalysts Industry Revenue (million) Forecast, by Application 2020 & 2033
- Table 26: Rest of Europe Petroleum Refining & Chemicals Catalysts Industry Revenue (million) Forecast, by Application 2020 & 2033
- Table 27: Global Petroleum Refining & Chemicals Catalysts Industry Revenue million Forecast, by Material 2020 & 2033
- Table 28: Global Petroleum Refining & Chemicals Catalysts Industry Revenue million Forecast, by Application 2020 & 2033
- Table 29: Global Petroleum Refining & Chemicals Catalysts Industry Revenue million Forecast, by Country 2020 & 2033
- Table 30: Brazil Petroleum Refining & Chemicals Catalysts Industry Revenue (million) Forecast, by Application 2020 & 2033
- Table 31: Argentina Petroleum Refining & Chemicals Catalysts Industry Revenue (million) Forecast, by Application 2020 & 2033
- Table 32: Rest of South America Petroleum Refining & Chemicals Catalysts Industry Revenue (million) Forecast, by Application 2020 & 2033
- Table 33: Global Petroleum Refining & Chemicals Catalysts Industry Revenue million Forecast, by Material 2020 & 2033
- Table 34: Global Petroleum Refining & Chemicals Catalysts Industry Revenue million Forecast, by Application 2020 & 2033
- Table 35: Global Petroleum Refining & Chemicals Catalysts Industry Revenue million Forecast, by Country 2020 & 2033
- Table 36: Saudi Arabia Petroleum Refining & Chemicals Catalysts Industry Revenue (million) Forecast, by Application 2020 & 2033
- Table 37: South Africa Petroleum Refining & Chemicals Catalysts Industry Revenue (million) Forecast, by Application 2020 & 2033
- Table 38: Rest of Middle East and Africa Petroleum Refining & Chemicals Catalysts Industry Revenue (million) Forecast, by Application 2020 & 2033
Frequently Asked Questions
1. What is the projected Compound Annual Growth Rate (CAGR) of the Petroleum Refining & Chemicals Catalysts Industry?
The projected CAGR is approximately 4.3%.
2. Which companies are prominent players in the Petroleum Refining & Chemicals Catalysts Industry?
Key companies in the market include Chevron Phillips Chemical Company, Honeywell International Inc, W R Grace & Co, Catalytic Distillation Technologies, Exxon Mobil Corporation, INEOS Technologies, Johnson Matthey Inc, Evonik Industries AG, Wako Chemicals USA Inc, KBR Inc, BASF SE, Eka Chemicals AB, Zeochem LLC, Zeolyst International*List Not Exhaustive, Chicago Bridge & Iron Company, Dow, Bayer Technology Services, Nova Chemicals Corp, Clariant International Ltd, Eastman Chemical Co.
3. What are the main segments of the Petroleum Refining & Chemicals Catalysts Industry?
The market segments include Material, Application.
4. Can you provide details about the market size?
The market size is estimated to be USD 10096.57 million as of 2022.
5. What are some drivers contributing to market growth?
Increasing Refinery Market Output in Africa; Middle East; and Asia-Pacific; Rising Demand for Maintaining High Octane Figures.
6. What are the notable trends driving market growth?
Petroleum Refining Application to Dominate the Market.
7. Are there any restraints impacting market growth?
High Manufacturing Costs; Other Restraints.
8. Can you provide examples of recent developments in the market?
N/A
9. What pricing options are available for accessing the report?
Pricing options include single-user, multi-user, and enterprise licenses priced at USD 4750, USD 5250, and USD 8750 respectively.
10. Is the market size provided in terms of value or volume?
The market size is provided in terms of value, measured in million.
11. Are there any specific market keywords associated with the report?
Yes, the market keyword associated with the report is "Petroleum Refining & Chemicals Catalysts Industry," which aids in identifying and referencing the specific market segment covered.
12. How do I determine which pricing option suits my needs best?
The pricing options vary based on user requirements and access needs. Individual users may opt for single-user licenses, while businesses requiring broader access may choose multi-user or enterprise licenses for cost-effective access to the report.
13. Are there any additional resources or data provided in the Petroleum Refining & Chemicals Catalysts Industry report?
While the report offers comprehensive insights, it's advisable to review the specific contents or supplementary materials provided to ascertain if additional resources or data are available.
14. How can I stay updated on further developments or reports in the Petroleum Refining & Chemicals Catalysts Industry?
To stay informed about further developments, trends, and reports in the Petroleum Refining & Chemicals Catalysts Industry, consider subscribing to industry newsletters, following relevant companies and organizations, or regularly checking reputable industry news sources and publications.
Methodology
Step 1 - Identification of Relevant Samples Size from Population Database


Step 2 - Approaches for Defining Global Market Size (Value, Volume* & Price*)

Note*: In applicable scenarios
Step 3 - Data Sources
Primary Research
- Web Analytics
- Survey Reports
- Research Institute
- Latest Research Reports
- Opinion Leaders
Secondary Research
- Annual Reports
- White Paper
- Latest Press Release
- Industry Association
- Paid Database
- Investor Presentations

Step 4 - Data Triangulation
Involves using different sources of information in order to increase the validity of a study
These sources are likely to be stakeholders in a program - participants, other researchers, program staff, other community members, and so on.
Then we put all data in single framework & apply various statistical tools to find out the dynamic on the market.
During the analysis stage, feedback from the stakeholder groups would be compared to determine areas of agreement as well as areas of divergence