Key Insights
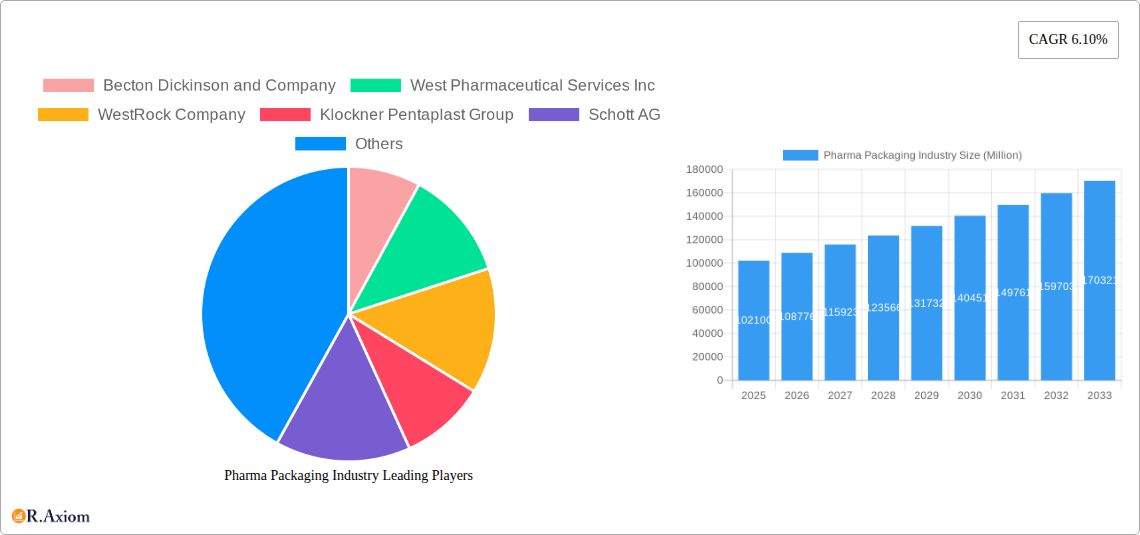
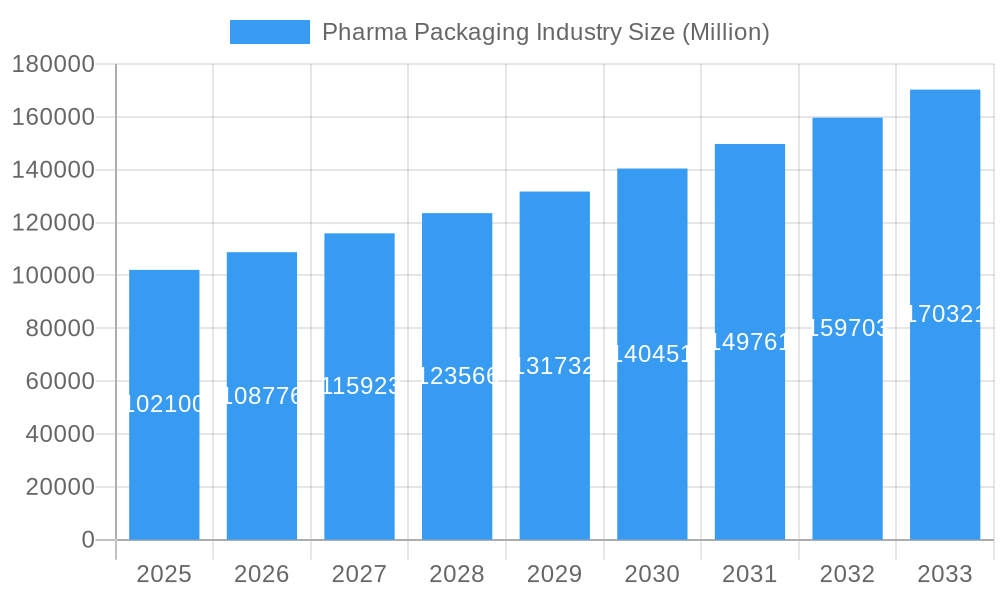
The pharmaceutical packaging market, valued at $102.10 billion in 2025, is projected to experience robust growth, driven by a compound annual growth rate (CAGR) of 6.10% from 2025 to 2033. This expansion is fueled by several key factors. Firstly, the rising global prevalence of chronic diseases necessitates increased pharmaceutical production, consequently boosting demand for packaging solutions. Secondly, advancements in drug delivery systems, such as pre-filled syringes and inhalers, are creating new opportunities for specialized and innovative packaging materials. Stringent regulatory requirements regarding drug safety and efficacy further contribute to market growth, as manufacturers invest in high-quality, tamper-evident packaging to ensure product integrity throughout the supply chain. The increasing adoption of e-commerce for pharmaceutical products also presents a significant driver, demanding secure and convenient packaging solutions suitable for online delivery. Finally, the growing focus on sustainability is pushing the industry toward eco-friendly packaging materials, such as recycled plastics and biodegradable alternatives, further stimulating innovation and market expansion.
Pharma Packaging Industry Market Size (In Billion)
Segment-wise, the plastics segment dominates the materials market due to its cost-effectiveness and versatility, while bottles and syringes lead the product type segment due to their widespread use. Regionally, North America and Europe currently hold significant market shares, owing to established pharmaceutical industries and strong regulatory frameworks. However, the Asia-Pacific region is poised for rapid growth in the coming years, driven by rising healthcare expenditure and an expanding pharmaceutical manufacturing base. Major players like Becton Dickinson, West Pharmaceutical Services, and Amcor are leveraging their established market presence and technological capabilities to capitalize on these trends. Competition is expected to intensify as smaller companies introduce innovative solutions and challenge established players, driving further market growth and diversification.
Pharma Packaging Industry Company Market Share
This in-depth report provides a comprehensive analysis of the Pharma Packaging industry, covering market size, growth projections, key players, and emerging trends from 2019 to 2033. The report utilizes a robust methodology, incorporating historical data (2019-2024), a base year of 2025, and an estimated and forecast period extending to 2033. This detailed analysis is essential for industry stakeholders, investors, and businesses seeking to understand the dynamics and future potential of this critical sector. The market is valued at xx Million in 2025 and is projected to reach xx Million by 2033, exhibiting a CAGR of xx%.
Pharma Packaging Industry Market Concentration & Innovation
The global pharma packaging market demonstrates a moderately concentrated landscape, with several major players holding significant market share. Becton Dickinson and Company, West Pharmaceutical Services Inc., and Amcor PLC are among the leading companies, collectively controlling an estimated xx% of the market in 2025. However, a considerable number of smaller, specialized companies also contribute significantly, particularly in niche segments.
Innovation in the pharma packaging industry is driven by several factors, including:
- Stringent regulatory requirements: The need to meet ever-evolving safety and quality standards pushes innovation in materials, designs, and manufacturing processes.
- Technological advancements: The adoption of advanced technologies like smart packaging, serialization, and track-and-trace systems is transforming the industry.
- Growing demand for convenient and user-friendly packaging: Consumers and healthcare professionals are increasingly demanding packaging that enhances medication adherence and reduces medication errors.
Mergers and acquisitions (M&A) are frequent in this sector, with deal values exceeding xx Million in recent years. Recent notable acquisitions include Amcor's acquisition of MDK (USD 50 Million). This demonstrates a strategic focus on expanding geographical reach and strengthening product portfolios within the high-growth medical device packaging segment. The competitive landscape is characterized by both organic growth initiatives and strategic acquisitions, driving further market consolidation. Product substitutes such as biodegradable and sustainable packaging are emerging, impacting the market share of traditional materials. End-user trends such as increasing demand for pre-filled syringes and convenient drug delivery systems are significantly shaping the packaging choices of pharmaceutical companies.
Pharma Packaging Industry Industry Trends & Insights
The pharma packaging market is experiencing robust growth driven by several key trends:
- The increasing prevalence of chronic diseases globally is driving higher demand for pharmaceutical products and consequently, their packaging.
- The rise of personalized medicine is creating demand for specialized packaging formats and solutions for targeted drug delivery systems.
- Technological advancements, such as the integration of digital technologies in packaging, are improving product traceability and reducing counterfeiting.
- The pharmaceutical industry’s focus on improving patient compliance and safety is driving the adoption of innovative packaging solutions that enhance medication adherence and reduce medication errors.
The market demonstrates significant growth across various regions, with the Asia-Pacific region anticipated to witness the fastest growth rate during the forecast period due to growing healthcare infrastructure and a rising middle class. This, coupled with the increasing preference for convenient and user-friendly packaging, fuels further market expansion. Competitive dynamics are characterized by intense competition among established players and the emergence of new entrants, leading to product differentiation and innovation.
Dominant Markets & Segments in Pharma Packaging Industry
Leading Region: The Asia-Pacific region is expected to dominate the market due to rapid economic growth, increasing healthcare expenditure, and a large aging population.
Leading Material Segment: Plastics maintain the largest market share due to its cost-effectiveness, versatility, and ability to meet diverse packaging needs. However, the increasing focus on sustainability is driving growth in the "Other Materials" segment encompassing biodegradable and eco-friendly alternatives.
Leading Product Type Segment: Bottles, vials, and ampoules hold a significant share, reflecting the widespread use of liquid medications. The growth in injectable drugs fuels the rising demand for syringes and pre-filled syringes.
Key Drivers for Dominance:
- Economic policies: Government initiatives promoting healthcare infrastructure and pharmaceutical manufacturing bolster market growth.
- Infrastructure: Well-developed healthcare infrastructure and logistics networks facilitate the distribution of packaged pharmaceuticals.
- Technological advancements: Advancements in materials science and packaging technologies enable the development of innovative and superior packaging solutions.
Pharma Packaging Industry Product Developments
Recent product innovations focus on enhancing drug stability, improving patient convenience, and bolstering security features. This includes the development of smart packaging incorporating integrated sensors for real-time monitoring of product integrity and temperature, as well as the use of tamper-evident closures and serialization technologies to combat counterfeiting. These innovations are tailored to specific therapeutic areas and cater to the evolving needs of both pharmaceutical manufacturers and end-users.
Report Scope & Segmentation Analysis
By Material:
Plastics: This segment accounts for the largest market share, driven by the cost-effectiveness and versatility of plastic materials. Growth is projected to be xx% CAGR during the forecast period. The competitive landscape is highly fragmented, with numerous players competing based on price and features.
Glass: Glass remains crucial for specific applications requiring high barrier properties, especially for sensitive pharmaceuticals. Growth is expected at a xx% CAGR. The market is more consolidated than plastics, with several key players holding significant market share.
Other Materials: This segment, encompassing biodegradable and sustainable alternatives, is experiencing rapid growth, driven by increasing environmental concerns. Growth projection is xx% CAGR. The competitive landscape is dynamic, with new entrants continuously emerging.
By Product Type:
Each product type segment (Bottles, Syringes, Vials and Ampoules, Tubes, Caps and Closures, Labels, Other Product Types) will be analyzed in a similar fashion, including growth projections and competitive dynamics. Specific details for each segment's market size and growth rates will be provided in the complete report.
Key Drivers of Pharma Packaging Industry Growth
Several factors contribute to the industry's growth. Firstly, increasing healthcare expenditure globally fuels demand for pharmaceuticals, consequently boosting the need for packaging. Secondly, technological advancements like smart packaging and serialization enhance product security and traceability. Thirdly, regulatory changes emphasizing patient safety and product integrity drive innovation and demand for advanced packaging solutions. Finally, the rising prevalence of chronic diseases globally increases the overall demand for packaged pharmaceuticals.
Challenges in the Pharma Packaging Industry Sector
Significant challenges include stringent regulatory compliance, demanding quality control standards, and the need for sustainable packaging solutions. Fluctuations in raw material prices and supply chain disruptions can impact production costs and timelines. Intense competition among numerous players also creates price pressures. The need to continuously adapt to evolving regulatory requirements and technological advancements represents a major ongoing challenge for companies in this sector.
Emerging Opportunities in Pharma Packaging Industry
The growing demand for personalized medicine and the increasing need for drug delivery systems are creating opportunities for specialized packaging. The development of sustainable and eco-friendly packaging solutions offers a significant opportunity for environmentally conscious companies. Expansion into emerging markets with developing healthcare infrastructures presents substantial growth potential. Finally, integration of digital technologies such as blockchain for anti-counterfeiting measures and IoT for real-time drug monitoring opens up new avenues for innovation.
Leading Players in the Pharma Packaging Industry Market
- Becton Dickinson and Company
- West Pharmaceutical Services Inc
- WestRock Company
- Klockner Pentaplast Group
- Schott AG
- Nipro Corporation
- W L Gore & Associates Inc
- AptarGroup Inc
- Berry Global Group Inc
- 3M Company
- Vetter Pharma International GmbH
- Amcor PLC
- CCL Industries Inc
- FlexiTuff International Ltd
- Catalent Inc
- McKesson Corporation
- Gerresheimer AG
Key Developments in Pharma Packaging Industry Industry
January 2023: Amcor announced the acquisition of Shanghai-based MDK, a medical device packaging company with annual sales of USD 50 Million. This acquisition strengthens Amcor's presence in the Asia-Pacific region.
June 2022: Catalent installed a high-speed blister packaging line in Japan, improving its clinical supply capabilities and providing greater flexibility for global customers.
Strategic Outlook for Pharma Packaging Industry Market
The pharma packaging market is poised for continued growth, driven by increasing healthcare expenditure, technological advancements, and the rising prevalence of chronic diseases. The focus on sustainable packaging and the integration of digital technologies will further shape market dynamics. Companies that successfully adapt to regulatory changes and embrace innovation will be well-positioned to capitalize on the substantial growth opportunities within this critical sector.
Pharma Packaging Industry Segmentation
-
1. Material
- 1.1. Plastics
- 1.2. Glass
- 1.3. Other Materials
-
2. Product Type
- 2.1. Bottles
- 2.2. Syringes
- 2.3. Vials and Ampoules
- 2.4. Tubes
- 2.5. Caps and Closures
- 2.6. Labels
- 2.7. Other Product Types
Pharma Packaging Industry Segmentation By Geography
-
1. North America
- 1.1. United States
- 1.2. Canada
-
2. Europe
- 2.1. Germany
- 2.2. United Kingdom
- 2.3. France
- 2.4. Italy
- 2.5. Spain
- 2.6. Rest of Europe
-
3. Asia Pacific
- 3.1. China
- 3.2. Japan
- 3.3. India
- 3.4. South Korea
- 3.5. Rest of Asia Pacific
-
4. Latin America
- 4.1. Brazil
- 4.2. Mexico
- 4.3. Rest of Latin America
-
5. Middle East and Africa
- 5.1. United Arab Emirates
- 5.2. Saudi Arabia
- 5.3. South Africa
- 5.4. Rest of Middle East and Africa
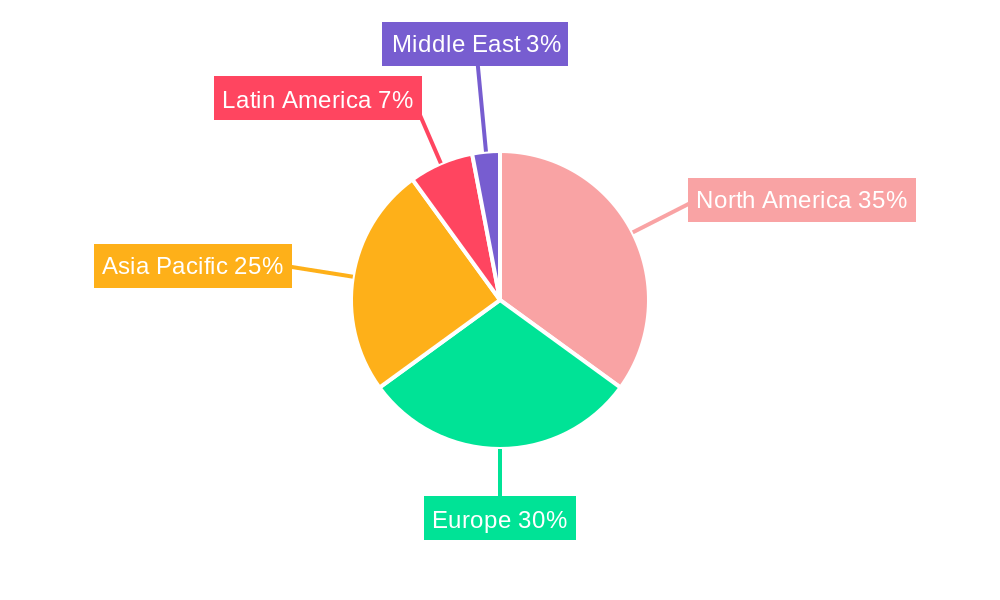
Pharma Packaging Industry Regional Market Share
Geographic Coverage of Pharma Packaging Industry
Pharma Packaging Industry REPORT HIGHLIGHTS
| Aspects | Details |
|---|---|
| Study Period | 2020-2034 |
| Base Year | 2025 |
| Estimated Year | 2026 |
| Forecast Period | 2026-2034 |
| Historical Period | 2020-2025 |
| Growth Rate | CAGR of 6.10% from 2020-2034 |
| Segmentation |
|
Table of Contents
- 1. Introduction
- 1.1. Research Scope
- 1.2. Market Segmentation
- 1.3. Research Objective
- 1.4. Definitions and Assumptions
- 2. Executive Summary
- 2.1. Market Snapshot
- 3. Market Dynamics
- 3.1. Market Drivers
- 3.2. Market Restrains
- 3.3. Market Trends
- 3.4. Market Opportunities
- 4. Market Factor Analysis
- 4.1. Porters Five Forces
- 4.1.1. Bargaining Power of Suppliers
- 4.1.2. Bargaining Power of Buyers
- 4.1.3. Threat of New Entrants
- 4.1.4. Threat of Substitutes
- 4.1.5. Competitive Rivalry
- 4.2. PESTEL analysis
- 4.3. BCG Analysis
- 4.3.1. Stars (High Growth, High Market Share)
- 4.3.2. Cash Cows (Low Growth, High Market Share)
- 4.3.3. Question Mark (High Growth, Low Market Share)
- 4.3.4. Dogs (Low Growth, Low Market Share)
- 4.4. Ansoff Matrix Analysis
- 4.5. Supply Chain Analysis
- 4.6. Regulatory Landscape
- 4.7. Current Market Potential and Opportunity Assessment (TAM–SAM–SOM Framework)
- 4.8. RAX Analyst Note
- 4.1. Porters Five Forces
- 5. Market Analysis, Insights and Forecast 2021-2033
- 5.1. Market Analysis, Insights and Forecast - by Material
- 5.1.1. Plastics
- 5.1.2. Glass
- 5.1.3. Other Materials
- 5.2. Market Analysis, Insights and Forecast - by Product Type
- 5.2.1. Bottles
- 5.2.2. Syringes
- 5.2.3. Vials and Ampoules
- 5.2.4. Tubes
- 5.2.5. Caps and Closures
- 5.2.6. Labels
- 5.2.7. Other Product Types
- 5.3. Market Analysis, Insights and Forecast - by Region
- 5.3.1. North America
- 5.3.2. Europe
- 5.3.3. Asia Pacific
- 5.3.4. Latin America
- 5.3.5. Middle East and Africa
- 5.1. Market Analysis, Insights and Forecast - by Material
- 6. Global Pharma Packaging Industry Analysis, Insights and Forecast, 2021-2033
- 6.1. Market Analysis, Insights and Forecast - by Material
- 6.1.1. Plastics
- 6.1.2. Glass
- 6.1.3. Other Materials
- 6.2. Market Analysis, Insights and Forecast - by Product Type
- 6.2.1. Bottles
- 6.2.2. Syringes
- 6.2.3. Vials and Ampoules
- 6.2.4. Tubes
- 6.2.5. Caps and Closures
- 6.2.6. Labels
- 6.2.7. Other Product Types
- 6.1. Market Analysis, Insights and Forecast - by Material
- 7. North America Pharma Packaging Industry Analysis, Insights and Forecast, 2020-2032
- 7.1. Market Analysis, Insights and Forecast - by Material
- 7.1.1. Plastics
- 7.1.2. Glass
- 7.1.3. Other Materials
- 7.2. Market Analysis, Insights and Forecast - by Product Type
- 7.2.1. Bottles
- 7.2.2. Syringes
- 7.2.3. Vials and Ampoules
- 7.2.4. Tubes
- 7.2.5. Caps and Closures
- 7.2.6. Labels
- 7.2.7. Other Product Types
- 7.1. Market Analysis, Insights and Forecast - by Material
- 8. Europe Pharma Packaging Industry Analysis, Insights and Forecast, 2020-2032
- 8.1. Market Analysis, Insights and Forecast - by Material
- 8.1.1. Plastics
- 8.1.2. Glass
- 8.1.3. Other Materials
- 8.2. Market Analysis, Insights and Forecast - by Product Type
- 8.2.1. Bottles
- 8.2.2. Syringes
- 8.2.3. Vials and Ampoules
- 8.2.4. Tubes
- 8.2.5. Caps and Closures
- 8.2.6. Labels
- 8.2.7. Other Product Types
- 8.1. Market Analysis, Insights and Forecast - by Material
- 9. Asia Pacific Pharma Packaging Industry Analysis, Insights and Forecast, 2020-2032
- 9.1. Market Analysis, Insights and Forecast - by Material
- 9.1.1. Plastics
- 9.1.2. Glass
- 9.1.3. Other Materials
- 9.2. Market Analysis, Insights and Forecast - by Product Type
- 9.2.1. Bottles
- 9.2.2. Syringes
- 9.2.3. Vials and Ampoules
- 9.2.4. Tubes
- 9.2.5. Caps and Closures
- 9.2.6. Labels
- 9.2.7. Other Product Types
- 9.1. Market Analysis, Insights and Forecast - by Material
- 10. Latin America Pharma Packaging Industry Analysis, Insights and Forecast, 2020-2032
- 10.1. Market Analysis, Insights and Forecast - by Material
- 10.1.1. Plastics
- 10.1.2. Glass
- 10.1.3. Other Materials
- 10.2. Market Analysis, Insights and Forecast - by Product Type
- 10.2.1. Bottles
- 10.2.2. Syringes
- 10.2.3. Vials and Ampoules
- 10.2.4. Tubes
- 10.2.5. Caps and Closures
- 10.2.6. Labels
- 10.2.7. Other Product Types
- 10.1. Market Analysis, Insights and Forecast - by Material
- 11. Middle East and Africa Pharma Packaging Industry Analysis, Insights and Forecast, 2020-2032
- 11.1. Market Analysis, Insights and Forecast - by Material
- 11.1.1. Plastics
- 11.1.2. Glass
- 11.1.3. Other Materials
- 11.2. Market Analysis, Insights and Forecast - by Product Type
- 11.2.1. Bottles
- 11.2.2. Syringes
- 11.2.3. Vials and Ampoules
- 11.2.4. Tubes
- 11.2.5. Caps and Closures
- 11.2.6. Labels
- 11.2.7. Other Product Types
- 11.1. Market Analysis, Insights and Forecast - by Material
- 12. Competitive Analysis
- 12.1. Company Profiles
- 12.1.1 Becton Dickinson and Company
- 12.1.1.1. Company Overview
- 12.1.1.2. Products
- 12.1.1.3. Company Financials
- 12.1.1.4. SWOT Analysis
- 12.1.2 West Pharmaceutical Services Inc
- 12.1.2.1. Company Overview
- 12.1.2.2. Products
- 12.1.2.3. Company Financials
- 12.1.2.4. SWOT Analysis
- 12.1.3 WestRock Company
- 12.1.3.1. Company Overview
- 12.1.3.2. Products
- 12.1.3.3. Company Financials
- 12.1.3.4. SWOT Analysis
- 12.1.4 Klockner Pentaplast Group
- 12.1.4.1. Company Overview
- 12.1.4.2. Products
- 12.1.4.3. Company Financials
- 12.1.4.4. SWOT Analysis
- 12.1.5 Schott AG
- 12.1.5.1. Company Overview
- 12.1.5.2. Products
- 12.1.5.3. Company Financials
- 12.1.5.4. SWOT Analysis
- 12.1.6 Nipro Corporation*List Not Exhaustive
- 12.1.6.1. Company Overview
- 12.1.6.2. Products
- 12.1.6.3. Company Financials
- 12.1.6.4. SWOT Analysis
- 12.1.7 W L Gore & Associates Inc
- 12.1.7.1. Company Overview
- 12.1.7.2. Products
- 12.1.7.3. Company Financials
- 12.1.7.4. SWOT Analysis
- 12.1.8 AptarGroup Inc
- 12.1.8.1. Company Overview
- 12.1.8.2. Products
- 12.1.8.3. Company Financials
- 12.1.8.4. SWOT Analysis
- 12.1.9 Berry Global Group Inc
- 12.1.9.1. Company Overview
- 12.1.9.2. Products
- 12.1.9.3. Company Financials
- 12.1.9.4. SWOT Analysis
- 12.1.10 3M Company
- 12.1.10.1. Company Overview
- 12.1.10.2. Products
- 12.1.10.3. Company Financials
- 12.1.10.4. SWOT Analysis
- 12.1.11 Vetter Pharma International GmbH
- 12.1.11.1. Company Overview
- 12.1.11.2. Products
- 12.1.11.3. Company Financials
- 12.1.11.4. SWOT Analysis
- 12.1.12 Amcor PLC
- 12.1.12.1. Company Overview
- 12.1.12.2. Products
- 12.1.12.3. Company Financials
- 12.1.12.4. SWOT Analysis
- 12.1.13 CCL Industries Inc
- 12.1.13.1. Company Overview
- 12.1.13.2. Products
- 12.1.13.3. Company Financials
- 12.1.13.4. SWOT Analysis
- 12.1.14 FlexiTuff International Ltd
- 12.1.14.1. Company Overview
- 12.1.14.2. Products
- 12.1.14.3. Company Financials
- 12.1.14.4. SWOT Analysis
- 12.1.15 Catalent Inc
- 12.1.15.1. Company Overview
- 12.1.15.2. Products
- 12.1.15.3. Company Financials
- 12.1.15.4. SWOT Analysis
- 12.1.16 McKesson Corporation
- 12.1.16.1. Company Overview
- 12.1.16.2. Products
- 12.1.16.3. Company Financials
- 12.1.16.4. SWOT Analysis
- 12.1.17 Gerresheimer AG
- 12.1.17.1. Company Overview
- 12.1.17.2. Products
- 12.1.17.3. Company Financials
- 12.1.17.4. SWOT Analysis
- 12.1.1 Becton Dickinson and Company
- 12.2. Market Entropy
- 12.2.1 Company's Key Areas Served
- 12.2.2 Recent Developments
- 12.3. Company Market Share Analysis 2025
- 12.3.1 Top 5 Companies Market Share Analysis
- 12.3.2 Top 3 Companies Market Share Analysis
- 12.4. List of Potential Customers
- 13. Research Methodology
List of Figures
- Figure 1: Global Pharma Packaging Industry Revenue Breakdown (Million, %) by Region 2025 & 2033
- Figure 2: North America Pharma Packaging Industry Revenue (Million), by Material 2025 & 2033
- Figure 3: North America Pharma Packaging Industry Revenue Share (%), by Material 2025 & 2033
- Figure 4: North America Pharma Packaging Industry Revenue (Million), by Product Type 2025 & 2033
- Figure 5: North America Pharma Packaging Industry Revenue Share (%), by Product Type 2025 & 2033
- Figure 6: North America Pharma Packaging Industry Revenue (Million), by Country 2025 & 2033
- Figure 7: North America Pharma Packaging Industry Revenue Share (%), by Country 2025 & 2033
- Figure 8: Europe Pharma Packaging Industry Revenue (Million), by Material 2025 & 2033
- Figure 9: Europe Pharma Packaging Industry Revenue Share (%), by Material 2025 & 2033
- Figure 10: Europe Pharma Packaging Industry Revenue (Million), by Product Type 2025 & 2033
- Figure 11: Europe Pharma Packaging Industry Revenue Share (%), by Product Type 2025 & 2033
- Figure 12: Europe Pharma Packaging Industry Revenue (Million), by Country 2025 & 2033
- Figure 13: Europe Pharma Packaging Industry Revenue Share (%), by Country 2025 & 2033
- Figure 14: Asia Pacific Pharma Packaging Industry Revenue (Million), by Material 2025 & 2033
- Figure 15: Asia Pacific Pharma Packaging Industry Revenue Share (%), by Material 2025 & 2033
- Figure 16: Asia Pacific Pharma Packaging Industry Revenue (Million), by Product Type 2025 & 2033
- Figure 17: Asia Pacific Pharma Packaging Industry Revenue Share (%), by Product Type 2025 & 2033
- Figure 18: Asia Pacific Pharma Packaging Industry Revenue (Million), by Country 2025 & 2033
- Figure 19: Asia Pacific Pharma Packaging Industry Revenue Share (%), by Country 2025 & 2033
- Figure 20: Latin America Pharma Packaging Industry Revenue (Million), by Material 2025 & 2033
- Figure 21: Latin America Pharma Packaging Industry Revenue Share (%), by Material 2025 & 2033
- Figure 22: Latin America Pharma Packaging Industry Revenue (Million), by Product Type 2025 & 2033
- Figure 23: Latin America Pharma Packaging Industry Revenue Share (%), by Product Type 2025 & 2033
- Figure 24: Latin America Pharma Packaging Industry Revenue (Million), by Country 2025 & 2033
- Figure 25: Latin America Pharma Packaging Industry Revenue Share (%), by Country 2025 & 2033
- Figure 26: Middle East and Africa Pharma Packaging Industry Revenue (Million), by Material 2025 & 2033
- Figure 27: Middle East and Africa Pharma Packaging Industry Revenue Share (%), by Material 2025 & 2033
- Figure 28: Middle East and Africa Pharma Packaging Industry Revenue (Million), by Product Type 2025 & 2033
- Figure 29: Middle East and Africa Pharma Packaging Industry Revenue Share (%), by Product Type 2025 & 2033
- Figure 30: Middle East and Africa Pharma Packaging Industry Revenue (Million), by Country 2025 & 2033
- Figure 31: Middle East and Africa Pharma Packaging Industry Revenue Share (%), by Country 2025 & 2033
List of Tables
- Table 1: Global Pharma Packaging Industry Revenue Million Forecast, by Material 2020 & 2033
- Table 2: Global Pharma Packaging Industry Revenue Million Forecast, by Product Type 2020 & 2033
- Table 3: Global Pharma Packaging Industry Revenue Million Forecast, by Region 2020 & 2033
- Table 4: Global Pharma Packaging Industry Revenue Million Forecast, by Material 2020 & 2033
- Table 5: Global Pharma Packaging Industry Revenue Million Forecast, by Product Type 2020 & 2033
- Table 6: Global Pharma Packaging Industry Revenue Million Forecast, by Country 2020 & 2033
- Table 7: United States Pharma Packaging Industry Revenue (Million) Forecast, by Application 2020 & 2033
- Table 8: Canada Pharma Packaging Industry Revenue (Million) Forecast, by Application 2020 & 2033
- Table 9: Global Pharma Packaging Industry Revenue Million Forecast, by Material 2020 & 2033
- Table 10: Global Pharma Packaging Industry Revenue Million Forecast, by Product Type 2020 & 2033
- Table 11: Global Pharma Packaging Industry Revenue Million Forecast, by Country 2020 & 2033
- Table 12: Germany Pharma Packaging Industry Revenue (Million) Forecast, by Application 2020 & 2033
- Table 13: United Kingdom Pharma Packaging Industry Revenue (Million) Forecast, by Application 2020 & 2033
- Table 14: France Pharma Packaging Industry Revenue (Million) Forecast, by Application 2020 & 2033
- Table 15: Italy Pharma Packaging Industry Revenue (Million) Forecast, by Application 2020 & 2033
- Table 16: Spain Pharma Packaging Industry Revenue (Million) Forecast, by Application 2020 & 2033
- Table 17: Rest of Europe Pharma Packaging Industry Revenue (Million) Forecast, by Application 2020 & 2033
- Table 18: Global Pharma Packaging Industry Revenue Million Forecast, by Material 2020 & 2033
- Table 19: Global Pharma Packaging Industry Revenue Million Forecast, by Product Type 2020 & 2033
- Table 20: Global Pharma Packaging Industry Revenue Million Forecast, by Country 2020 & 2033
- Table 21: China Pharma Packaging Industry Revenue (Million) Forecast, by Application 2020 & 2033
- Table 22: Japan Pharma Packaging Industry Revenue (Million) Forecast, by Application 2020 & 2033
- Table 23: India Pharma Packaging Industry Revenue (Million) Forecast, by Application 2020 & 2033
- Table 24: South Korea Pharma Packaging Industry Revenue (Million) Forecast, by Application 2020 & 2033
- Table 25: Rest of Asia Pacific Pharma Packaging Industry Revenue (Million) Forecast, by Application 2020 & 2033
- Table 26: Global Pharma Packaging Industry Revenue Million Forecast, by Material 2020 & 2033
- Table 27: Global Pharma Packaging Industry Revenue Million Forecast, by Product Type 2020 & 2033
- Table 28: Global Pharma Packaging Industry Revenue Million Forecast, by Country 2020 & 2033
- Table 29: Brazil Pharma Packaging Industry Revenue (Million) Forecast, by Application 2020 & 2033
- Table 30: Mexico Pharma Packaging Industry Revenue (Million) Forecast, by Application 2020 & 2033
- Table 31: Rest of Latin America Pharma Packaging Industry Revenue (Million) Forecast, by Application 2020 & 2033
- Table 32: Global Pharma Packaging Industry Revenue Million Forecast, by Material 2020 & 2033
- Table 33: Global Pharma Packaging Industry Revenue Million Forecast, by Product Type 2020 & 2033
- Table 34: Global Pharma Packaging Industry Revenue Million Forecast, by Country 2020 & 2033
- Table 35: United Arab Emirates Pharma Packaging Industry Revenue (Million) Forecast, by Application 2020 & 2033
- Table 36: Saudi Arabia Pharma Packaging Industry Revenue (Million) Forecast, by Application 2020 & 2033
- Table 37: South Africa Pharma Packaging Industry Revenue (Million) Forecast, by Application 2020 & 2033
- Table 38: Rest of Middle East and Africa Pharma Packaging Industry Revenue (Million) Forecast, by Application 2020 & 2033
Frequently Asked Questions
1. What is the projected Compound Annual Growth Rate (CAGR) of the Pharma Packaging Industry?
The projected CAGR is approximately 6.10%.
2. Which companies are prominent players in the Pharma Packaging Industry?
Key companies in the market include Becton Dickinson and Company, West Pharmaceutical Services Inc, WestRock Company, Klockner Pentaplast Group, Schott AG, Nipro Corporation*List Not Exhaustive, W L Gore & Associates Inc, AptarGroup Inc, Berry Global Group Inc, 3M Company, Vetter Pharma International GmbH, Amcor PLC, CCL Industries Inc, FlexiTuff International Ltd, Catalent Inc, McKesson Corporation, Gerresheimer AG.
3. What are the main segments of the Pharma Packaging Industry?
The market segments include Material, Product Type.
4. Can you provide details about the market size?
The market size is estimated to be USD 102.10 Million as of 2022.
5. What are some drivers contributing to market growth?
Regulatory Standards on Packaging and Stringent Norms against Counterfeit Products; Impact of Nanotechnology due to Innovative and New- generation Packaging Solutions.
6. What are the notable trends driving market growth?
Plastic Packaging Holds a Significant Market Share.
7. Are there any restraints impacting market growth?
Stringent Government Regulations in Developed Countries.
8. Can you provide examples of recent developments in the market?
January 2023: Amcor announced the acquisition of Shanghai-based MDK. MDK, a market leader in medical device packaging and a key priority growth area for Amcor, has annual sales of about USD 50 million. The addition of MDK will strengthen Amcor's already strong healthcare platform in the Asia-Pacific region as it continues to focus its emphasis on higher growth priority categories.
9. What pricing options are available for accessing the report?
Pricing options include single-user, multi-user, and enterprise licenses priced at USD 4750, USD 5250, and USD 8750 respectively.
10. Is the market size provided in terms of value or volume?
The market size is provided in terms of value, measured in Million.
11. Are there any specific market keywords associated with the report?
Yes, the market keyword associated with the report is "Pharma Packaging Industry," which aids in identifying and referencing the specific market segment covered.
12. How do I determine which pricing option suits my needs best?
The pricing options vary based on user requirements and access needs. Individual users may opt for single-user licenses, while businesses requiring broader access may choose multi-user or enterprise licenses for cost-effective access to the report.
13. Are there any additional resources or data provided in the Pharma Packaging Industry report?
While the report offers comprehensive insights, it's advisable to review the specific contents or supplementary materials provided to ascertain if additional resources or data are available.
14. How can I stay updated on further developments or reports in the Pharma Packaging Industry?
To stay informed about further developments, trends, and reports in the Pharma Packaging Industry, consider subscribing to industry newsletters, following relevant companies and organizations, or regularly checking reputable industry news sources and publications.
Methodology
Step 1 - Identification of Relevant Samples Size from Population Database


Step 2 - Approaches for Defining Global Market Size (Value, Volume* & Price*)

Note*: In applicable scenarios
Step 3 - Data Sources
Primary Research
- Web Analytics
- Survey Reports
- Research Institute
- Latest Research Reports
- Opinion Leaders
Secondary Research
- Annual Reports
- White Paper
- Latest Press Release
- Industry Association
- Paid Database
- Investor Presentations

Step 4 - Data Triangulation
Involves using different sources of information in order to increase the validity of a study
These sources are likely to be stakeholders in a program - participants, other researchers, program staff, other community members, and so on.
Then we put all data in single framework & apply various statistical tools to find out the dynamic on the market.
During the analysis stage, feedback from the stakeholder groups would be compared to determine areas of agreement as well as areas of divergence

