

Key Insights
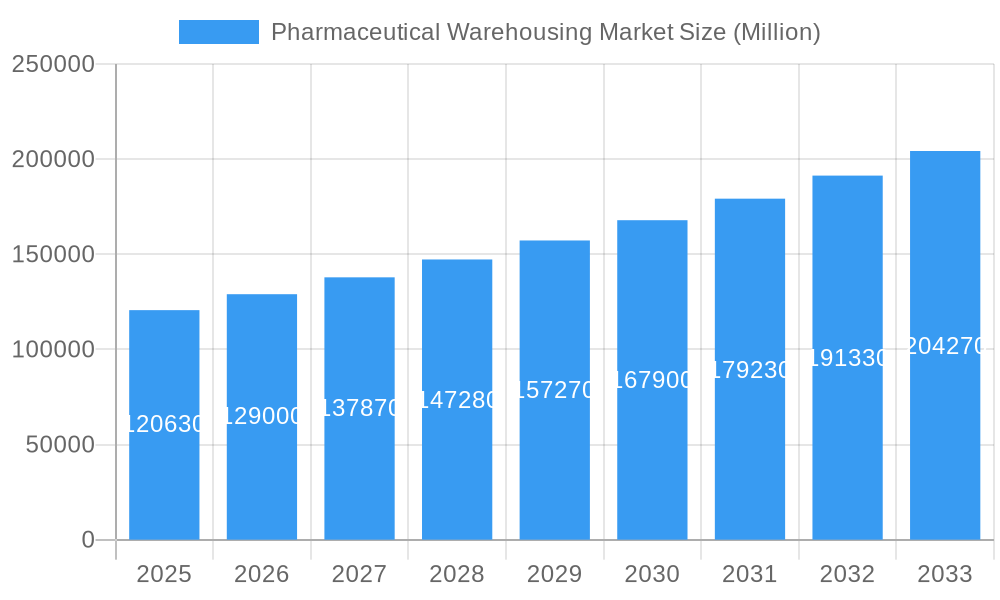
The global pharmaceutical warehousing market, valued at $120.63 billion in 2025, is projected to experience robust growth, driven by several key factors. The increasing demand for temperature-sensitive pharmaceutical products, stringent regulatory requirements for storage and handling, and the expansion of the pharmaceutical industry globally are major contributors to this market expansion. The rising prevalence of chronic diseases necessitates efficient and reliable warehousing solutions to ensure the timely delivery of life-saving medications. Furthermore, the growth of e-commerce in pharmaceuticals and the increasing adoption of advanced technologies like blockchain for supply chain management are further accelerating market growth. The market is segmented by warehouse type (cold chain and non-cold chain) and application (pharmaceutical factories, pharmacies, hospitals, and other applications). Cold chain warehousing, crucial for maintaining the efficacy of temperature-sensitive drugs, is expected to witness significant growth owing to its increasing adoption. Geographically, North America and Europe currently hold substantial market shares, but the Asia-Pacific region is anticipated to witness the highest growth rate due to burgeoning pharmaceutical manufacturing and increasing healthcare expenditure. The competitive landscape is characterized by both large multinational logistics companies and specialized pharmaceutical warehousing providers, leading to continuous innovation and service improvements within the sector.
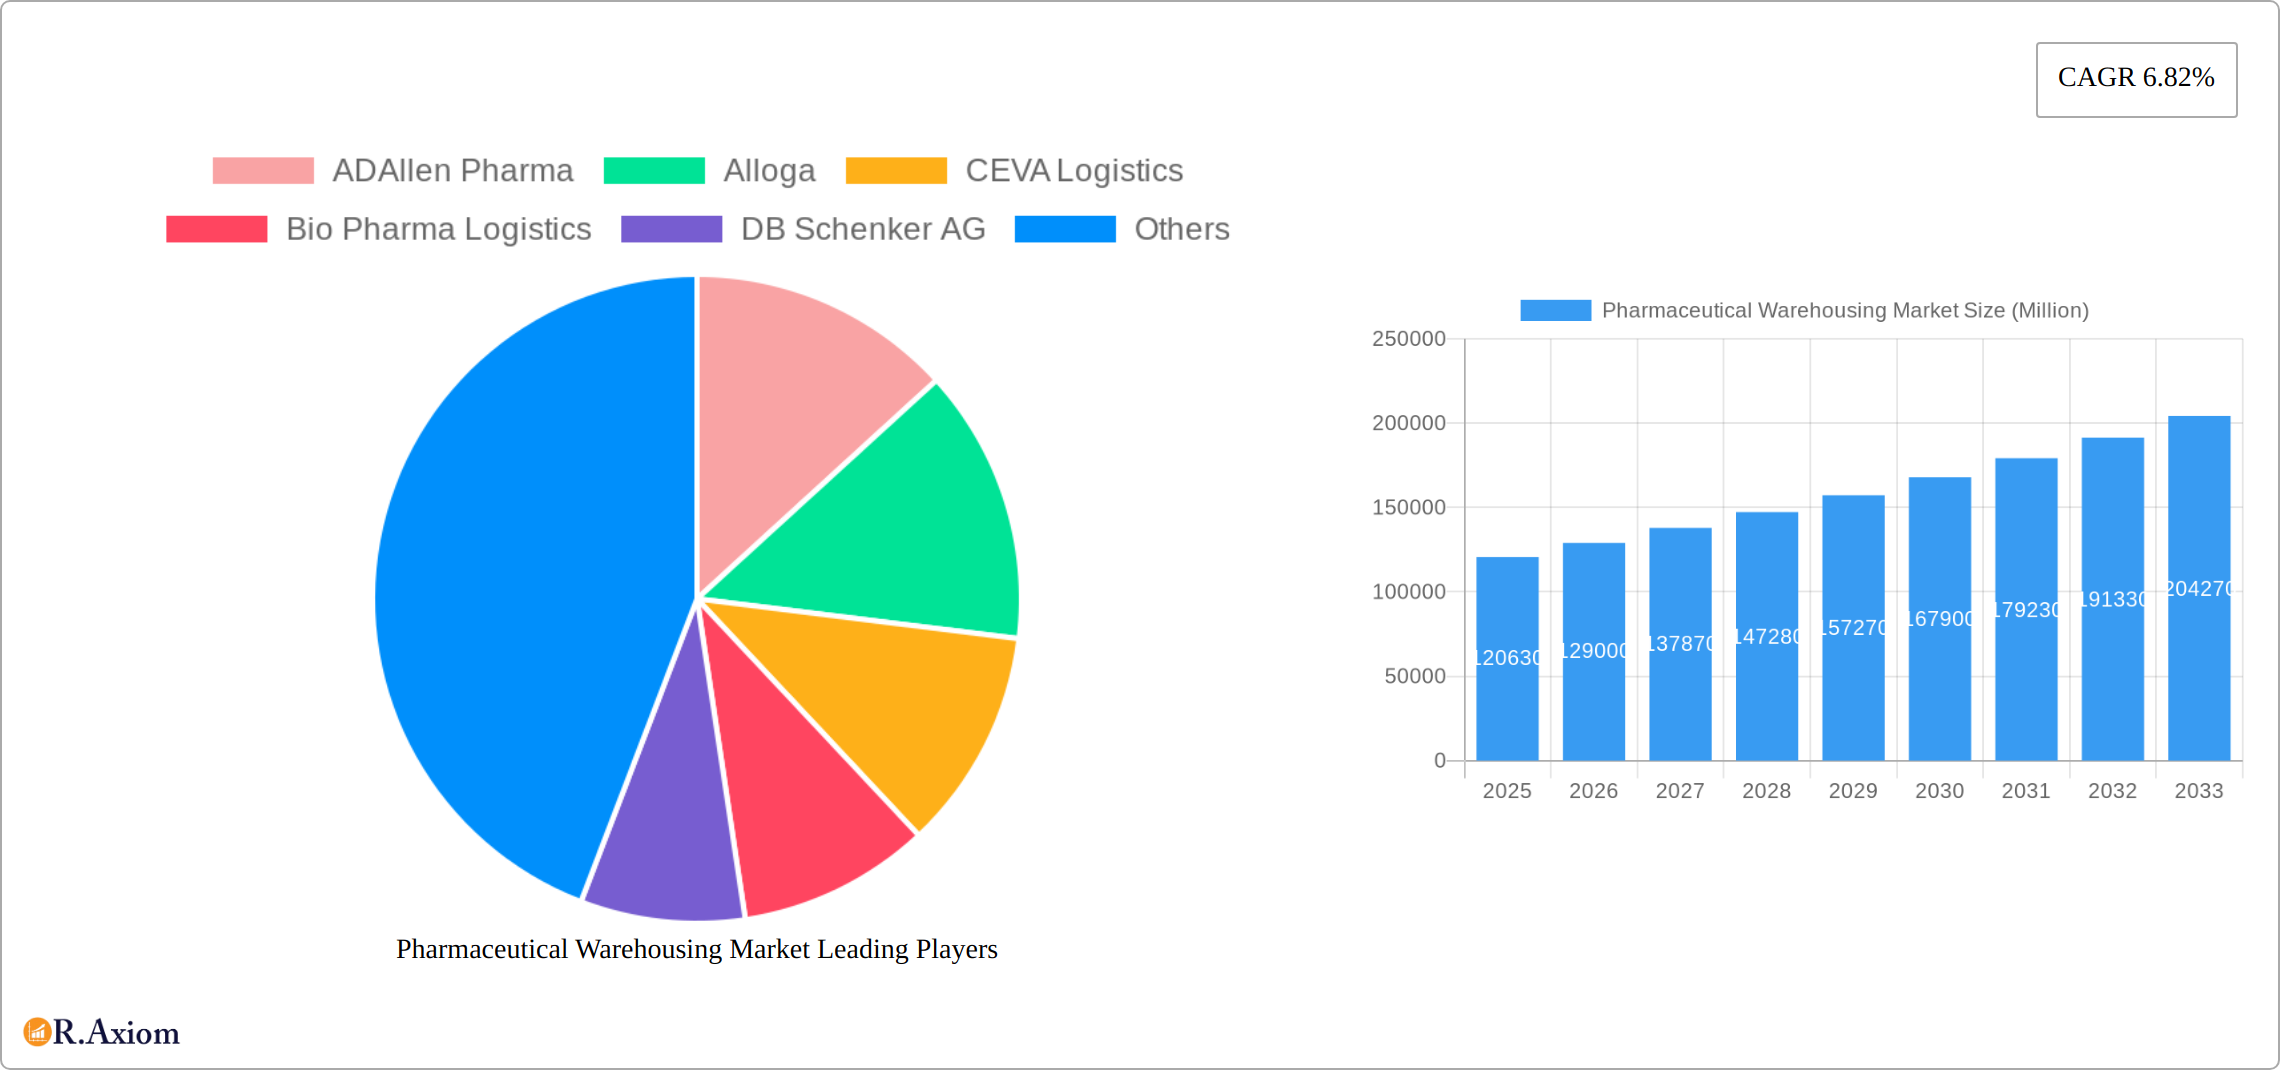
Pharmaceutical Warehousing Market Market Size (In Billion)
The forecast period (2025-2033) promises continued expansion, with a Compound Annual Growth Rate (CAGR) of 6.82%. However, challenges such as high infrastructure costs, stringent regulatory compliance, and the risk of product spoilage remain. Companies are actively investing in advanced technologies and efficient logistics solutions to overcome these hurdles. The increasing adoption of automation, including robotics and AI-powered systems, is expected to enhance warehouse efficiency and reduce operational costs. This technological advancement is expected to further shape the market landscape in the coming years, favoring companies that embrace innovation and adapt to evolving market needs and regulatory standards. The market will likely see further consolidation as larger players acquire smaller companies, leading to a more concentrated competitive environment.
Pharmaceutical Warehousing Market Company Market Share
Pharmaceutical Warehousing Market: A Comprehensive Report (2019-2033)
This in-depth report provides a comprehensive analysis of the Pharmaceutical Warehousing Market, encompassing market size, growth drivers, challenges, and emerging opportunities from 2019 to 2033. The study covers key segments, competitive dynamics, and significant industry developments, offering invaluable insights for stakeholders across the pharmaceutical supply chain. The report utilizes data from the historical period (2019-2024), base year (2025), and estimated year (2025) to project market trends until 2033.
Pharmaceutical Warehousing Market Concentration & Innovation
The pharmaceutical warehousing market exhibits a moderately concentrated landscape, with several large players holding significant market share. However, the market also sees participation from numerous smaller regional players, leading to competitive pressure. Major players like CEVA Logistics, DB Schenker AG, and Rhenus SE & Co. drive innovation through investments in advanced technologies like automated systems and cold chain solutions. The market is heavily regulated, impacting infrastructure and operational costs. Substitute products are limited, reinforcing the importance of efficient and reliable warehousing solutions. The trend towards outsourcing logistics is fueling mergers and acquisitions (M&A) activities. For instance, while precise M&A deal values are unavailable (xx Million), several significant deals have shaped the market landscape in recent years. Key drivers of innovation include:
- Technological advancements: Automation, IoT, AI, and blockchain technologies are improving efficiency and traceability.
- Stringent regulatory compliance: Demand for GMP and GDP compliant facilities and practices is driving investments.
- Growing demand for cold chain logistics: The rise of biologics and other temperature-sensitive pharmaceuticals necessitates specialized warehousing solutions.
- Supply chain optimization: Companies are focusing on improving efficiency, reducing costs, and mitigating risks.
Pharmaceutical Warehousing Market Industry Trends & Insights
The Pharmaceutical Warehousing Market is experiencing robust growth, fueled by a confluence of factors. A projected CAGR of [Insert Updated CAGR]% during the forecast period (2025-2033) reflects this upward trajectory. This expansion is driven by several key forces: the escalating global demand for pharmaceuticals, the rising prevalence of chronic diseases necessitating increased medication distribution, the booming e-commerce sector within the pharmaceutical industry demanding faster delivery and enhanced logistics, and a growing preference for outsourcing logistics to specialized providers.
Technological advancements are significantly impacting the market. The adoption of automated guided vehicles (AGVs), sophisticated warehouse management systems (WMS), and other cutting-edge technologies is revolutionizing efficiency and productivity, optimizing processes, reducing errors, and minimizing operational costs. Simultaneously, evolving consumer preferences are pushing for faster delivery times and complete supply chain transparency, pressuring warehousing operators to adopt innovative solutions to meet these heightened expectations. This heightened demand creates a competitive landscape characterized by intense competition among established players and emerging entrants, leading to price pressures and driving a need for continuous innovation and differentiation.
Market penetration of advanced warehousing technologies is steadily increasing, with a projected [Insert Updated Penetration]% penetration rate by 2033, indicating a significant shift towards automation and technological integration across the sector. This technological leap promises to improve overall efficiency, accuracy, and security within pharmaceutical warehousing.
Dominant Markets & Segments in Pharmaceutical Warehousing Market
The North American region maintains its leading position in the pharmaceutical warehousing market, driven by robust pharmaceutical manufacturing capabilities and a strong regulatory framework. However, the Asia-Pacific region demonstrates remarkable potential for rapid growth, fueled by expanding healthcare infrastructure, a rising middle class with greater access to healthcare, and increasing pharmaceutical consumption in developing economies. This presents significant opportunities for investment and expansion within the region.
By Type:
- Cold Chain Warehousing: This segment remains dominant, reflecting the significant increase in demand for temperature-sensitive pharmaceuticals such as biologics, vaccines, and other specialized medications. Stringent regulatory requirements and the imperative to maintain product integrity across the cold chain are key drivers for this segment's growth. Advanced cold chain technologies continue to evolve, focusing on improved monitoring, predictive maintenance, and reduced energy consumption.
- Non-Cold Chain Warehousing: While not experiencing the same explosive growth as the cold chain segment, this segment enjoys steady growth due to the storage of non-temperature-sensitive pharmaceuticals, pharmaceutical supplies, and related products. This sector benefits from ongoing technological advancements, particularly in areas such as inventory management and order fulfillment.
By Application:
- Pharmaceutical Factories: This application segment continues to be the largest, driven by the necessity for efficient storage and handling of raw materials, intermediate products, and finished goods throughout the pharmaceutical manufacturing process. Improvements in warehouse layout, inventory optimization techniques, and automation are key to driving efficiency in this sector.
- Pharmacies: The flourishing retail pharmacy sector is fueling demand for smaller-scale, customized warehousing solutions, particularly those designed to support efficient inventory management and timely order fulfillment within a retail environment.
- Hospitals: Hospitals require specialized warehousing to manage medications, medical devices, and supplies efficiently and safely. This necessitates systems that support precise inventory tracking, controlled access, and compliance with stringent healthcare regulations.
- Other Applications: This includes research institutions, clinical trial sites, and distribution centers, each with unique warehousing needs that require specialized solutions and expertise.
Key drivers for regional dominance include robust healthcare infrastructure, supportive government policies, favorable economic conditions, technological advancements, and effective regulatory frameworks.
Pharmaceutical Warehousing Market Product Developments
Recent product developments focus on enhancing efficiency, safety, and compliance. This includes the introduction of automated systems, improved temperature monitoring and control, and advanced inventory management software. Companies are focusing on creating integrated logistics solutions that encompass warehousing, transportation, and distribution to streamline the supply chain. These innovations aim to improve traceability, reduce waste, and enhance the overall efficiency of pharmaceutical storage and handling.
Report Scope & Segmentation Analysis
This report provides a comprehensive analysis of the Pharmaceutical Warehousing market, segmented by type (Cold Chain Warehouse, Non-Cold Chain Warehouse) and application (Pharmaceutical Factory, Pharmacy, Hospital, Other Applications). Each segment is analyzed in detail, considering market size, growth projections, competitive dynamics, and key influencing factors. The cold chain warehouse segment is expected to continue its robust growth trajectory due to the increasing demand for temperature-sensitive pharmaceutical products, while the pharmaceutical factory application segment retains its dominant market share, primarily driven by the expanding pharmaceutical manufacturing sector.
Growth projections for each segment are based on a comprehensive analysis of market trends, technological advancements, and projected demand, taking into account regional variations and specific market dynamics. The competitive landscape within each segment is intricately shaped by a variety of factors, including service offerings, pricing strategies, technological capabilities, regulatory compliance, and supply chain management efficiency.
Key Drivers of Pharmaceutical Warehousing Market Growth
The pharmaceutical warehousing market is driven by several factors:
- Growing pharmaceutical industry: The global pharmaceutical industry is expanding rapidly, leading to increased demand for warehousing services.
- Increased demand for cold chain logistics: Temperature-sensitive pharmaceutical products require specialized cold chain warehousing.
- Technological advancements: Automation and digitalization are improving efficiency and reducing costs.
- Stringent regulatory compliance: Compliance requirements are driving investments in advanced warehousing solutions.
Challenges in the Pharmaceutical Warehousing Market Sector
Several challenges hinder market growth:
- High infrastructure costs: Establishing and maintaining pharmaceutical warehouses, especially cold chain facilities, is expensive.
- Stringent regulatory compliance: Meeting regulatory standards can be complex and costly.
- Supply chain disruptions: Global events and natural disasters can disrupt supply chains, impacting warehouse operations.
- Intense competition: The market is fragmented, with several players competing for market share.
Emerging Opportunities in Pharmaceutical Warehousing Market
Emerging opportunities include:
- Expansion into new markets: Developing economies offer significant growth potential.
- Adoption of advanced technologies: Automation, AI, and IoT offer opportunities for improving efficiency and reducing costs.
- Growth of e-commerce in pharmaceuticals: Online pharmacies are increasing demand for efficient last-mile delivery solutions.
- Focus on sustainability: Companies are looking for eco-friendly warehousing solutions.
Leading Players in the Pharmaceutical Warehousing Market Market
- ADAllen Pharma
- Alloga
- CEVA Logistics
- Bio Pharma Logistics
- DB Schenker AG
- Rhenus SE and Co
- TIBA
- Pulleyn Transport Ltd
- WH BOWKER LTD
- DACHSER Group SE
Key Developments in Pharmaceutical Warehousing Market Industry
- June 2023: Akums establishes a 70,186,56 sqm central warehousing facility in Haridwar, India, with Phase I encompassing 30,610.2 sq. mt built-up area and 28,215.61 sq. mt ground coverage, including 17 blocks for finished goods storage. This significantly expands warehousing capacity in the Haridwar area.
- September 2022: CEVA Logistics launches the Ceva Chill Hub, a 10,000-square-foot multi-temperature facility with 10,000 pallet positions across 7 chambers (-25°C to +16°C), offering complete logistics solutions from origin to last-mile delivery. This demonstrates investment in advanced cold chain solutions.
Strategic Outlook for Pharmaceutical Warehousing Market Market
The Pharmaceutical Warehousing Market is poised for sustained growth, driven by several key factors. Technological advancements continue to improve efficiency and streamline processes, while rising pharmaceutical demand, particularly in emerging markets, fuels expansion. The increasing need for secure, efficient, and compliant logistics solutions for temperature-sensitive products further strengthens the market outlook.
Significant opportunities exist for companies to capitalize on this growth. Expansion into emerging markets, leveraging cutting-edge technologies such as AI and blockchain, and adapting to the expanding e-commerce landscape within the pharmaceutical industry represent key strategic avenues for success. Companies that prioritize strategic partnerships, technological innovation, and optimized operational efficiency are best positioned to thrive in this dynamic and rapidly evolving market. A focus on building strong supply chains, ensuring regulatory compliance, and providing superior customer service is crucial for long-term success in the Pharmaceutical Warehousing Market.
Pharmaceutical Warehousing Market Segmentation
-
1. BY Type
- 1.1. Cold Chain Warehouse
- 1.2. Non-Cold Chain Warehouse
-
2. Application
- 2.1. Pharmaceutical Factory
- 2.2. Pharmacy
- 2.3. Hospital
- 2.4. Other Applications
Pharmaceutical Warehousing Market Segmentation By Geography
-
1. North America
- 1.1. USA
- 1.2. Canada
- 1.3. Mexico
- 1.4. Rest of the North America
-
2. Europe
- 2.1. Spain
- 2.2. Belgium
- 2.3. United Kingdom
- 2.4. Russia
- 2.5. Germany
- 2.6. France
- 2.7. Italy
- 2.8. Rest of Europe
-
3. Asia Pacific
- 3.1. Australia
- 3.2. China
- 3.3. India
- 3.4. Indonesia
- 3.5. Japan
- 3.6. Malaysia
- 3.7. Vietnam
- 3.8. Thailand
- 3.9. Rest of APAC
-
4. GCC
- 4.1. UAE
- 4.2. Saudi Arabia
- 4.3. Qatar
- 4.4. Rest of GCC
-
5. South America
- 5.1. Argentina
- 5.2. Brazil
- 5.3. Chile
- 5.4. Rest of South America
-
6. Africa
- 6.1. South Africa
- 6.2. Egypt
- 6.3. Rest of Africa
- 7. Rest of the World
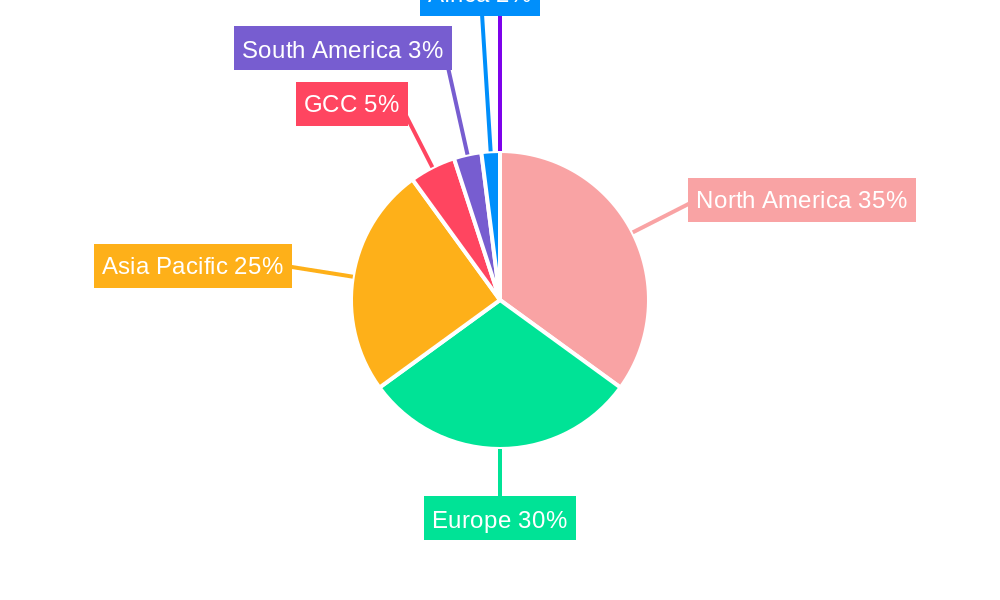
Pharmaceutical Warehousing Market Regional Market Share
Geographic Coverage of Pharmaceutical Warehousing Market
Pharmaceutical Warehousing Market REPORT HIGHLIGHTS
| Aspects | Details |
|---|---|
| Study Period | 2020-2034 |
| Base Year | 2025 |
| Estimated Year | 2026 |
| Forecast Period | 2026-2034 |
| Historical Period | 2020-2025 |
| Growth Rate | CAGR of 6.82% from 2020-2034 |
| Segmentation |
|
Table of Contents
- 1. Introduction
- 1.1. Research Scope
- 1.2. Market Segmentation
- 1.3. Research Objective
- 1.4. Definitions and Assumptions
- 2. Executive Summary
- 2.1. Market Snapshot
- 3. Market Dynamics
- 3.1. Market Drivers
- 3.2. Market Restrains
- 3.3. Market Trends
- 3.4. Market Opportunities
- 4. Market Factor Analysis
- 4.1. Porters Five Forces
- 4.1.1. Bargaining Power of Suppliers
- 4.1.2. Bargaining Power of Buyers
- 4.1.3. Threat of New Entrants
- 4.1.4. Threat of Substitutes
- 4.1.5. Competitive Rivalry
- 4.2. PESTEL analysis
- 4.3. BCG Analysis
- 4.3.1. Stars (High Growth, High Market Share)
- 4.3.2. Cash Cows (Low Growth, High Market Share)
- 4.3.3. Question Mark (High Growth, Low Market Share)
- 4.3.4. Dogs (Low Growth, Low Market Share)
- 4.4. Ansoff Matrix Analysis
- 4.5. Supply Chain Analysis
- 4.6. Regulatory Landscape
- 4.7. Current Market Potential and Opportunity Assessment (TAM–SAM–SOM Framework)
- 4.8. RAX Analyst Note
- 4.1. Porters Five Forces
- 5. Market Analysis, Insights and Forecast 2021-2033
- 5.1. Market Analysis, Insights and Forecast - by BY Type
- 5.1.1. Cold Chain Warehouse
- 5.1.2. Non-Cold Chain Warehouse
- 5.2. Market Analysis, Insights and Forecast - by Application
- 5.2.1. Pharmaceutical Factory
- 5.2.2. Pharmacy
- 5.2.3. Hospital
- 5.2.4. Other Applications
- 5.3. Market Analysis, Insights and Forecast - by Region
- 5.3.1. North America
- 5.3.2. Europe
- 5.3.3. Asia Pacific
- 5.3.4. GCC
- 5.3.5. South America
- 5.3.6. Africa
- 5.3.7. Rest of the World
- 5.1. Market Analysis, Insights and Forecast - by BY Type
- 6. Global Pharmaceutical Warehousing Market Analysis, Insights and Forecast, 2021-2033
- 6.1. Market Analysis, Insights and Forecast - by BY Type
- 6.1.1. Cold Chain Warehouse
- 6.1.2. Non-Cold Chain Warehouse
- 6.2. Market Analysis, Insights and Forecast - by Application
- 6.2.1. Pharmaceutical Factory
- 6.2.2. Pharmacy
- 6.2.3. Hospital
- 6.2.4. Other Applications
- 6.1. Market Analysis, Insights and Forecast - by BY Type
- 7. North America Pharmaceutical Warehousing Market Analysis, Insights and Forecast, 2020-2032
- 7.1. Market Analysis, Insights and Forecast - by BY Type
- 7.1.1. Cold Chain Warehouse
- 7.1.2. Non-Cold Chain Warehouse
- 7.2. Market Analysis, Insights and Forecast - by Application
- 7.2.1. Pharmaceutical Factory
- 7.2.2. Pharmacy
- 7.2.3. Hospital
- 7.2.4. Other Applications
- 7.1. Market Analysis, Insights and Forecast - by BY Type
- 8. Europe Pharmaceutical Warehousing Market Analysis, Insights and Forecast, 2020-2032
- 8.1. Market Analysis, Insights and Forecast - by BY Type
- 8.1.1. Cold Chain Warehouse
- 8.1.2. Non-Cold Chain Warehouse
- 8.2. Market Analysis, Insights and Forecast - by Application
- 8.2.1. Pharmaceutical Factory
- 8.2.2. Pharmacy
- 8.2.3. Hospital
- 8.2.4. Other Applications
- 8.1. Market Analysis, Insights and Forecast - by BY Type
- 9. Asia Pacific Pharmaceutical Warehousing Market Analysis, Insights and Forecast, 2020-2032
- 9.1. Market Analysis, Insights and Forecast - by BY Type
- 9.1.1. Cold Chain Warehouse
- 9.1.2. Non-Cold Chain Warehouse
- 9.2. Market Analysis, Insights and Forecast - by Application
- 9.2.1. Pharmaceutical Factory
- 9.2.2. Pharmacy
- 9.2.3. Hospital
- 9.2.4. Other Applications
- 9.1. Market Analysis, Insights and Forecast - by BY Type
- 10. GCC Pharmaceutical Warehousing Market Analysis, Insights and Forecast, 2020-2032
- 10.1. Market Analysis, Insights and Forecast - by BY Type
- 10.1.1. Cold Chain Warehouse
- 10.1.2. Non-Cold Chain Warehouse
- 10.2. Market Analysis, Insights and Forecast - by Application
- 10.2.1. Pharmaceutical Factory
- 10.2.2. Pharmacy
- 10.2.3. Hospital
- 10.2.4. Other Applications
- 10.1. Market Analysis, Insights and Forecast - by BY Type
- 11. South America Pharmaceutical Warehousing Market Analysis, Insights and Forecast, 2020-2032
- 11.1. Market Analysis, Insights and Forecast - by BY Type
- 11.1.1. Cold Chain Warehouse
- 11.1.2. Non-Cold Chain Warehouse
- 11.2. Market Analysis, Insights and Forecast - by Application
- 11.2.1. Pharmaceutical Factory
- 11.2.2. Pharmacy
- 11.2.3. Hospital
- 11.2.4. Other Applications
- 11.1. Market Analysis, Insights and Forecast - by BY Type
- 12. Africa Pharmaceutical Warehousing Market Analysis, Insights and Forecast, 2020-2032
- 12.1. Market Analysis, Insights and Forecast - by BY Type
- 12.1.1. Cold Chain Warehouse
- 12.1.2. Non-Cold Chain Warehouse
- 12.2. Market Analysis, Insights and Forecast - by Application
- 12.2.1. Pharmaceutical Factory
- 12.2.2. Pharmacy
- 12.2.3. Hospital
- 12.2.4. Other Applications
- 12.1. Market Analysis, Insights and Forecast - by BY Type
- 13. Rest of the World Pharmaceutical Warehousing Market Analysis, Insights and Forecast, 2020-2032
- 13.1. Market Analysis, Insights and Forecast - by BY Type
- 13.1.1. Cold Chain Warehouse
- 13.1.2. Non-Cold Chain Warehouse
- 13.2. Market Analysis, Insights and Forecast - by Application
- 13.2.1. Pharmaceutical Factory
- 13.2.2. Pharmacy
- 13.2.3. Hospital
- 13.2.4. Other Applications
- 13.1. Market Analysis, Insights and Forecast - by BY Type
- 14. Competitive Analysis
- 14.1. Company Profiles
- 14.1.1 ADAllen Pharma
- 14.1.1.1. Company Overview
- 14.1.1.2. Products
- 14.1.1.3. Company Financials
- 14.1.1.4. SWOT Analysis
- 14.1.2 Alloga
- 14.1.2.1. Company Overview
- 14.1.2.2. Products
- 14.1.2.3. Company Financials
- 14.1.2.4. SWOT Analysis
- 14.1.3 CEVA Logistics
- 14.1.3.1. Company Overview
- 14.1.3.2. Products
- 14.1.3.3. Company Financials
- 14.1.3.4. SWOT Analysis
- 14.1.4 Bio Pharma Logistics
- 14.1.4.1. Company Overview
- 14.1.4.2. Products
- 14.1.4.3. Company Financials
- 14.1.4.4. SWOT Analysis
- 14.1.5 DB Schenker AG
- 14.1.5.1. Company Overview
- 14.1.5.2. Products
- 14.1.5.3. Company Financials
- 14.1.5.4. SWOT Analysis
- 14.1.6 Rhenus SE and Co
- 14.1.6.1. Company Overview
- 14.1.6.2. Products
- 14.1.6.3. Company Financials
- 14.1.6.4. SWOT Analysis
- 14.1.7 TIBA
- 14.1.7.1. Company Overview
- 14.1.7.2. Products
- 14.1.7.3. Company Financials
- 14.1.7.4. SWOT Analysis
- 14.1.8 Pulleyn Transport Ltd
- 14.1.8.1. Company Overview
- 14.1.8.2. Products
- 14.1.8.3. Company Financials
- 14.1.8.4. SWOT Analysis
- 14.1.9 WH BOWKER LTD
- 14.1.9.1. Company Overview
- 14.1.9.2. Products
- 14.1.9.3. Company Financials
- 14.1.9.4. SWOT Analysis
- 14.1.10 DACHSER Group SE
- 14.1.10.1. Company Overview
- 14.1.10.2. Products
- 14.1.10.3. Company Financials
- 14.1.10.4. SWOT Analysis
- 14.1.1 ADAllen Pharma
- 14.2. Market Entropy
- 14.2.1 Company's Key Areas Served
- 14.2.2 Recent Developments
- 14.3. Company Market Share Analysis 2025
- 14.3.1 Top 5 Companies Market Share Analysis
- 14.3.2 Top 3 Companies Market Share Analysis
- 14.4. List of Potential Customers
- 15. Research Methodology
List of Figures
- Figure 1: Global Pharmaceutical Warehousing Market Revenue Breakdown (Million, %) by Region 2025 & 2033
- Figure 2: North America Pharmaceutical Warehousing Market Revenue (Million), by BY Type 2025 & 2033
- Figure 3: North America Pharmaceutical Warehousing Market Revenue Share (%), by BY Type 2025 & 2033
- Figure 4: North America Pharmaceutical Warehousing Market Revenue (Million), by Application 2025 & 2033
- Figure 5: North America Pharmaceutical Warehousing Market Revenue Share (%), by Application 2025 & 2033
- Figure 6: North America Pharmaceutical Warehousing Market Revenue (Million), by Country 2025 & 2033
- Figure 7: North America Pharmaceutical Warehousing Market Revenue Share (%), by Country 2025 & 2033
- Figure 8: Europe Pharmaceutical Warehousing Market Revenue (Million), by BY Type 2025 & 2033
- Figure 9: Europe Pharmaceutical Warehousing Market Revenue Share (%), by BY Type 2025 & 2033
- Figure 10: Europe Pharmaceutical Warehousing Market Revenue (Million), by Application 2025 & 2033
- Figure 11: Europe Pharmaceutical Warehousing Market Revenue Share (%), by Application 2025 & 2033
- Figure 12: Europe Pharmaceutical Warehousing Market Revenue (Million), by Country 2025 & 2033
- Figure 13: Europe Pharmaceutical Warehousing Market Revenue Share (%), by Country 2025 & 2033
- Figure 14: Asia Pacific Pharmaceutical Warehousing Market Revenue (Million), by BY Type 2025 & 2033
- Figure 15: Asia Pacific Pharmaceutical Warehousing Market Revenue Share (%), by BY Type 2025 & 2033
- Figure 16: Asia Pacific Pharmaceutical Warehousing Market Revenue (Million), by Application 2025 & 2033
- Figure 17: Asia Pacific Pharmaceutical Warehousing Market Revenue Share (%), by Application 2025 & 2033
- Figure 18: Asia Pacific Pharmaceutical Warehousing Market Revenue (Million), by Country 2025 & 2033
- Figure 19: Asia Pacific Pharmaceutical Warehousing Market Revenue Share (%), by Country 2025 & 2033
- Figure 20: GCC Pharmaceutical Warehousing Market Revenue (Million), by BY Type 2025 & 2033
- Figure 21: GCC Pharmaceutical Warehousing Market Revenue Share (%), by BY Type 2025 & 2033
- Figure 22: GCC Pharmaceutical Warehousing Market Revenue (Million), by Application 2025 & 2033
- Figure 23: GCC Pharmaceutical Warehousing Market Revenue Share (%), by Application 2025 & 2033
- Figure 24: GCC Pharmaceutical Warehousing Market Revenue (Million), by Country 2025 & 2033
- Figure 25: GCC Pharmaceutical Warehousing Market Revenue Share (%), by Country 2025 & 2033
- Figure 26: South America Pharmaceutical Warehousing Market Revenue (Million), by BY Type 2025 & 2033
- Figure 27: South America Pharmaceutical Warehousing Market Revenue Share (%), by BY Type 2025 & 2033
- Figure 28: South America Pharmaceutical Warehousing Market Revenue (Million), by Application 2025 & 2033
- Figure 29: South America Pharmaceutical Warehousing Market Revenue Share (%), by Application 2025 & 2033
- Figure 30: South America Pharmaceutical Warehousing Market Revenue (Million), by Country 2025 & 2033
- Figure 31: South America Pharmaceutical Warehousing Market Revenue Share (%), by Country 2025 & 2033
- Figure 32: Africa Pharmaceutical Warehousing Market Revenue (Million), by BY Type 2025 & 2033
- Figure 33: Africa Pharmaceutical Warehousing Market Revenue Share (%), by BY Type 2025 & 2033
- Figure 34: Africa Pharmaceutical Warehousing Market Revenue (Million), by Application 2025 & 2033
- Figure 35: Africa Pharmaceutical Warehousing Market Revenue Share (%), by Application 2025 & 2033
- Figure 36: Africa Pharmaceutical Warehousing Market Revenue (Million), by Country 2025 & 2033
- Figure 37: Africa Pharmaceutical Warehousing Market Revenue Share (%), by Country 2025 & 2033
- Figure 38: Rest of the World Pharmaceutical Warehousing Market Revenue (Million), by BY Type 2025 & 2033
- Figure 39: Rest of the World Pharmaceutical Warehousing Market Revenue Share (%), by BY Type 2025 & 2033
- Figure 40: Rest of the World Pharmaceutical Warehousing Market Revenue (Million), by Application 2025 & 2033
- Figure 41: Rest of the World Pharmaceutical Warehousing Market Revenue Share (%), by Application 2025 & 2033
- Figure 42: Rest of the World Pharmaceutical Warehousing Market Revenue (Million), by Country 2025 & 2033
- Figure 43: Rest of the World Pharmaceutical Warehousing Market Revenue Share (%), by Country 2025 & 2033
List of Tables
- Table 1: Global Pharmaceutical Warehousing Market Revenue Million Forecast, by BY Type 2020 & 2033
- Table 2: Global Pharmaceutical Warehousing Market Revenue Million Forecast, by Application 2020 & 2033
- Table 3: Global Pharmaceutical Warehousing Market Revenue Million Forecast, by Region 2020 & 2033
- Table 4: Global Pharmaceutical Warehousing Market Revenue Million Forecast, by BY Type 2020 & 2033
- Table 5: Global Pharmaceutical Warehousing Market Revenue Million Forecast, by Application 2020 & 2033
- Table 6: Global Pharmaceutical Warehousing Market Revenue Million Forecast, by Country 2020 & 2033
- Table 7: USA Pharmaceutical Warehousing Market Revenue (Million) Forecast, by Application 2020 & 2033
- Table 8: Canada Pharmaceutical Warehousing Market Revenue (Million) Forecast, by Application 2020 & 2033
- Table 9: Mexico Pharmaceutical Warehousing Market Revenue (Million) Forecast, by Application 2020 & 2033
- Table 10: Rest of the North America Pharmaceutical Warehousing Market Revenue (Million) Forecast, by Application 2020 & 2033
- Table 11: Global Pharmaceutical Warehousing Market Revenue Million Forecast, by BY Type 2020 & 2033
- Table 12: Global Pharmaceutical Warehousing Market Revenue Million Forecast, by Application 2020 & 2033
- Table 13: Global Pharmaceutical Warehousing Market Revenue Million Forecast, by Country 2020 & 2033
- Table 14: Spain Pharmaceutical Warehousing Market Revenue (Million) Forecast, by Application 2020 & 2033
- Table 15: Belgium Pharmaceutical Warehousing Market Revenue (Million) Forecast, by Application 2020 & 2033
- Table 16: United Kingdom Pharmaceutical Warehousing Market Revenue (Million) Forecast, by Application 2020 & 2033
- Table 17: Russia Pharmaceutical Warehousing Market Revenue (Million) Forecast, by Application 2020 & 2033
- Table 18: Germany Pharmaceutical Warehousing Market Revenue (Million) Forecast, by Application 2020 & 2033
- Table 19: France Pharmaceutical Warehousing Market Revenue (Million) Forecast, by Application 2020 & 2033
- Table 20: Italy Pharmaceutical Warehousing Market Revenue (Million) Forecast, by Application 2020 & 2033
- Table 21: Rest of Europe Pharmaceutical Warehousing Market Revenue (Million) Forecast, by Application 2020 & 2033
- Table 22: Global Pharmaceutical Warehousing Market Revenue Million Forecast, by BY Type 2020 & 2033
- Table 23: Global Pharmaceutical Warehousing Market Revenue Million Forecast, by Application 2020 & 2033
- Table 24: Global Pharmaceutical Warehousing Market Revenue Million Forecast, by Country 2020 & 2033
- Table 25: Australia Pharmaceutical Warehousing Market Revenue (Million) Forecast, by Application 2020 & 2033
- Table 26: China Pharmaceutical Warehousing Market Revenue (Million) Forecast, by Application 2020 & 2033
- Table 27: India Pharmaceutical Warehousing Market Revenue (Million) Forecast, by Application 2020 & 2033
- Table 28: Indonesia Pharmaceutical Warehousing Market Revenue (Million) Forecast, by Application 2020 & 2033
- Table 29: Japan Pharmaceutical Warehousing Market Revenue (Million) Forecast, by Application 2020 & 2033
- Table 30: Malaysia Pharmaceutical Warehousing Market Revenue (Million) Forecast, by Application 2020 & 2033
- Table 31: Vietnam Pharmaceutical Warehousing Market Revenue (Million) Forecast, by Application 2020 & 2033
- Table 32: Thailand Pharmaceutical Warehousing Market Revenue (Million) Forecast, by Application 2020 & 2033
- Table 33: Rest of APAC Pharmaceutical Warehousing Market Revenue (Million) Forecast, by Application 2020 & 2033
- Table 34: Global Pharmaceutical Warehousing Market Revenue Million Forecast, by BY Type 2020 & 2033
- Table 35: Global Pharmaceutical Warehousing Market Revenue Million Forecast, by Application 2020 & 2033
- Table 36: Global Pharmaceutical Warehousing Market Revenue Million Forecast, by Country 2020 & 2033
- Table 37: UAE Pharmaceutical Warehousing Market Revenue (Million) Forecast, by Application 2020 & 2033
- Table 38: Saudi Arabia Pharmaceutical Warehousing Market Revenue (Million) Forecast, by Application 2020 & 2033
- Table 39: Qatar Pharmaceutical Warehousing Market Revenue (Million) Forecast, by Application 2020 & 2033
- Table 40: Rest of GCC Pharmaceutical Warehousing Market Revenue (Million) Forecast, by Application 2020 & 2033
- Table 41: Global Pharmaceutical Warehousing Market Revenue Million Forecast, by BY Type 2020 & 2033
- Table 42: Global Pharmaceutical Warehousing Market Revenue Million Forecast, by Application 2020 & 2033
- Table 43: Global Pharmaceutical Warehousing Market Revenue Million Forecast, by Country 2020 & 2033
- Table 44: Argentina Pharmaceutical Warehousing Market Revenue (Million) Forecast, by Application 2020 & 2033
- Table 45: Brazil Pharmaceutical Warehousing Market Revenue (Million) Forecast, by Application 2020 & 2033
- Table 46: Chile Pharmaceutical Warehousing Market Revenue (Million) Forecast, by Application 2020 & 2033
- Table 47: Rest of South America Pharmaceutical Warehousing Market Revenue (Million) Forecast, by Application 2020 & 2033
- Table 48: Global Pharmaceutical Warehousing Market Revenue Million Forecast, by BY Type 2020 & 2033
- Table 49: Global Pharmaceutical Warehousing Market Revenue Million Forecast, by Application 2020 & 2033
- Table 50: Global Pharmaceutical Warehousing Market Revenue Million Forecast, by Country 2020 & 2033
- Table 51: South Africa Pharmaceutical Warehousing Market Revenue (Million) Forecast, by Application 2020 & 2033
- Table 52: Egypt Pharmaceutical Warehousing Market Revenue (Million) Forecast, by Application 2020 & 2033
- Table 53: Rest of Africa Pharmaceutical Warehousing Market Revenue (Million) Forecast, by Application 2020 & 2033
- Table 54: Global Pharmaceutical Warehousing Market Revenue Million Forecast, by BY Type 2020 & 2033
- Table 55: Global Pharmaceutical Warehousing Market Revenue Million Forecast, by Application 2020 & 2033
- Table 56: Global Pharmaceutical Warehousing Market Revenue Million Forecast, by Country 2020 & 2033
Frequently Asked Questions
1. What is the projected Compound Annual Growth Rate (CAGR) of the Pharmaceutical Warehousing Market?
The projected CAGR is approximately 6.82%.
2. Which companies are prominent players in the Pharmaceutical Warehousing Market?
Key companies in the market include ADAllen Pharma, Alloga, CEVA Logistics, Bio Pharma Logistics, DB Schenker AG, Rhenus SE and Co, TIBA, Pulleyn Transport Ltd, WH BOWKER LTD, DACHSER Group SE.
3. What are the main segments of the Pharmaceutical Warehousing Market?
The market segments include BY Type, Application.
4. Can you provide details about the market size?
The market size is estimated to be USD 120.63 Million as of 2022.
5. What are some drivers contributing to market growth?
4.; Rise In Population4.; Increase in Warehousing Services.
6. What are the notable trends driving market growth?
Technological Innovation is driving the market.
7. Are there any restraints impacting market growth?
4.; Shortage of Skilled Labor.
8. Can you provide examples of recent developments in the market?
June 2023: Akums set up a central warehousing facility in the Haridwar Industrial Estate. The facility will be situated on a 70,186,56 sqm campus and will be dedicated to warehousing finished goods. It will provide warehousing, handling, and services to various plants in and around the Haridwar area. Trained stores and logistics staff will support the different plants. Phase I of the project comprises a built-up area of 30,610,2 sq. mt and a ground coverage of 28,215,61 sq. mt. This phase includes 17 standalone blocks dedicated to storing Pharma's finished goods.
9. What pricing options are available for accessing the report?
Pricing options include single-user, multi-user, and enterprise licenses priced at USD 4750, USD 5250, and USD 8750 respectively.
10. Is the market size provided in terms of value or volume?
The market size is provided in terms of value, measured in Million.
11. Are there any specific market keywords associated with the report?
Yes, the market keyword associated with the report is "Pharmaceutical Warehousing Market," which aids in identifying and referencing the specific market segment covered.
12. How do I determine which pricing option suits my needs best?
The pricing options vary based on user requirements and access needs. Individual users may opt for single-user licenses, while businesses requiring broader access may choose multi-user or enterprise licenses for cost-effective access to the report.
13. Are there any additional resources or data provided in the Pharmaceutical Warehousing Market report?
While the report offers comprehensive insights, it's advisable to review the specific contents or supplementary materials provided to ascertain if additional resources or data are available.
14. How can I stay updated on further developments or reports in the Pharmaceutical Warehousing Market?
To stay informed about further developments, trends, and reports in the Pharmaceutical Warehousing Market, consider subscribing to industry newsletters, following relevant companies and organizations, or regularly checking reputable industry news sources and publications.
Methodology
Step 1 - Identification of Relevant Samples Size from Population Database


Step 2 - Approaches for Defining Global Market Size (Value, Volume* & Price*)

Note*: In applicable scenarios
Step 3 - Data Sources
Primary Research
- Web Analytics
- Survey Reports
- Research Institute
- Latest Research Reports
- Opinion Leaders
Secondary Research
- Annual Reports
- White Paper
- Latest Press Release
- Industry Association
- Paid Database
- Investor Presentations

Step 4 - Data Triangulation
Involves using different sources of information in order to increase the validity of a study
These sources are likely to be stakeholders in a program - participants, other researchers, program staff, other community members, and so on.
Then we put all data in single framework & apply various statistical tools to find out the dynamic on the market.
During the analysis stage, feedback from the stakeholder groups would be compared to determine areas of agreement as well as areas of divergence