Key Insights
The Phosphate Esters market, valued at approximately 14.73 billion in 2025, is projected to experience robust growth, exhibiting a Compound Annual Growth Rate (CAGR) of 7.88% from 2025 to 2033. Key growth drivers include escalating demand for fire retardants in construction and electronics, and the increasing adoption of phosphate esters in lubricant formulations for automotive and industrial applications. Further expansion is driven by their use as surfactants and pesticides in agriculture and industry, alongside the growing need for efficient, environmentally conscious chemical solutions. The market is segmented by type (Triaryl Phosphate Esters, Trialkyl Phosphate Esters, Alkyl Aryl Phosphate Ester), base material (Alcohol Based, Ethoxylated Alcohol Based, Ethoxylated Phenol Based), and application (Fire Retardants, Lubricants, Pesticides, Surfactants, Oil Field Chemicals, Others). Leading companies such as Castrol, Solvay, and ExxonMobil are significant contributors through innovation and strategic alliances.
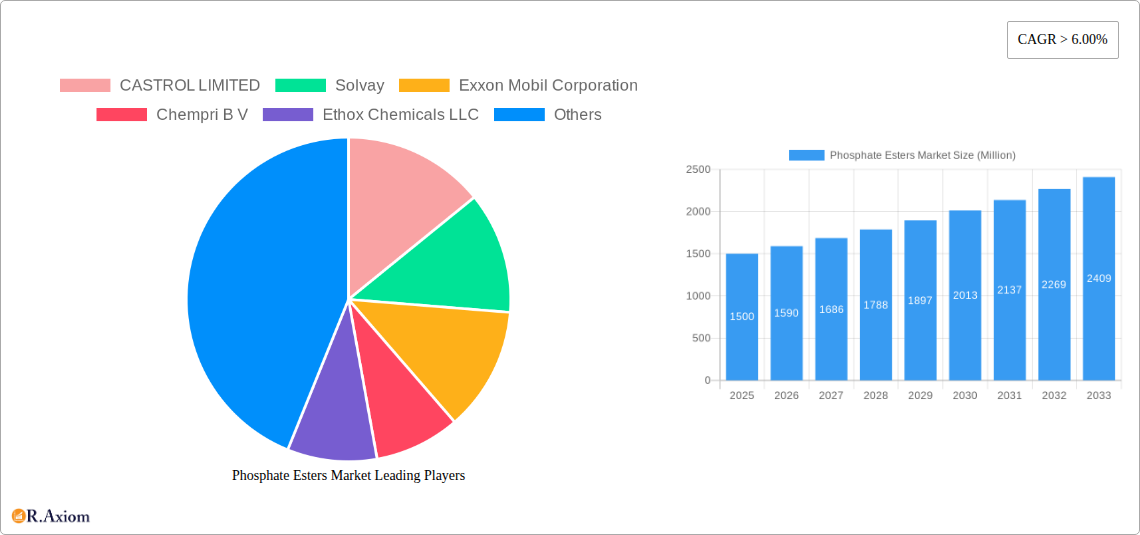
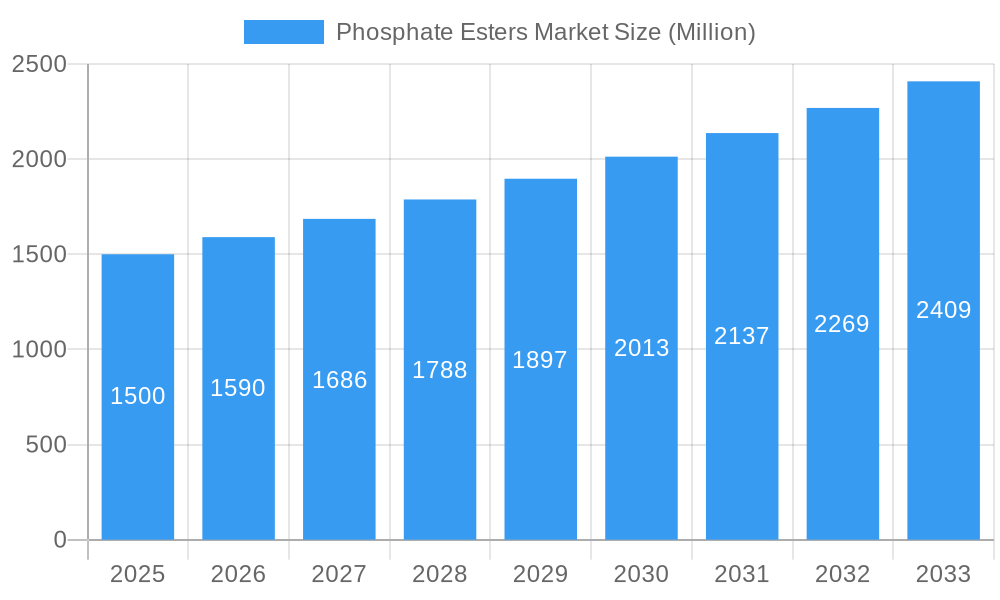
Phosphate Esters Market Market Size (In Billion)
Market growth faces constraints from regulatory scrutiny concerning the environmental impact of certain phosphate ester types, raw material price volatility, and potential supply chain disruptions. However, ongoing research into sustainable alternatives is expected to mitigate these challenges. The Asia-Pacific region, propelled by industrial expansion in China and India, is anticipated to dominate the market share, followed by North America and Europe. The competitive landscape is a dynamic mix of large corporations and specialized manufacturers, fostering innovation. The forecast period (2025-2033) indicates sustained market expansion and substantial growth in overall market size.
Phosphate Esters Market Company Market Share
Phosphate Esters Market: Analysis and Forecast (2025-2033)
This comprehensive report analyzes the Phosphate Esters market, covering market size, segmentation, growth drivers, challenges, and key players. The study includes historical data (up to 2024), the base year (2025), and detailed forecasts for 2025-2033. This report is essential for stakeholders, investors, and researchers seeking insights into this critical market's dynamics.
Phosphate Esters Market Concentration & Innovation
The Phosphate Esters market exhibits a moderately concentrated structure, with a few major players holding significant market share. CASTROL LIMITED, Solvay, Exxon Mobil Corporation, and Dow collectively account for an estimated xx% of the global market in 2025. Market concentration is influenced by factors such as economies of scale in production, established distribution networks, and strong brand recognition. Innovation within the sector is primarily driven by the need for enhanced performance characteristics, such as improved flame retardancy, lubricity, and biodegradability. Regulatory frameworks, particularly those focused on environmental protection and worker safety, are continuously evolving, shaping product development and market access. The increasing demand for eco-friendly alternatives is pushing innovation towards bio-based phosphate esters and sustainable manufacturing processes. Product substitution is a factor, with alternative flame retardants and lubricants emerging, although phosphate esters maintain a significant advantage in performance and cost in many applications. End-user trends, such as the increasing adoption of electric vehicles and renewable energy sources, influence demand for specific types of phosphate esters. M&A activities have played a role in consolidating market share; the past five years have seen xx deals valued at an estimated $xx Million, primarily focusing on acquiring smaller specialized players with unique technologies.
Phosphate Esters Market Industry Trends & Insights
The global Phosphate Esters market is experiencing steady growth, driven by increasing demand across diverse industries. The market is projected to achieve a CAGR of xx% during the forecast period (2025-2033), reaching an estimated value of $xx Million by 2033. Key growth drivers include the rising demand for fire retardants in construction, electronics, and transportation; expanding applications in lubricants for automotive, industrial, and hydraulic systems; and the continued use of phosphate esters as surfactants and pesticides. Technological advancements, such as the development of high-performance phosphate esters with improved thermal stability and reduced toxicity, are further fueling market growth. Consumer preferences are shifting towards environmentally friendly products, creating opportunities for manufacturers to develop and market bio-based or readily biodegradable phosphate esters. Competitive dynamics are characterized by intense competition among established players and the emergence of new entrants, particularly in the area of specialized and high-performance phosphate esters. Market penetration rates vary significantly across different applications, with high penetration in established applications like fire retardants and lubricants and moderate penetration in emerging applications such as oil field chemicals.
Dominant Markets & Segments in Phosphate Esters Market
The Asia-Pacific region is projected to dominate the Phosphate Esters market during the forecast period, driven by robust economic growth, rapid industrialization, and increasing infrastructure development. China and India are key growth markets within this region.
- Type: Triaryl Phosphate Esters is currently the leading segment in terms of volume and value, driven by its superior performance characteristics in fire-retardant applications. Trialkyl Phosphate Esters and Alkyl Aryl Phosphate Esters are anticipated to exhibit healthy growth rates.
- Base Material: Alcohol-based phosphate esters dominate the market due to their cost-effectiveness and widespread availability of raw materials. Ethoxylated alcohol-based and ethoxylated phenol-based esters are niche segments exhibiting above-average growth potential.
- Application: The fire retardants segment holds the largest market share due to stringent safety regulations and increasing construction activities. The lubricants segment is also significant, driven by the expanding automotive and industrial sectors. Growth is expected in the oil field chemicals and surfactants segments.
Key drivers for regional dominance include:
- Economic Policies: Favorable government policies promoting industrial growth and infrastructure development in Asia-Pacific are boosting demand.
- Infrastructure Development: Significant investments in infrastructure projects in developing economies create substantial demand for fire retardants and other Phosphate Esters applications.
Phosphate Esters Market Product Developments
Recent product innovations focus on developing phosphate esters with enhanced flame retardancy, improved lubricity, and reduced toxicity. This includes the development of bio-based phosphate esters derived from renewable resources. Companies are also investing in the development of specialized phosphate esters catering to specific industry needs, such as high-temperature applications in aerospace or improved biodegradability for environmental compliance. These advancements are improving market fit and competitive advantages by addressing environmental concerns and fulfilling stricter regulatory requirements.
Report Scope & Segmentation Analysis
This report segments the Phosphate Esters market based on Type (Triaryl Phosphate Esters, Trialkyl Phosphate Esters, Alkyl Aryl Phosphate Ester), Base Material (Alcohol Based, Ethoxylated Alcohol Based, Ethoxylated Phenol Based), and Application (Fire Retardants, Lubricants, Pesticides, Surfactants, Oil Field Chemical, Others). Each segment is analyzed in terms of its market size, growth rate, and competitive landscape, providing a detailed understanding of the market dynamics within each segment. Growth projections vary across segments, with the fire retardants and lubricant applications expecting consistent growth due to robust end-user demand. Competitive dynamics are influenced by the technological advancements and regulatory changes within each segment.
Key Drivers of Phosphate Esters Market Growth
The Phosphate Esters market is driven by several factors:
- Stringent Safety Regulations: Growing demand for fire retardants due to increasing safety concerns across various industries.
- Expanding Automotive Sector: The rising use of Phosphate Esters in automotive lubricants and hydraulic fluids.
- Infrastructure Development: Increased construction activities globally boost the demand for fire-retardant materials.
Challenges in the Phosphate Esters Market Sector
The Phosphate Esters market faces challenges including:
- Environmental Concerns: Stricter environmental regulations regarding the use of certain phosphate esters are impacting market growth.
- Price Volatility of Raw Materials: Fluctuations in the prices of raw materials, such as alcohols and phenols, affect profitability.
- Competition from Alternative Products: Emerging alternative flame retardants and lubricants pose a challenge to market share. The estimated impact of these challenges on overall market growth is a projected reduction in CAGR of xx% by 2033.
Emerging Opportunities in Phosphate Esters Market
Emerging opportunities include:
- Bio-Based Phosphate Esters: Growing demand for sustainable and environmentally friendly products drives the development of bio-based phosphate esters.
- High-Performance Applications: Opportunities exist in niche applications requiring high-performance phosphate esters with enhanced properties.
- Expansion into Developing Economies: Growing industrialization and infrastructure development in developing countries provide significant growth potential.
Leading Players in the Phosphate Esters Market
- CASTROL LIMITED
- Solvay
- Exxon Mobil Corporation
- Chempri B V
- Ethox Chemicals LLC
- Croda International Plc
- Ashland
- Dow
- Eastman Chemical Company
- Lakeland Laboratories Limited
- LANXESS Deutschland GmbH
- Kao Corporation
- Stepan Company
Key Developments in Phosphate Esters Market Industry
- January 2023: Solvay launched a new range of bio-based phosphate esters.
- March 2022: Dow and ExxonMobil announced a joint venture to develop advanced phosphate ester technologies.
- June 2021: Croda International acquired a small specialized phosphate ester manufacturer. (Further developments can be added here as they occur.)
Strategic Outlook for Phosphate Esters Market
The Phosphate Esters market is poised for continued growth, driven by increasing demand from key end-use sectors and the development of innovative products. Opportunities exist in expanding into new applications, developing sustainable and high-performance products, and penetrating emerging markets. Strategic partnerships and collaborations are likely to play a crucial role in shaping the future of the market. The focus on sustainability and regulatory compliance will continue to drive innovation and market evolution.
Phosphate Esters Market Segmentation
-
1. Type
- 1.1. Triaryl Phosphate Esters
- 1.2. Trialkyl Phosphate Esters
- 1.3. Alkyl Aryl Phosphate Ester
-
2. Base Material
- 2.1. Alcohol Based
- 2.2. Ethoxylated Alcohol Based
- 2.3. Ethoxylated Phenol Based
-
3. Application
- 3.1. Fire Retardants
- 3.2. Lubricants
- 3.3. Pesticides
- 3.4. Surfactants
- 3.5. Oil Field Chemical
- 3.6. Others
Phosphate Esters Market Segmentation By Geography
-
1. Asia Pacific
- 1.1. China
- 1.2. India
- 1.3. Japan
- 1.4. South Korea
- 1.5. Rest of Asia Pacific
-
2. North America
- 2.1. United States
- 2.2. Canada
- 2.3. Mexico
-
3. Europe
- 3.1. Germany
- 3.2. United Kingdom
- 3.3. France
- 3.4. Italy
- 3.5. Rest of Europe
-
4. South America
- 4.1. Brazil
- 4.2. Argentina
- 4.3. Rest of South America
-
5. Middle East and Africa
- 5.1. Saudi Arabia
- 5.2. South Africa
- 5.3. Rest of Middle East and Africa
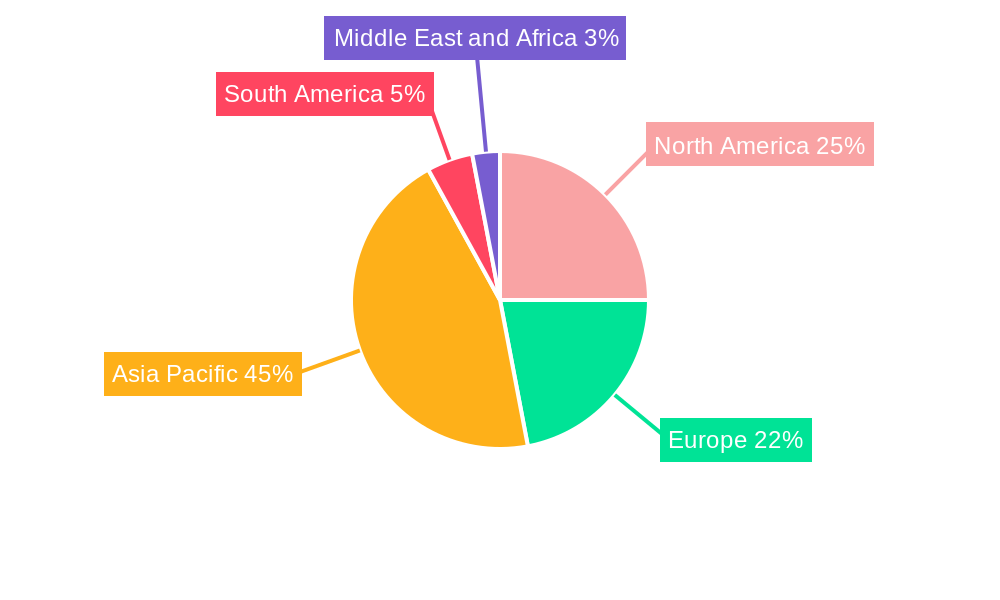
Phosphate Esters Market Regional Market Share
Geographic Coverage of Phosphate Esters Market
Phosphate Esters Market REPORT HIGHLIGHTS
| Aspects | Details |
|---|---|
| Study Period | 2020-2034 |
| Base Year | 2025 |
| Estimated Year | 2026 |
| Forecast Period | 2026-2034 |
| Historical Period | 2020-2025 |
| Growth Rate | CAGR of 7.88% from 2020-2034 |
| Segmentation |
|
Table of Contents
- 1. Introduction
- 1.1. Research Scope
- 1.2. Market Segmentation
- 1.3. Research Objective
- 1.4. Definitions and Assumptions
- 2. Executive Summary
- 2.1. Market Snapshot
- 3. Market Dynamics
- 3.1. Market Drivers
- 3.2. Market Restrains
- 3.3. Market Trends
- 3.4. Market Opportunities
- 4. Market Factor Analysis
- 4.1. Porters Five Forces
- 4.1.1. Bargaining Power of Suppliers
- 4.1.2. Bargaining Power of Buyers
- 4.1.3. Threat of New Entrants
- 4.1.4. Threat of Substitutes
- 4.1.5. Competitive Rivalry
- 4.2. PESTEL analysis
- 4.3. BCG Analysis
- 4.3.1. Stars (High Growth, High Market Share)
- 4.3.2. Cash Cows (Low Growth, High Market Share)
- 4.3.3. Question Mark (High Growth, Low Market Share)
- 4.3.4. Dogs (Low Growth, Low Market Share)
- 4.4. Ansoff Matrix Analysis
- 4.5. Supply Chain Analysis
- 4.6. Regulatory Landscape
- 4.7. Current Market Potential and Opportunity Assessment (TAM–SAM–SOM Framework)
- 4.8. RAX Analyst Note
- 4.1. Porters Five Forces
- 5. Market Analysis, Insights and Forecast 2021-2033
- 5.1. Market Analysis, Insights and Forecast - by Type
- 5.1.1. Triaryl Phosphate Esters
- 5.1.2. Trialkyl Phosphate Esters
- 5.1.3. Alkyl Aryl Phosphate Ester
- 5.2. Market Analysis, Insights and Forecast - by Base Material
- 5.2.1. Alcohol Based
- 5.2.2. Ethoxylated Alcohol Based
- 5.2.3. Ethoxylated Phenol Based
- 5.3. Market Analysis, Insights and Forecast - by Application
- 5.3.1. Fire Retardants
- 5.3.2. Lubricants
- 5.3.3. Pesticides
- 5.3.4. Surfactants
- 5.3.5. Oil Field Chemical
- 5.3.6. Others
- 5.4. Market Analysis, Insights and Forecast - by Region
- 5.4.1. Asia Pacific
- 5.4.2. North America
- 5.4.3. Europe
- 5.4.4. South America
- 5.4.5. Middle East and Africa
- 5.1. Market Analysis, Insights and Forecast - by Type
- 6. Global Phosphate Esters Market Analysis, Insights and Forecast, 2021-2033
- 6.1. Market Analysis, Insights and Forecast - by Type
- 6.1.1. Triaryl Phosphate Esters
- 6.1.2. Trialkyl Phosphate Esters
- 6.1.3. Alkyl Aryl Phosphate Ester
- 6.2. Market Analysis, Insights and Forecast - by Base Material
- 6.2.1. Alcohol Based
- 6.2.2. Ethoxylated Alcohol Based
- 6.2.3. Ethoxylated Phenol Based
- 6.3. Market Analysis, Insights and Forecast - by Application
- 6.3.1. Fire Retardants
- 6.3.2. Lubricants
- 6.3.3. Pesticides
- 6.3.4. Surfactants
- 6.3.5. Oil Field Chemical
- 6.3.6. Others
- 6.1. Market Analysis, Insights and Forecast - by Type
- 7. Asia Pacific Phosphate Esters Market Analysis, Insights and Forecast, 2020-2032
- 7.1. Market Analysis, Insights and Forecast - by Type
- 7.1.1. Triaryl Phosphate Esters
- 7.1.2. Trialkyl Phosphate Esters
- 7.1.3. Alkyl Aryl Phosphate Ester
- 7.2. Market Analysis, Insights and Forecast - by Base Material
- 7.2.1. Alcohol Based
- 7.2.2. Ethoxylated Alcohol Based
- 7.2.3. Ethoxylated Phenol Based
- 7.3. Market Analysis, Insights and Forecast - by Application
- 7.3.1. Fire Retardants
- 7.3.2. Lubricants
- 7.3.3. Pesticides
- 7.3.4. Surfactants
- 7.3.5. Oil Field Chemical
- 7.3.6. Others
- 7.1. Market Analysis, Insights and Forecast - by Type
- 8. North America Phosphate Esters Market Analysis, Insights and Forecast, 2020-2032
- 8.1. Market Analysis, Insights and Forecast - by Type
- 8.1.1. Triaryl Phosphate Esters
- 8.1.2. Trialkyl Phosphate Esters
- 8.1.3. Alkyl Aryl Phosphate Ester
- 8.2. Market Analysis, Insights and Forecast - by Base Material
- 8.2.1. Alcohol Based
- 8.2.2. Ethoxylated Alcohol Based
- 8.2.3. Ethoxylated Phenol Based
- 8.3. Market Analysis, Insights and Forecast - by Application
- 8.3.1. Fire Retardants
- 8.3.2. Lubricants
- 8.3.3. Pesticides
- 8.3.4. Surfactants
- 8.3.5. Oil Field Chemical
- 8.3.6. Others
- 8.1. Market Analysis, Insights and Forecast - by Type
- 9. Europe Phosphate Esters Market Analysis, Insights and Forecast, 2020-2032
- 9.1. Market Analysis, Insights and Forecast - by Type
- 9.1.1. Triaryl Phosphate Esters
- 9.1.2. Trialkyl Phosphate Esters
- 9.1.3. Alkyl Aryl Phosphate Ester
- 9.2. Market Analysis, Insights and Forecast - by Base Material
- 9.2.1. Alcohol Based
- 9.2.2. Ethoxylated Alcohol Based
- 9.2.3. Ethoxylated Phenol Based
- 9.3. Market Analysis, Insights and Forecast - by Application
- 9.3.1. Fire Retardants
- 9.3.2. Lubricants
- 9.3.3. Pesticides
- 9.3.4. Surfactants
- 9.3.5. Oil Field Chemical
- 9.3.6. Others
- 9.1. Market Analysis, Insights and Forecast - by Type
- 10. South America Phosphate Esters Market Analysis, Insights and Forecast, 2020-2032
- 10.1. Market Analysis, Insights and Forecast - by Type
- 10.1.1. Triaryl Phosphate Esters
- 10.1.2. Trialkyl Phosphate Esters
- 10.1.3. Alkyl Aryl Phosphate Ester
- 10.2. Market Analysis, Insights and Forecast - by Base Material
- 10.2.1. Alcohol Based
- 10.2.2. Ethoxylated Alcohol Based
- 10.2.3. Ethoxylated Phenol Based
- 10.3. Market Analysis, Insights and Forecast - by Application
- 10.3.1. Fire Retardants
- 10.3.2. Lubricants
- 10.3.3. Pesticides
- 10.3.4. Surfactants
- 10.3.5. Oil Field Chemical
- 10.3.6. Others
- 10.1. Market Analysis, Insights and Forecast - by Type
- 11. Middle East and Africa Phosphate Esters Market Analysis, Insights and Forecast, 2020-2032
- 11.1. Market Analysis, Insights and Forecast - by Type
- 11.1.1. Triaryl Phosphate Esters
- 11.1.2. Trialkyl Phosphate Esters
- 11.1.3. Alkyl Aryl Phosphate Ester
- 11.2. Market Analysis, Insights and Forecast - by Base Material
- 11.2.1. Alcohol Based
- 11.2.2. Ethoxylated Alcohol Based
- 11.2.3. Ethoxylated Phenol Based
- 11.3. Market Analysis, Insights and Forecast - by Application
- 11.3.1. Fire Retardants
- 11.3.2. Lubricants
- 11.3.3. Pesticides
- 11.3.4. Surfactants
- 11.3.5. Oil Field Chemical
- 11.3.6. Others
- 11.1. Market Analysis, Insights and Forecast - by Type
- 12. Competitive Analysis
- 12.1. Company Profiles
- 12.1.1 CASTROL LIMITED
- 12.1.1.1. Company Overview
- 12.1.1.2. Products
- 12.1.1.3. Company Financials
- 12.1.1.4. SWOT Analysis
- 12.1.2 Solvay
- 12.1.2.1. Company Overview
- 12.1.2.2. Products
- 12.1.2.3. Company Financials
- 12.1.2.4. SWOT Analysis
- 12.1.3 Exxon Mobil Corporation
- 12.1.3.1. Company Overview
- 12.1.3.2. Products
- 12.1.3.3. Company Financials
- 12.1.3.4. SWOT Analysis
- 12.1.4 Chempri B V
- 12.1.4.1. Company Overview
- 12.1.4.2. Products
- 12.1.4.3. Company Financials
- 12.1.4.4. SWOT Analysis
- 12.1.5 Ethox Chemicals LLC
- 12.1.5.1. Company Overview
- 12.1.5.2. Products
- 12.1.5.3. Company Financials
- 12.1.5.4. SWOT Analysis
- 12.1.6 Croda International Plc
- 12.1.6.1. Company Overview
- 12.1.6.2. Products
- 12.1.6.3. Company Financials
- 12.1.6.4. SWOT Analysis
- 12.1.7 Ashland
- 12.1.7.1. Company Overview
- 12.1.7.2. Products
- 12.1.7.3. Company Financials
- 12.1.7.4. SWOT Analysis
- 12.1.8 Dow
- 12.1.8.1. Company Overview
- 12.1.8.2. Products
- 12.1.8.3. Company Financials
- 12.1.8.4. SWOT Analysis
- 12.1.9 Eastman Chemical Company
- 12.1.9.1. Company Overview
- 12.1.9.2. Products
- 12.1.9.3. Company Financials
- 12.1.9.4. SWOT Analysis
- 12.1.10 Lakeland Laboratories Limited
- 12.1.10.1. Company Overview
- 12.1.10.2. Products
- 12.1.10.3. Company Financials
- 12.1.10.4. SWOT Analysis
- 12.1.11 LANXESS Deutschland GmbH
- 12.1.11.1. Company Overview
- 12.1.11.2. Products
- 12.1.11.3. Company Financials
- 12.1.11.4. SWOT Analysis
- 12.1.12 Kao Corporation
- 12.1.12.1. Company Overview
- 12.1.12.2. Products
- 12.1.12.3. Company Financials
- 12.1.12.4. SWOT Analysis
- 12.1.13 Stepan Company
- 12.1.13.1. Company Overview
- 12.1.13.2. Products
- 12.1.13.3. Company Financials
- 12.1.13.4. SWOT Analysis
- 12.1.1 CASTROL LIMITED
- 12.2. Market Entropy
- 12.2.1 Company's Key Areas Served
- 12.2.2 Recent Developments
- 12.3. Company Market Share Analysis 2025
- 12.3.1 Top 5 Companies Market Share Analysis
- 12.3.2 Top 3 Companies Market Share Analysis
- 12.4. List of Potential Customers
- 13. Research Methodology
List of Figures
- Figure 1: Global Phosphate Esters Market Revenue Breakdown (billion, %) by Region 2025 & 2033
- Figure 2: Global Phosphate Esters Market Volume Breakdown (K Tons, %) by Region 2025 & 2033
- Figure 3: Asia Pacific Phosphate Esters Market Revenue (billion), by Type 2025 & 2033
- Figure 4: Asia Pacific Phosphate Esters Market Volume (K Tons), by Type 2025 & 2033
- Figure 5: Asia Pacific Phosphate Esters Market Revenue Share (%), by Type 2025 & 2033
- Figure 6: Asia Pacific Phosphate Esters Market Volume Share (%), by Type 2025 & 2033
- Figure 7: Asia Pacific Phosphate Esters Market Revenue (billion), by Base Material 2025 & 2033
- Figure 8: Asia Pacific Phosphate Esters Market Volume (K Tons), by Base Material 2025 & 2033
- Figure 9: Asia Pacific Phosphate Esters Market Revenue Share (%), by Base Material 2025 & 2033
- Figure 10: Asia Pacific Phosphate Esters Market Volume Share (%), by Base Material 2025 & 2033
- Figure 11: Asia Pacific Phosphate Esters Market Revenue (billion), by Application 2025 & 2033
- Figure 12: Asia Pacific Phosphate Esters Market Volume (K Tons), by Application 2025 & 2033
- Figure 13: Asia Pacific Phosphate Esters Market Revenue Share (%), by Application 2025 & 2033
- Figure 14: Asia Pacific Phosphate Esters Market Volume Share (%), by Application 2025 & 2033
- Figure 15: Asia Pacific Phosphate Esters Market Revenue (billion), by Country 2025 & 2033
- Figure 16: Asia Pacific Phosphate Esters Market Volume (K Tons), by Country 2025 & 2033
- Figure 17: Asia Pacific Phosphate Esters Market Revenue Share (%), by Country 2025 & 2033
- Figure 18: Asia Pacific Phosphate Esters Market Volume Share (%), by Country 2025 & 2033
- Figure 19: North America Phosphate Esters Market Revenue (billion), by Type 2025 & 2033
- Figure 20: North America Phosphate Esters Market Volume (K Tons), by Type 2025 & 2033
- Figure 21: North America Phosphate Esters Market Revenue Share (%), by Type 2025 & 2033
- Figure 22: North America Phosphate Esters Market Volume Share (%), by Type 2025 & 2033
- Figure 23: North America Phosphate Esters Market Revenue (billion), by Base Material 2025 & 2033
- Figure 24: North America Phosphate Esters Market Volume (K Tons), by Base Material 2025 & 2033
- Figure 25: North America Phosphate Esters Market Revenue Share (%), by Base Material 2025 & 2033
- Figure 26: North America Phosphate Esters Market Volume Share (%), by Base Material 2025 & 2033
- Figure 27: North America Phosphate Esters Market Revenue (billion), by Application 2025 & 2033
- Figure 28: North America Phosphate Esters Market Volume (K Tons), by Application 2025 & 2033
- Figure 29: North America Phosphate Esters Market Revenue Share (%), by Application 2025 & 2033
- Figure 30: North America Phosphate Esters Market Volume Share (%), by Application 2025 & 2033
- Figure 31: North America Phosphate Esters Market Revenue (billion), by Country 2025 & 2033
- Figure 32: North America Phosphate Esters Market Volume (K Tons), by Country 2025 & 2033
- Figure 33: North America Phosphate Esters Market Revenue Share (%), by Country 2025 & 2033
- Figure 34: North America Phosphate Esters Market Volume Share (%), by Country 2025 & 2033
- Figure 35: Europe Phosphate Esters Market Revenue (billion), by Type 2025 & 2033
- Figure 36: Europe Phosphate Esters Market Volume (K Tons), by Type 2025 & 2033
- Figure 37: Europe Phosphate Esters Market Revenue Share (%), by Type 2025 & 2033
- Figure 38: Europe Phosphate Esters Market Volume Share (%), by Type 2025 & 2033
- Figure 39: Europe Phosphate Esters Market Revenue (billion), by Base Material 2025 & 2033
- Figure 40: Europe Phosphate Esters Market Volume (K Tons), by Base Material 2025 & 2033
- Figure 41: Europe Phosphate Esters Market Revenue Share (%), by Base Material 2025 & 2033
- Figure 42: Europe Phosphate Esters Market Volume Share (%), by Base Material 2025 & 2033
- Figure 43: Europe Phosphate Esters Market Revenue (billion), by Application 2025 & 2033
- Figure 44: Europe Phosphate Esters Market Volume (K Tons), by Application 2025 & 2033
- Figure 45: Europe Phosphate Esters Market Revenue Share (%), by Application 2025 & 2033
- Figure 46: Europe Phosphate Esters Market Volume Share (%), by Application 2025 & 2033
- Figure 47: Europe Phosphate Esters Market Revenue (billion), by Country 2025 & 2033
- Figure 48: Europe Phosphate Esters Market Volume (K Tons), by Country 2025 & 2033
- Figure 49: Europe Phosphate Esters Market Revenue Share (%), by Country 2025 & 2033
- Figure 50: Europe Phosphate Esters Market Volume Share (%), by Country 2025 & 2033
- Figure 51: South America Phosphate Esters Market Revenue (billion), by Type 2025 & 2033
- Figure 52: South America Phosphate Esters Market Volume (K Tons), by Type 2025 & 2033
- Figure 53: South America Phosphate Esters Market Revenue Share (%), by Type 2025 & 2033
- Figure 54: South America Phosphate Esters Market Volume Share (%), by Type 2025 & 2033
- Figure 55: South America Phosphate Esters Market Revenue (billion), by Base Material 2025 & 2033
- Figure 56: South America Phosphate Esters Market Volume (K Tons), by Base Material 2025 & 2033
- Figure 57: South America Phosphate Esters Market Revenue Share (%), by Base Material 2025 & 2033
- Figure 58: South America Phosphate Esters Market Volume Share (%), by Base Material 2025 & 2033
- Figure 59: South America Phosphate Esters Market Revenue (billion), by Application 2025 & 2033
- Figure 60: South America Phosphate Esters Market Volume (K Tons), by Application 2025 & 2033
- Figure 61: South America Phosphate Esters Market Revenue Share (%), by Application 2025 & 2033
- Figure 62: South America Phosphate Esters Market Volume Share (%), by Application 2025 & 2033
- Figure 63: South America Phosphate Esters Market Revenue (billion), by Country 2025 & 2033
- Figure 64: South America Phosphate Esters Market Volume (K Tons), by Country 2025 & 2033
- Figure 65: South America Phosphate Esters Market Revenue Share (%), by Country 2025 & 2033
- Figure 66: South America Phosphate Esters Market Volume Share (%), by Country 2025 & 2033
- Figure 67: Middle East and Africa Phosphate Esters Market Revenue (billion), by Type 2025 & 2033
- Figure 68: Middle East and Africa Phosphate Esters Market Volume (K Tons), by Type 2025 & 2033
- Figure 69: Middle East and Africa Phosphate Esters Market Revenue Share (%), by Type 2025 & 2033
- Figure 70: Middle East and Africa Phosphate Esters Market Volume Share (%), by Type 2025 & 2033
- Figure 71: Middle East and Africa Phosphate Esters Market Revenue (billion), by Base Material 2025 & 2033
- Figure 72: Middle East and Africa Phosphate Esters Market Volume (K Tons), by Base Material 2025 & 2033
- Figure 73: Middle East and Africa Phosphate Esters Market Revenue Share (%), by Base Material 2025 & 2033
- Figure 74: Middle East and Africa Phosphate Esters Market Volume Share (%), by Base Material 2025 & 2033
- Figure 75: Middle East and Africa Phosphate Esters Market Revenue (billion), by Application 2025 & 2033
- Figure 76: Middle East and Africa Phosphate Esters Market Volume (K Tons), by Application 2025 & 2033
- Figure 77: Middle East and Africa Phosphate Esters Market Revenue Share (%), by Application 2025 & 2033
- Figure 78: Middle East and Africa Phosphate Esters Market Volume Share (%), by Application 2025 & 2033
- Figure 79: Middle East and Africa Phosphate Esters Market Revenue (billion), by Country 2025 & 2033
- Figure 80: Middle East and Africa Phosphate Esters Market Volume (K Tons), by Country 2025 & 2033
- Figure 81: Middle East and Africa Phosphate Esters Market Revenue Share (%), by Country 2025 & 2033
- Figure 82: Middle East and Africa Phosphate Esters Market Volume Share (%), by Country 2025 & 2033
List of Tables
- Table 1: Global Phosphate Esters Market Revenue billion Forecast, by Type 2020 & 2033
- Table 2: Global Phosphate Esters Market Volume K Tons Forecast, by Type 2020 & 2033
- Table 3: Global Phosphate Esters Market Revenue billion Forecast, by Base Material 2020 & 2033
- Table 4: Global Phosphate Esters Market Volume K Tons Forecast, by Base Material 2020 & 2033
- Table 5: Global Phosphate Esters Market Revenue billion Forecast, by Application 2020 & 2033
- Table 6: Global Phosphate Esters Market Volume K Tons Forecast, by Application 2020 & 2033
- Table 7: Global Phosphate Esters Market Revenue billion Forecast, by Region 2020 & 2033
- Table 8: Global Phosphate Esters Market Volume K Tons Forecast, by Region 2020 & 2033
- Table 9: Global Phosphate Esters Market Revenue billion Forecast, by Type 2020 & 2033
- Table 10: Global Phosphate Esters Market Volume K Tons Forecast, by Type 2020 & 2033
- Table 11: Global Phosphate Esters Market Revenue billion Forecast, by Base Material 2020 & 2033
- Table 12: Global Phosphate Esters Market Volume K Tons Forecast, by Base Material 2020 & 2033
- Table 13: Global Phosphate Esters Market Revenue billion Forecast, by Application 2020 & 2033
- Table 14: Global Phosphate Esters Market Volume K Tons Forecast, by Application 2020 & 2033
- Table 15: Global Phosphate Esters Market Revenue billion Forecast, by Country 2020 & 2033
- Table 16: Global Phosphate Esters Market Volume K Tons Forecast, by Country 2020 & 2033
- Table 17: China Phosphate Esters Market Revenue (billion) Forecast, by Application 2020 & 2033
- Table 18: China Phosphate Esters Market Volume (K Tons) Forecast, by Application 2020 & 2033
- Table 19: India Phosphate Esters Market Revenue (billion) Forecast, by Application 2020 & 2033
- Table 20: India Phosphate Esters Market Volume (K Tons) Forecast, by Application 2020 & 2033
- Table 21: Japan Phosphate Esters Market Revenue (billion) Forecast, by Application 2020 & 2033
- Table 22: Japan Phosphate Esters Market Volume (K Tons) Forecast, by Application 2020 & 2033
- Table 23: South Korea Phosphate Esters Market Revenue (billion) Forecast, by Application 2020 & 2033
- Table 24: South Korea Phosphate Esters Market Volume (K Tons) Forecast, by Application 2020 & 2033
- Table 25: Rest of Asia Pacific Phosphate Esters Market Revenue (billion) Forecast, by Application 2020 & 2033
- Table 26: Rest of Asia Pacific Phosphate Esters Market Volume (K Tons) Forecast, by Application 2020 & 2033
- Table 27: Global Phosphate Esters Market Revenue billion Forecast, by Type 2020 & 2033
- Table 28: Global Phosphate Esters Market Volume K Tons Forecast, by Type 2020 & 2033
- Table 29: Global Phosphate Esters Market Revenue billion Forecast, by Base Material 2020 & 2033
- Table 30: Global Phosphate Esters Market Volume K Tons Forecast, by Base Material 2020 & 2033
- Table 31: Global Phosphate Esters Market Revenue billion Forecast, by Application 2020 & 2033
- Table 32: Global Phosphate Esters Market Volume K Tons Forecast, by Application 2020 & 2033
- Table 33: Global Phosphate Esters Market Revenue billion Forecast, by Country 2020 & 2033
- Table 34: Global Phosphate Esters Market Volume K Tons Forecast, by Country 2020 & 2033
- Table 35: United States Phosphate Esters Market Revenue (billion) Forecast, by Application 2020 & 2033
- Table 36: United States Phosphate Esters Market Volume (K Tons) Forecast, by Application 2020 & 2033
- Table 37: Canada Phosphate Esters Market Revenue (billion) Forecast, by Application 2020 & 2033
- Table 38: Canada Phosphate Esters Market Volume (K Tons) Forecast, by Application 2020 & 2033
- Table 39: Mexico Phosphate Esters Market Revenue (billion) Forecast, by Application 2020 & 2033
- Table 40: Mexico Phosphate Esters Market Volume (K Tons) Forecast, by Application 2020 & 2033
- Table 41: Global Phosphate Esters Market Revenue billion Forecast, by Type 2020 & 2033
- Table 42: Global Phosphate Esters Market Volume K Tons Forecast, by Type 2020 & 2033
- Table 43: Global Phosphate Esters Market Revenue billion Forecast, by Base Material 2020 & 2033
- Table 44: Global Phosphate Esters Market Volume K Tons Forecast, by Base Material 2020 & 2033
- Table 45: Global Phosphate Esters Market Revenue billion Forecast, by Application 2020 & 2033
- Table 46: Global Phosphate Esters Market Volume K Tons Forecast, by Application 2020 & 2033
- Table 47: Global Phosphate Esters Market Revenue billion Forecast, by Country 2020 & 2033
- Table 48: Global Phosphate Esters Market Volume K Tons Forecast, by Country 2020 & 2033
- Table 49: Germany Phosphate Esters Market Revenue (billion) Forecast, by Application 2020 & 2033
- Table 50: Germany Phosphate Esters Market Volume (K Tons) Forecast, by Application 2020 & 2033
- Table 51: United Kingdom Phosphate Esters Market Revenue (billion) Forecast, by Application 2020 & 2033
- Table 52: United Kingdom Phosphate Esters Market Volume (K Tons) Forecast, by Application 2020 & 2033
- Table 53: France Phosphate Esters Market Revenue (billion) Forecast, by Application 2020 & 2033
- Table 54: France Phosphate Esters Market Volume (K Tons) Forecast, by Application 2020 & 2033
- Table 55: Italy Phosphate Esters Market Revenue (billion) Forecast, by Application 2020 & 2033
- Table 56: Italy Phosphate Esters Market Volume (K Tons) Forecast, by Application 2020 & 2033
- Table 57: Rest of Europe Phosphate Esters Market Revenue (billion) Forecast, by Application 2020 & 2033
- Table 58: Rest of Europe Phosphate Esters Market Volume (K Tons) Forecast, by Application 2020 & 2033
- Table 59: Global Phosphate Esters Market Revenue billion Forecast, by Type 2020 & 2033
- Table 60: Global Phosphate Esters Market Volume K Tons Forecast, by Type 2020 & 2033
- Table 61: Global Phosphate Esters Market Revenue billion Forecast, by Base Material 2020 & 2033
- Table 62: Global Phosphate Esters Market Volume K Tons Forecast, by Base Material 2020 & 2033
- Table 63: Global Phosphate Esters Market Revenue billion Forecast, by Application 2020 & 2033
- Table 64: Global Phosphate Esters Market Volume K Tons Forecast, by Application 2020 & 2033
- Table 65: Global Phosphate Esters Market Revenue billion Forecast, by Country 2020 & 2033
- Table 66: Global Phosphate Esters Market Volume K Tons Forecast, by Country 2020 & 2033
- Table 67: Brazil Phosphate Esters Market Revenue (billion) Forecast, by Application 2020 & 2033
- Table 68: Brazil Phosphate Esters Market Volume (K Tons) Forecast, by Application 2020 & 2033
- Table 69: Argentina Phosphate Esters Market Revenue (billion) Forecast, by Application 2020 & 2033
- Table 70: Argentina Phosphate Esters Market Volume (K Tons) Forecast, by Application 2020 & 2033
- Table 71: Rest of South America Phosphate Esters Market Revenue (billion) Forecast, by Application 2020 & 2033
- Table 72: Rest of South America Phosphate Esters Market Volume (K Tons) Forecast, by Application 2020 & 2033
- Table 73: Global Phosphate Esters Market Revenue billion Forecast, by Type 2020 & 2033
- Table 74: Global Phosphate Esters Market Volume K Tons Forecast, by Type 2020 & 2033
- Table 75: Global Phosphate Esters Market Revenue billion Forecast, by Base Material 2020 & 2033
- Table 76: Global Phosphate Esters Market Volume K Tons Forecast, by Base Material 2020 & 2033
- Table 77: Global Phosphate Esters Market Revenue billion Forecast, by Application 2020 & 2033
- Table 78: Global Phosphate Esters Market Volume K Tons Forecast, by Application 2020 & 2033
- Table 79: Global Phosphate Esters Market Revenue billion Forecast, by Country 2020 & 2033
- Table 80: Global Phosphate Esters Market Volume K Tons Forecast, by Country 2020 & 2033
- Table 81: Saudi Arabia Phosphate Esters Market Revenue (billion) Forecast, by Application 2020 & 2033
- Table 82: Saudi Arabia Phosphate Esters Market Volume (K Tons) Forecast, by Application 2020 & 2033
- Table 83: South Africa Phosphate Esters Market Revenue (billion) Forecast, by Application 2020 & 2033
- Table 84: South Africa Phosphate Esters Market Volume (K Tons) Forecast, by Application 2020 & 2033
- Table 85: Rest of Middle East and Africa Phosphate Esters Market Revenue (billion) Forecast, by Application 2020 & 2033
- Table 86: Rest of Middle East and Africa Phosphate Esters Market Volume (K Tons) Forecast, by Application 2020 & 2033
Frequently Asked Questions
1. What is the projected Compound Annual Growth Rate (CAGR) of the Phosphate Esters Market?
The projected CAGR is approximately 7.88%.
2. Which companies are prominent players in the Phosphate Esters Market?
Key companies in the market include CASTROL LIMITED, Solvay, Exxon Mobil Corporation, Chempri B V, Ethox Chemicals LLC, Croda International Plc, Ashland, Dow, Eastman Chemical Company, Lakeland Laboratories Limited, LANXESS Deutschland GmbH, Kao Corporation, Stepan Company.
3. What are the main segments of the Phosphate Esters Market?
The market segments include Type, Base Material, Application.
4. Can you provide details about the market size?
The market size is estimated to be USD 14.73 billion as of 2022.
5. What are some drivers contributing to market growth?
; Growing Demand of Phosphate Esters as Fire Retardants; Other Drivers.
6. What are the notable trends driving market growth?
Growing Demand of Phosphate esters as Fire Retardants.
7. Are there any restraints impacting market growth?
; Government Restrictions on Usage of Phosphate Esters in Food; Impact of COVID - 19.
8. Can you provide examples of recent developments in the market?
N/A
9. What pricing options are available for accessing the report?
Pricing options include single-user, multi-user, and enterprise licenses priced at USD 4750, USD 5250, and USD 8750 respectively.
10. Is the market size provided in terms of value or volume?
The market size is provided in terms of value, measured in billion and volume, measured in K Tons.
11. Are there any specific market keywords associated with the report?
Yes, the market keyword associated with the report is "Phosphate Esters Market," which aids in identifying and referencing the specific market segment covered.
12. How do I determine which pricing option suits my needs best?
The pricing options vary based on user requirements and access needs. Individual users may opt for single-user licenses, while businesses requiring broader access may choose multi-user or enterprise licenses for cost-effective access to the report.
13. Are there any additional resources or data provided in the Phosphate Esters Market report?
While the report offers comprehensive insights, it's advisable to review the specific contents or supplementary materials provided to ascertain if additional resources or data are available.
14. How can I stay updated on further developments or reports in the Phosphate Esters Market?
To stay informed about further developments, trends, and reports in the Phosphate Esters Market, consider subscribing to industry newsletters, following relevant companies and organizations, or regularly checking reputable industry news sources and publications.
Methodology
Step 1 - Identification of Relevant Samples Size from Population Database


Step 2 - Approaches for Defining Global Market Size (Value, Volume* & Price*)

Note*: In applicable scenarios
Step 3 - Data Sources
Primary Research
- Web Analytics
- Survey Reports
- Research Institute
- Latest Research Reports
- Opinion Leaders
Secondary Research
- Annual Reports
- White Paper
- Latest Press Release
- Industry Association
- Paid Database
- Investor Presentations

Step 4 - Data Triangulation
Involves using different sources of information in order to increase the validity of a study
These sources are likely to be stakeholders in a program - participants, other researchers, program staff, other community members, and so on.
Then we put all data in single framework & apply various statistical tools to find out the dynamic on the market.
During the analysis stage, feedback from the stakeholder groups would be compared to determine areas of agreement as well as areas of divergence

