Key Insights
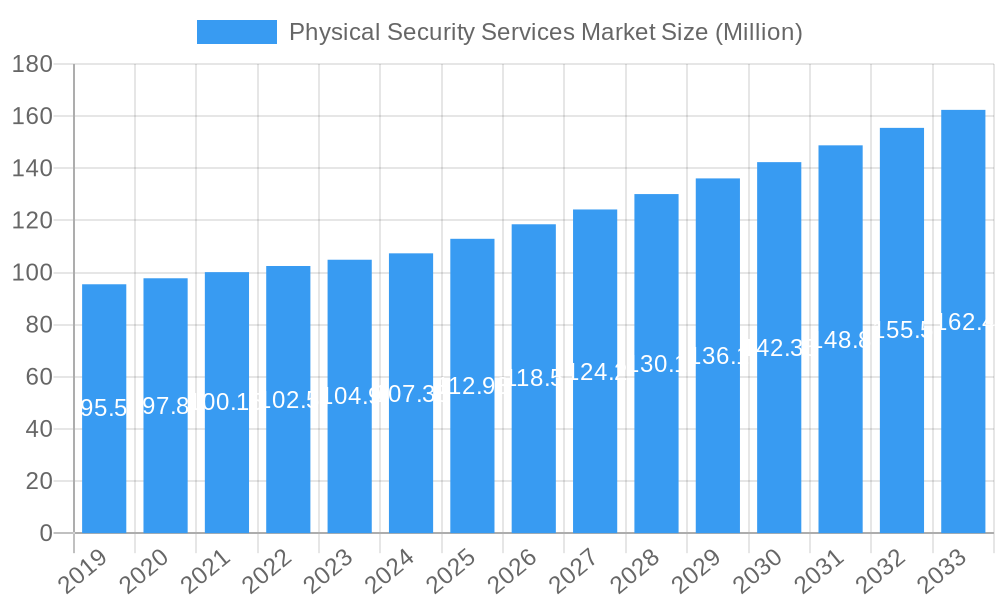
The global Physical Security Services Market is projected to experience robust growth, reaching an estimated market size of USD 112.93 million by 2025. This expansion is driven by an increasing demand for integrated security solutions across diverse industries, fueled by escalating security threats and the growing need to protect assets, personnel, and sensitive data. The market is anticipated to grow at a Compound Annual Growth Rate (CAGR) of 4.75% from 2019 to 2033, indicating a sustained upward trajectory. Key growth drivers include the rising adoption of advanced technologies such as AI-powered video surveillance, access control systems, and biometric authentication. Furthermore, the increasing complexity of security landscapes in sectors like manufacturing, industrial facilities, and public infrastructure necessitates sophisticated security services, contributing significantly to market expansion. The shift towards managed services, offering cost-effectiveness and specialized expertise, is also a prominent trend.
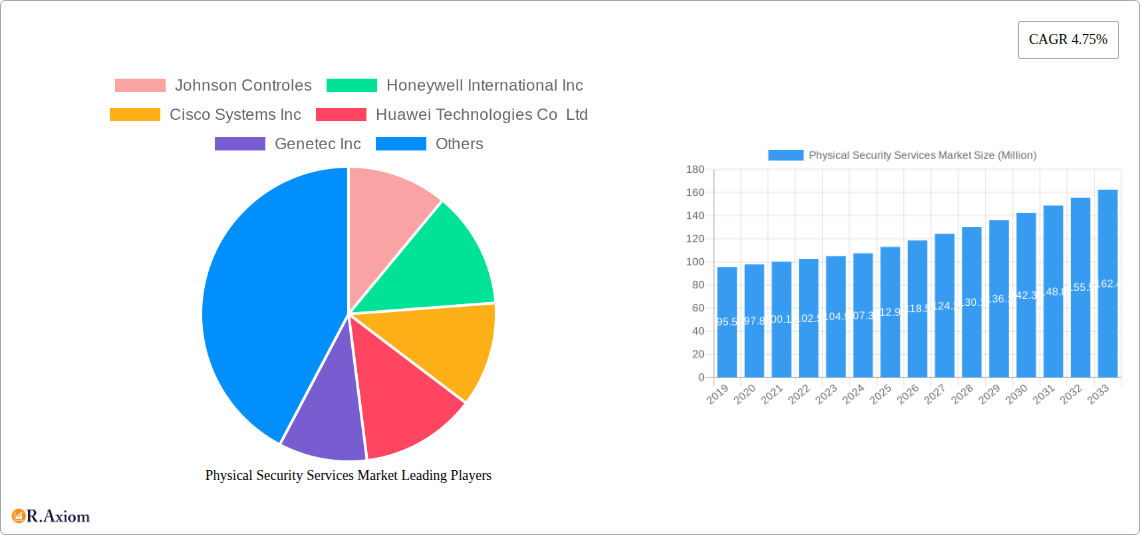
Physical Security Services Market Market Size (In Million)
Geographically, North America and Europe are expected to continue leading the market, owing to early adoption of advanced security technologies and stringent regulatory frameworks. However, the Asia Pacific region is poised for rapid growth, driven by increasing urbanization, industrialization, and a growing awareness of security imperatives. The market segmentation reveals a strong demand for both access control systems and video surveillance solutions, which are central to comprehensive physical security strategies. While growth is promising, certain restraints, such as high initial investment costs for advanced systems and concerns regarding data privacy, need to be addressed by market players. The competitive landscape features prominent companies like Johnson Controls, Honeywell International Inc., and Cisco Systems Inc., all actively innovating and expanding their service offerings to capture market share. The ongoing evolution of cybersecurity threats also indirectly boosts the physical security market as organizations seek holistic protection.
Physical Security Services Market Company Market Share
Physical Security Services Market: Comprehensive Report & Forecast (2019-2033)
This in-depth market report provides a comprehensive analysis of the global Physical Security Services Market, forecasting its trajectory from 2019 to 2033, with a base year of 2025. Covering critical aspects from market concentration and innovation to emerging opportunities and leading players, this report offers actionable insights for industry stakeholders, including security providers, technology developers, investors, and end-users. The study leverages high-traffic keywords to ensure maximum search visibility and engagement within the security technology sector.
Physical Security Services Market Market Concentration & Innovation
The Physical Security Services Market exhibits a dynamic concentration, with a blend of large, established global players and specialized regional providers. Innovation is a key driver, fueled by the increasing convergence of physical and cybersecurity, the adoption of AI and machine learning for threat detection, and the growing demand for integrated security solutions. Regulatory frameworks, such as data privacy laws and critical infrastructure protection mandates, are shaping market strategies and product development. Product substitutes, including advanced software solutions and DIY security systems, are influencing service offerings and pricing models. End-user trends are shifting towards proactive, predictive security and the demand for customizable, scalable solutions across diverse industries. Merger and acquisition (M&A) activities are prevalent as companies seek to expand their service portfolios, geographic reach, and technological capabilities. For instance, recent M&A deals have seen valuations in the range of several hundred million to over a billion dollars as larger entities absorb innovative startups to strengthen their competitive edge.
- Market Share: Dominated by key players, with significant regional variations.
- Innovation Drivers: AI, IoT integration, cloud-based solutions, predictive analytics.
- Regulatory Frameworks: GDPR, NIS2 Directive, national security standards.
- Product Substitutes: Advanced analytics software, open-source security platforms.
- End-User Trends: Demand for unified security management, remote monitoring, behavioral analytics.
- M&A Activities: Strategic acquisitions to enhance technological portfolios and market penetration.
Physical Security Services Market Industry Trends & Insights
The Physical Security Services Market is poised for significant growth, driven by a confluence of factors including rising global security concerns, increasing urbanization, and the escalating sophistication of threats. The estimated market size is projected to reach XX Million by 2033, with a Compound Annual Growth Rate (CAGR) of XX% during the forecast period of 2025–2033. Technological advancements are playing a pivotal role, with the integration of Artificial Intelligence (AI) and Machine Learning (ML) revolutionizing video analytics, enabling intelligent threat detection, facial recognition, and anomaly identification. The Internet of Things (IoT) is further enhancing security systems by facilitating seamless communication between devices and enabling remote monitoring and control. Consumer preferences are evolving towards integrated and smart security solutions that offer convenience, efficiency, and enhanced protection. This includes a growing demand for cloud-based platforms that allow for scalability, remote access, and easier management of security systems. Competitive dynamics are intensifying, with established players investing heavily in R&D to maintain their market positions and smaller, agile companies emerging with niche solutions. The focus is shifting from reactive security measures to proactive and predictive strategies, empowering organizations to anticipate and mitigate risks before they materialize. The increasing adoption of advanced technologies like drone surveillance, biometric access control, and sophisticated alarm systems are key indicators of this transformative phase. Furthermore, the growing awareness of the interconnectedness between physical and cybersecurity is driving demand for comprehensive solutions that address both domains, presenting a significant market opportunity for integrated service providers. The global market penetration of advanced physical security solutions is expected to rise substantially as organizations across all sectors prioritize robust security infrastructure.
Dominant Markets & Segments in Physical Security Services Market
The Physical Security Services Market is characterized by a dominant presence in specific regions and segments, driven by distinct economic, political, and technological factors. North America and Europe currently represent the largest markets, owing to robust economic development, stringent regulatory mandates, and a high level of technological adoption. Within these regions, the United States and Germany are leading countries due to significant investments in critical infrastructure protection and a mature security solutions market.
Component: By Solution The Video Surveillance System segment is a dominant force, driven by declining camera costs, advancements in resolution and analytics capabilities, and widespread application in public safety, retail, and enterprise security. Access Control Systems also hold a significant share, essential for managing entry and exit points across various industries.
- Access Control System: High demand from BFSI, IT & Telecom, and Public Infrastructure sectors for secure perimeter and internal access management.
- Video Surveillance System: Dominant due to AI-powered analytics, facial recognition, and integration with other security platforms.
- Security Scanning, Metal Detection, and Imaging: Critical for high-security environments like airports, government buildings, and large public venues.
- Fire and Life Safety: Essential for compliance and risk mitigation across all industries, with increasing integration of smart fire detection and suppression systems.
- Others: Includes guard tour systems, intercoms, and other specialized security hardware.
Component: By Service Type Managed Services are experiencing rapid growth, offering organizations cost-effectiveness, expertise, and the ability to focus on core competencies. Professional Services, including installation, integration, and consulting, remain crucial for initial deployment and complex project management.
- Professional Services: Essential for system design, installation, integration, and maintenance, particularly for large-scale and complex deployments.
- Managed Services: Growing preference for outsourcing security operations, monitoring, and maintenance, leading to significant market penetration.
End User Industry The Manufacturing and Industrial sector is a major consumer of physical security services, driven by the need to protect high-value assets, prevent intellectual property theft, and ensure operational continuity. The IT and Telecom sector also represents a significant market, requiring robust security for data centers and network infrastructure.
- Manufacturing and Industrial: High security needs for asset protection, supply chain integrity, and operational downtime prevention. Estimated market value of XX Million.
- IT and Telecom: Critical for data center security, network infrastructure protection, and remote site monitoring.
- BFSI (Banking, Financial Services, and Insurance): Driven by stringent regulatory compliance and the need to protect sensitive data and physical assets.
- Retail: Increasing adoption of video analytics for loss prevention, customer behavior analysis, and store safety.
- Residential: Growing demand for smart home security systems and integrated solutions.
- Public Infrastructure (Airports, etc.): Stringent security requirements for passenger safety, asset protection, and threat detection.
Physical Security Services Market Product Developments
Product development in the Physical Security Services Market is characterized by a strong emphasis on intelligent automation and integration. Innovations in AI-powered video analytics are enabling sophisticated threat detection and behavioral analysis, moving beyond simple surveillance. Biometric authentication systems, including facial and iris recognition, are becoming more accurate and widely adopted for enhanced access control. The convergence of physical security with cybersecurity is leading to integrated platforms that offer unified management of security threats. Furthermore, the development of more robust, weather-resistant, and remotely accessible security hardware is expanding the application scope of these services into diverse environments. These advancements provide a significant competitive advantage by offering enhanced security, operational efficiency, and predictive capabilities.
Report Scope & Segmentation Analysis
This report meticulously segments the Physical Security Services Market across key verticals. The Component analysis breaks down the market by Solution, including Access Control Systems (projected market size: XX Million), Video Surveillance Systems (XX Million), Security Scanning, Metal Detection, and Imaging (XX Million), Fire and Life Safety (XX Million), and Others (XX Million). Further segmentation by Service Type covers Professional Services (XX Million) and Managed Services (XX Million), with Managed Services expected to show higher growth. The End User Industry segmentation analyzes the market across Manufacturing and Industrial (XX Million), IT and Telecom (XX Million), BFSI (XX Million), Retail (XX Million), Residential (XX Million), Public Infrastructure (XX Million), and Other End Users (XX Million), with significant growth anticipated in Public Infrastructure and Residential sectors.
Key Drivers of Physical Security Services Market Growth
The Physical Security Services Market is propelled by several key drivers. Increasing global security concerns, ranging from terrorism and crime to industrial espionage, necessitate advanced security measures. The rapid proliferation of smart cities and the expansion of critical infrastructure, such as transportation hubs and energy facilities, demand sophisticated surveillance and access control systems. Technological advancements, particularly in Artificial Intelligence (AI), machine learning, and the Internet of Things (IoT), are enabling more intelligent, proactive, and integrated security solutions. Furthermore, evolving regulatory landscapes and compliance mandates across various industries are pushing organizations to invest in robust physical security services. The growing trend of remote work and the need for secure remote access also contribute to market expansion.
Challenges in the Physical Security Services Market Sector
Despite robust growth, the Physical Security Services Market faces several challenges. High initial implementation costs for advanced security systems can be a barrier for small and medium-sized enterprises. The increasing complexity of integrated security solutions requires skilled personnel for installation, maintenance, and operation, leading to a talent shortage. Concerns regarding data privacy and the potential for misuse of surveillance technologies can lead to public apprehension and regulatory scrutiny. Cybersecurity threats targeting physical security systems themselves present a significant risk. Additionally, fragmentation within the market, with numerous players offering specialized solutions, can make it challenging for end-users to find comprehensive and unified security platforms. Supply chain disruptions can also impact the availability and cost of essential security hardware.
Emerging Opportunities in Physical Security Services Market
Emerging opportunities in the Physical Security Services Market are driven by the continuous evolution of technology and changing societal needs. The growing demand for integrated cybersecurity and physical security solutions presents a significant avenue for growth, as organizations seek holistic risk management. The development of AI-powered predictive analytics for threat identification and anomaly detection is creating new service offerings. The expansion of the smart home market and the increasing adoption of connected devices are fueling demand for residential security solutions. Furthermore, the need for enhanced security in remote and harsh environments, such as offshore oil rigs and critical infrastructure in underserved regions, opens up new market segments. The development of cloud-based security platforms offering scalability and remote management is also a key emerging trend.
Leading Players in the Physical Security Services Market Market
- Johnson Controls
- Honeywell International Inc
- Cisco Systems Inc
- Huawei Technologies Co Ltd
- Genetec Inc
- G4S
- Securitas
- Secom
- Prosegur
- Brinks
- Loomis
- Allied Barton
- Garda
- Reliance
Key Developments in Physical Security Services Market Industry
- May 2024: ZKTeco East Africa partnered with Mart Networks Group Ltd at a security technology conference. ZKTecho showcased new products including time and attendance, access control, smart locks, and video surveillance management. The company also highlighted ZKDigimax for digital advertising and Armatura's physical security solutions.
- February 2024: ENSCO Inc. launched the Center for Critical Infrastructure Protection (CCIP), offering comprehensive cyber and physical security solutions. This initiative aims to deliver advanced security to the Department of Defense (DoD).
Strategic Outlook for Physical Security Services Market Market
The strategic outlook for the Physical Security Services Market remains highly optimistic, driven by the persistent and evolving nature of security threats and the rapid adoption of advanced technologies. The increasing convergence of physical and cybersecurity will continue to be a major growth catalyst, leading to demand for integrated platforms. Investments in AI and machine learning for predictive analytics and intelligent automation will define competitive advantage. The expansion of smart city initiatives and the ongoing need for robust protection of critical infrastructure will fuel significant market penetration. Service providers focusing on offering comprehensive, cloud-based, and customizable solutions will be well-positioned for sustained success. The market is poised for continued innovation, strategic partnerships, and M&A activities as companies aim to capture a larger share of this vital and expanding industry.
Physical Security Services Market Segmentation
-
1. Component
-
1.1. By Solution
- 1.1.1. Access Control System
- 1.1.2. Video Surveillance System
- 1.1.3. Security Scanning, Metal Detection, and Imaging
- 1.1.4. Fire and Life Safety
- 1.1.5. Others
-
1.2. By Service Type
- 1.2.1. Professional Services
- 1.2.2. Managed Services
-
1.1. By Solution
-
2. End User Industry
- 2.1. Manufacturing and Industrial
- 2.2. IT and Telecom
- 2.3. BFSI
- 2.4. Retail
- 2.5. Residential
- 2.6. Public Infrastructure (Airports, etc.)
- 2.7. Other End Users
Physical Security Services Market Segmentation By Geography
- 1. North America
- 2. Europe
- 3. Asia
- 4. Australia and New Zealand
- 5. Latin America
- 6. Middle East and Africa
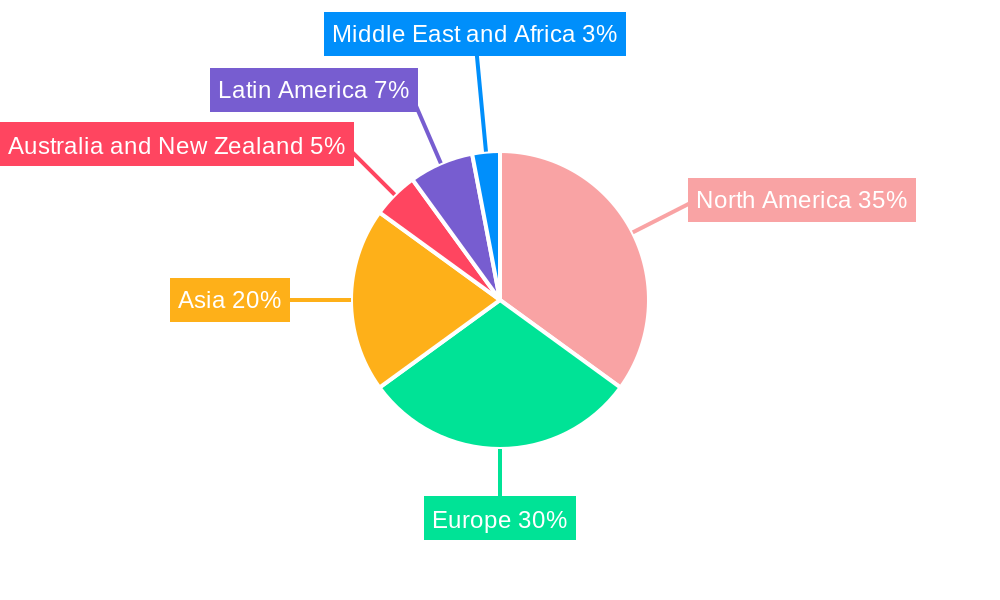
Physical Security Services Market Regional Market Share
Geographic Coverage of Physical Security Services Market
Physical Security Services Market REPORT HIGHLIGHTS
| Aspects | Details |
|---|---|
| Study Period | 2020-2034 |
| Base Year | 2025 |
| Estimated Year | 2026 |
| Forecast Period | 2026-2034 |
| Historical Period | 2020-2025 |
| Growth Rate | CAGR of 4.75% from 2020-2034 |
| Segmentation |
|
Table of Contents
- 1. Introduction
- 1.1. Research Scope
- 1.2. Market Segmentation
- 1.3. Research Objective
- 1.4. Definitions and Assumptions
- 2. Executive Summary
- 2.1. Market Snapshot
- 3. Market Dynamics
- 3.1. Market Drivers
- 3.2. Market Restrains
- 3.3. Market Trends
- 3.4. Market Opportunities
- 4. Market Factor Analysis
- 4.1. Porters Five Forces
- 4.1.1. Bargaining Power of Suppliers
- 4.1.2. Bargaining Power of Buyers
- 4.1.3. Threat of New Entrants
- 4.1.4. Threat of Substitutes
- 4.1.5. Competitive Rivalry
- 4.2. PESTEL analysis
- 4.3. BCG Analysis
- 4.3.1. Stars (High Growth, High Market Share)
- 4.3.2. Cash Cows (Low Growth, High Market Share)
- 4.3.3. Question Mark (High Growth, Low Market Share)
- 4.3.4. Dogs (Low Growth, Low Market Share)
- 4.4. Ansoff Matrix Analysis
- 4.5. Supply Chain Analysis
- 4.6. Regulatory Landscape
- 4.7. Current Market Potential and Opportunity Assessment (TAM–SAM–SOM Framework)
- 4.8. RAX Analyst Note
- 4.1. Porters Five Forces
- 5. Market Analysis, Insights and Forecast 2021-2033
- 5.1. Market Analysis, Insights and Forecast - by Component
- 5.1.1. By Solution
- 5.1.1.1. Access Control System
- 5.1.1.2. Video Surveillance System
- 5.1.1.3. Security Scanning, Metal Detection, and Imaging
- 5.1.1.4. Fire and Life Safety
- 5.1.1.5. Others
- 5.1.2. By Service Type
- 5.1.2.1. Professional Services
- 5.1.2.2. Managed Services
- 5.1.1. By Solution
- 5.2. Market Analysis, Insights and Forecast - by End User Industry
- 5.2.1. Manufacturing and Industrial
- 5.2.2. IT and Telecom
- 5.2.3. BFSI
- 5.2.4. Retail
- 5.2.5. Residential
- 5.2.6. Public Infrastructure (Airports, etc.)
- 5.2.7. Other End Users
- 5.3. Market Analysis, Insights and Forecast - by Region
- 5.3.1. North America
- 5.3.2. Europe
- 5.3.3. Asia
- 5.3.4. Australia and New Zealand
- 5.3.5. Latin America
- 5.3.6. Middle East and Africa
- 5.1. Market Analysis, Insights and Forecast - by Component
- 6. Global Physical Security Services Market Analysis, Insights and Forecast, 2021-2033
- 6.1. Market Analysis, Insights and Forecast - by Component
- 6.1.1. By Solution
- 6.1.1.1. Access Control System
- 6.1.1.2. Video Surveillance System
- 6.1.1.3. Security Scanning, Metal Detection, and Imaging
- 6.1.1.4. Fire and Life Safety
- 6.1.1.5. Others
- 6.1.2. By Service Type
- 6.1.2.1. Professional Services
- 6.1.2.2. Managed Services
- 6.1.1. By Solution
- 6.2. Market Analysis, Insights and Forecast - by End User Industry
- 6.2.1. Manufacturing and Industrial
- 6.2.2. IT and Telecom
- 6.2.3. BFSI
- 6.2.4. Retail
- 6.2.5. Residential
- 6.2.6. Public Infrastructure (Airports, etc.)
- 6.2.7. Other End Users
- 6.1. Market Analysis, Insights and Forecast - by Component
- 7. North America Physical Security Services Market Analysis, Insights and Forecast, 2020-2032
- 7.1. Market Analysis, Insights and Forecast - by Component
- 7.1.1. By Solution
- 7.1.1.1. Access Control System
- 7.1.1.2. Video Surveillance System
- 7.1.1.3. Security Scanning, Metal Detection, and Imaging
- 7.1.1.4. Fire and Life Safety
- 7.1.1.5. Others
- 7.1.2. By Service Type
- 7.1.2.1. Professional Services
- 7.1.2.2. Managed Services
- 7.1.1. By Solution
- 7.2. Market Analysis, Insights and Forecast - by End User Industry
- 7.2.1. Manufacturing and Industrial
- 7.2.2. IT and Telecom
- 7.2.3. BFSI
- 7.2.4. Retail
- 7.2.5. Residential
- 7.2.6. Public Infrastructure (Airports, etc.)
- 7.2.7. Other End Users
- 7.1. Market Analysis, Insights and Forecast - by Component
- 8. Europe Physical Security Services Market Analysis, Insights and Forecast, 2020-2032
- 8.1. Market Analysis, Insights and Forecast - by Component
- 8.1.1. By Solution
- 8.1.1.1. Access Control System
- 8.1.1.2. Video Surveillance System
- 8.1.1.3. Security Scanning, Metal Detection, and Imaging
- 8.1.1.4. Fire and Life Safety
- 8.1.1.5. Others
- 8.1.2. By Service Type
- 8.1.2.1. Professional Services
- 8.1.2.2. Managed Services
- 8.1.1. By Solution
- 8.2. Market Analysis, Insights and Forecast - by End User Industry
- 8.2.1. Manufacturing and Industrial
- 8.2.2. IT and Telecom
- 8.2.3. BFSI
- 8.2.4. Retail
- 8.2.5. Residential
- 8.2.6. Public Infrastructure (Airports, etc.)
- 8.2.7. Other End Users
- 8.1. Market Analysis, Insights and Forecast - by Component
- 9. Asia Physical Security Services Market Analysis, Insights and Forecast, 2020-2032
- 9.1. Market Analysis, Insights and Forecast - by Component
- 9.1.1. By Solution
- 9.1.1.1. Access Control System
- 9.1.1.2. Video Surveillance System
- 9.1.1.3. Security Scanning, Metal Detection, and Imaging
- 9.1.1.4. Fire and Life Safety
- 9.1.1.5. Others
- 9.1.2. By Service Type
- 9.1.2.1. Professional Services
- 9.1.2.2. Managed Services
- 9.1.1. By Solution
- 9.2. Market Analysis, Insights and Forecast - by End User Industry
- 9.2.1. Manufacturing and Industrial
- 9.2.2. IT and Telecom
- 9.2.3. BFSI
- 9.2.4. Retail
- 9.2.5. Residential
- 9.2.6. Public Infrastructure (Airports, etc.)
- 9.2.7. Other End Users
- 9.1. Market Analysis, Insights and Forecast - by Component
- 10. Australia and New Zealand Physical Security Services Market Analysis, Insights and Forecast, 2020-2032
- 10.1. Market Analysis, Insights and Forecast - by Component
- 10.1.1. By Solution
- 10.1.1.1. Access Control System
- 10.1.1.2. Video Surveillance System
- 10.1.1.3. Security Scanning, Metal Detection, and Imaging
- 10.1.1.4. Fire and Life Safety
- 10.1.1.5. Others
- 10.1.2. By Service Type
- 10.1.2.1. Professional Services
- 10.1.2.2. Managed Services
- 10.1.1. By Solution
- 10.2. Market Analysis, Insights and Forecast - by End User Industry
- 10.2.1. Manufacturing and Industrial
- 10.2.2. IT and Telecom
- 10.2.3. BFSI
- 10.2.4. Retail
- 10.2.5. Residential
- 10.2.6. Public Infrastructure (Airports, etc.)
- 10.2.7. Other End Users
- 10.1. Market Analysis, Insights and Forecast - by Component
- 11. Latin America Physical Security Services Market Analysis, Insights and Forecast, 2020-2032
- 11.1. Market Analysis, Insights and Forecast - by Component
- 11.1.1. By Solution
- 11.1.1.1. Access Control System
- 11.1.1.2. Video Surveillance System
- 11.1.1.3. Security Scanning, Metal Detection, and Imaging
- 11.1.1.4. Fire and Life Safety
- 11.1.1.5. Others
- 11.1.2. By Service Type
- 11.1.2.1. Professional Services
- 11.1.2.2. Managed Services
- 11.1.1. By Solution
- 11.2. Market Analysis, Insights and Forecast - by End User Industry
- 11.2.1. Manufacturing and Industrial
- 11.2.2. IT and Telecom
- 11.2.3. BFSI
- 11.2.4. Retail
- 11.2.5. Residential
- 11.2.6. Public Infrastructure (Airports, etc.)
- 11.2.7. Other End Users
- 11.1. Market Analysis, Insights and Forecast - by Component
- 12. Middle East and Africa Physical Security Services Market Analysis, Insights and Forecast, 2020-2032
- 12.1. Market Analysis, Insights and Forecast - by Component
- 12.1.1. By Solution
- 12.1.1.1. Access Control System
- 12.1.1.2. Video Surveillance System
- 12.1.1.3. Security Scanning, Metal Detection, and Imaging
- 12.1.1.4. Fire and Life Safety
- 12.1.1.5. Others
- 12.1.2. By Service Type
- 12.1.2.1. Professional Services
- 12.1.2.2. Managed Services
- 12.1.1. By Solution
- 12.2. Market Analysis, Insights and Forecast - by End User Industry
- 12.2.1. Manufacturing and Industrial
- 12.2.2. IT and Telecom
- 12.2.3. BFSI
- 12.2.4. Retail
- 12.2.5. Residential
- 12.2.6. Public Infrastructure (Airports, etc.)
- 12.2.7. Other End Users
- 12.1. Market Analysis, Insights and Forecast - by Component
- 13. Competitive Analysis
- 13.1. Company Profiles
- 13.1.1 Johnson Controles
- 13.1.1.1. Company Overview
- 13.1.1.2. Products
- 13.1.1.3. Company Financials
- 13.1.1.4. SWOT Analysis
- 13.1.2 Honeywell International Inc
- 13.1.2.1. Company Overview
- 13.1.2.2. Products
- 13.1.2.3. Company Financials
- 13.1.2.4. SWOT Analysis
- 13.1.3 Cisco Systems Inc
- 13.1.3.1. Company Overview
- 13.1.3.2. Products
- 13.1.3.3. Company Financials
- 13.1.3.4. SWOT Analysis
- 13.1.4 Huawei Technologies Co Ltd
- 13.1.4.1. Company Overview
- 13.1.4.2. Products
- 13.1.4.3. Company Financials
- 13.1.4.4. SWOT Analysis
- 13.1.5 Genetec Inc
- 13.1.5.1. Company Overview
- 13.1.5.2. Products
- 13.1.5.3. Company Financials
- 13.1.5.4. SWOT Analysis
- 13.1.6 G4S
- 13.1.6.1. Company Overview
- 13.1.6.2. Products
- 13.1.6.3. Company Financials
- 13.1.6.4. SWOT Analysis
- 13.1.7 Securitas
- 13.1.7.1. Company Overview
- 13.1.7.2. Products
- 13.1.7.3. Company Financials
- 13.1.7.4. SWOT Analysis
- 13.1.8 Secom
- 13.1.8.1. Company Overview
- 13.1.8.2. Products
- 13.1.8.3. Company Financials
- 13.1.8.4. SWOT Analysis
- 13.1.9 Prosegur
- 13.1.9.1. Company Overview
- 13.1.9.2. Products
- 13.1.9.3. Company Financials
- 13.1.9.4. SWOT Analysis
- 13.1.10 Brinks
- 13.1.10.1. Company Overview
- 13.1.10.2. Products
- 13.1.10.3. Company Financials
- 13.1.10.4. SWOT Analysis
- 13.1.11 Loomis
- 13.1.11.1. Company Overview
- 13.1.11.2. Products
- 13.1.11.3. Company Financials
- 13.1.11.4. SWOT Analysis
- 13.1.12 Allied Barton
- 13.1.12.1. Company Overview
- 13.1.12.2. Products
- 13.1.12.3. Company Financials
- 13.1.12.4. SWOT Analysis
- 13.1.13 Garda
- 13.1.13.1. Company Overview
- 13.1.13.2. Products
- 13.1.13.3. Company Financials
- 13.1.13.4. SWOT Analysis
- 13.1.14 Relianc
- 13.1.14.1. Company Overview
- 13.1.14.2. Products
- 13.1.14.3. Company Financials
- 13.1.14.4. SWOT Analysis
- 13.1.1 Johnson Controles
- 13.2. Market Entropy
- 13.2.1 Company's Key Areas Served
- 13.2.2 Recent Developments
- 13.3. Company Market Share Analysis 2025
- 13.3.1 Top 5 Companies Market Share Analysis
- 13.3.2 Top 3 Companies Market Share Analysis
- 13.4. List of Potential Customers
- 14. Research Methodology
List of Figures
- Figure 1: Global Physical Security Services Market Revenue Breakdown (Million, %) by Region 2025 & 2033
- Figure 2: Global Physical Security Services Market Volume Breakdown (Billion, %) by Region 2025 & 2033
- Figure 3: North America Physical Security Services Market Revenue (Million), by Component 2025 & 2033
- Figure 4: North America Physical Security Services Market Volume (Billion), by Component 2025 & 2033
- Figure 5: North America Physical Security Services Market Revenue Share (%), by Component 2025 & 2033
- Figure 6: North America Physical Security Services Market Volume Share (%), by Component 2025 & 2033
- Figure 7: North America Physical Security Services Market Revenue (Million), by End User Industry 2025 & 2033
- Figure 8: North America Physical Security Services Market Volume (Billion), by End User Industry 2025 & 2033
- Figure 9: North America Physical Security Services Market Revenue Share (%), by End User Industry 2025 & 2033
- Figure 10: North America Physical Security Services Market Volume Share (%), by End User Industry 2025 & 2033
- Figure 11: North America Physical Security Services Market Revenue (Million), by Country 2025 & 2033
- Figure 12: North America Physical Security Services Market Volume (Billion), by Country 2025 & 2033
- Figure 13: North America Physical Security Services Market Revenue Share (%), by Country 2025 & 2033
- Figure 14: North America Physical Security Services Market Volume Share (%), by Country 2025 & 2033
- Figure 15: Europe Physical Security Services Market Revenue (Million), by Component 2025 & 2033
- Figure 16: Europe Physical Security Services Market Volume (Billion), by Component 2025 & 2033
- Figure 17: Europe Physical Security Services Market Revenue Share (%), by Component 2025 & 2033
- Figure 18: Europe Physical Security Services Market Volume Share (%), by Component 2025 & 2033
- Figure 19: Europe Physical Security Services Market Revenue (Million), by End User Industry 2025 & 2033
- Figure 20: Europe Physical Security Services Market Volume (Billion), by End User Industry 2025 & 2033
- Figure 21: Europe Physical Security Services Market Revenue Share (%), by End User Industry 2025 & 2033
- Figure 22: Europe Physical Security Services Market Volume Share (%), by End User Industry 2025 & 2033
- Figure 23: Europe Physical Security Services Market Revenue (Million), by Country 2025 & 2033
- Figure 24: Europe Physical Security Services Market Volume (Billion), by Country 2025 & 2033
- Figure 25: Europe Physical Security Services Market Revenue Share (%), by Country 2025 & 2033
- Figure 26: Europe Physical Security Services Market Volume Share (%), by Country 2025 & 2033
- Figure 27: Asia Physical Security Services Market Revenue (Million), by Component 2025 & 2033
- Figure 28: Asia Physical Security Services Market Volume (Billion), by Component 2025 & 2033
- Figure 29: Asia Physical Security Services Market Revenue Share (%), by Component 2025 & 2033
- Figure 30: Asia Physical Security Services Market Volume Share (%), by Component 2025 & 2033
- Figure 31: Asia Physical Security Services Market Revenue (Million), by End User Industry 2025 & 2033
- Figure 32: Asia Physical Security Services Market Volume (Billion), by End User Industry 2025 & 2033
- Figure 33: Asia Physical Security Services Market Revenue Share (%), by End User Industry 2025 & 2033
- Figure 34: Asia Physical Security Services Market Volume Share (%), by End User Industry 2025 & 2033
- Figure 35: Asia Physical Security Services Market Revenue (Million), by Country 2025 & 2033
- Figure 36: Asia Physical Security Services Market Volume (Billion), by Country 2025 & 2033
- Figure 37: Asia Physical Security Services Market Revenue Share (%), by Country 2025 & 2033
- Figure 38: Asia Physical Security Services Market Volume Share (%), by Country 2025 & 2033
- Figure 39: Australia and New Zealand Physical Security Services Market Revenue (Million), by Component 2025 & 2033
- Figure 40: Australia and New Zealand Physical Security Services Market Volume (Billion), by Component 2025 & 2033
- Figure 41: Australia and New Zealand Physical Security Services Market Revenue Share (%), by Component 2025 & 2033
- Figure 42: Australia and New Zealand Physical Security Services Market Volume Share (%), by Component 2025 & 2033
- Figure 43: Australia and New Zealand Physical Security Services Market Revenue (Million), by End User Industry 2025 & 2033
- Figure 44: Australia and New Zealand Physical Security Services Market Volume (Billion), by End User Industry 2025 & 2033
- Figure 45: Australia and New Zealand Physical Security Services Market Revenue Share (%), by End User Industry 2025 & 2033
- Figure 46: Australia and New Zealand Physical Security Services Market Volume Share (%), by End User Industry 2025 & 2033
- Figure 47: Australia and New Zealand Physical Security Services Market Revenue (Million), by Country 2025 & 2033
- Figure 48: Australia and New Zealand Physical Security Services Market Volume (Billion), by Country 2025 & 2033
- Figure 49: Australia and New Zealand Physical Security Services Market Revenue Share (%), by Country 2025 & 2033
- Figure 50: Australia and New Zealand Physical Security Services Market Volume Share (%), by Country 2025 & 2033
- Figure 51: Latin America Physical Security Services Market Revenue (Million), by Component 2025 & 2033
- Figure 52: Latin America Physical Security Services Market Volume (Billion), by Component 2025 & 2033
- Figure 53: Latin America Physical Security Services Market Revenue Share (%), by Component 2025 & 2033
- Figure 54: Latin America Physical Security Services Market Volume Share (%), by Component 2025 & 2033
- Figure 55: Latin America Physical Security Services Market Revenue (Million), by End User Industry 2025 & 2033
- Figure 56: Latin America Physical Security Services Market Volume (Billion), by End User Industry 2025 & 2033
- Figure 57: Latin America Physical Security Services Market Revenue Share (%), by End User Industry 2025 & 2033
- Figure 58: Latin America Physical Security Services Market Volume Share (%), by End User Industry 2025 & 2033
- Figure 59: Latin America Physical Security Services Market Revenue (Million), by Country 2025 & 2033
- Figure 60: Latin America Physical Security Services Market Volume (Billion), by Country 2025 & 2033
- Figure 61: Latin America Physical Security Services Market Revenue Share (%), by Country 2025 & 2033
- Figure 62: Latin America Physical Security Services Market Volume Share (%), by Country 2025 & 2033
- Figure 63: Middle East and Africa Physical Security Services Market Revenue (Million), by Component 2025 & 2033
- Figure 64: Middle East and Africa Physical Security Services Market Volume (Billion), by Component 2025 & 2033
- Figure 65: Middle East and Africa Physical Security Services Market Revenue Share (%), by Component 2025 & 2033
- Figure 66: Middle East and Africa Physical Security Services Market Volume Share (%), by Component 2025 & 2033
- Figure 67: Middle East and Africa Physical Security Services Market Revenue (Million), by End User Industry 2025 & 2033
- Figure 68: Middle East and Africa Physical Security Services Market Volume (Billion), by End User Industry 2025 & 2033
- Figure 69: Middle East and Africa Physical Security Services Market Revenue Share (%), by End User Industry 2025 & 2033
- Figure 70: Middle East and Africa Physical Security Services Market Volume Share (%), by End User Industry 2025 & 2033
- Figure 71: Middle East and Africa Physical Security Services Market Revenue (Million), by Country 2025 & 2033
- Figure 72: Middle East and Africa Physical Security Services Market Volume (Billion), by Country 2025 & 2033
- Figure 73: Middle East and Africa Physical Security Services Market Revenue Share (%), by Country 2025 & 2033
- Figure 74: Middle East and Africa Physical Security Services Market Volume Share (%), by Country 2025 & 2033
List of Tables
- Table 1: Global Physical Security Services Market Revenue Million Forecast, by Component 2020 & 2033
- Table 2: Global Physical Security Services Market Volume Billion Forecast, by Component 2020 & 2033
- Table 3: Global Physical Security Services Market Revenue Million Forecast, by End User Industry 2020 & 2033
- Table 4: Global Physical Security Services Market Volume Billion Forecast, by End User Industry 2020 & 2033
- Table 5: Global Physical Security Services Market Revenue Million Forecast, by Region 2020 & 2033
- Table 6: Global Physical Security Services Market Volume Billion Forecast, by Region 2020 & 2033
- Table 7: Global Physical Security Services Market Revenue Million Forecast, by Component 2020 & 2033
- Table 8: Global Physical Security Services Market Volume Billion Forecast, by Component 2020 & 2033
- Table 9: Global Physical Security Services Market Revenue Million Forecast, by End User Industry 2020 & 2033
- Table 10: Global Physical Security Services Market Volume Billion Forecast, by End User Industry 2020 & 2033
- Table 11: Global Physical Security Services Market Revenue Million Forecast, by Country 2020 & 2033
- Table 12: Global Physical Security Services Market Volume Billion Forecast, by Country 2020 & 2033
- Table 13: Global Physical Security Services Market Revenue Million Forecast, by Component 2020 & 2033
- Table 14: Global Physical Security Services Market Volume Billion Forecast, by Component 2020 & 2033
- Table 15: Global Physical Security Services Market Revenue Million Forecast, by End User Industry 2020 & 2033
- Table 16: Global Physical Security Services Market Volume Billion Forecast, by End User Industry 2020 & 2033
- Table 17: Global Physical Security Services Market Revenue Million Forecast, by Country 2020 & 2033
- Table 18: Global Physical Security Services Market Volume Billion Forecast, by Country 2020 & 2033
- Table 19: Global Physical Security Services Market Revenue Million Forecast, by Component 2020 & 2033
- Table 20: Global Physical Security Services Market Volume Billion Forecast, by Component 2020 & 2033
- Table 21: Global Physical Security Services Market Revenue Million Forecast, by End User Industry 2020 & 2033
- Table 22: Global Physical Security Services Market Volume Billion Forecast, by End User Industry 2020 & 2033
- Table 23: Global Physical Security Services Market Revenue Million Forecast, by Country 2020 & 2033
- Table 24: Global Physical Security Services Market Volume Billion Forecast, by Country 2020 & 2033
- Table 25: Global Physical Security Services Market Revenue Million Forecast, by Component 2020 & 2033
- Table 26: Global Physical Security Services Market Volume Billion Forecast, by Component 2020 & 2033
- Table 27: Global Physical Security Services Market Revenue Million Forecast, by End User Industry 2020 & 2033
- Table 28: Global Physical Security Services Market Volume Billion Forecast, by End User Industry 2020 & 2033
- Table 29: Global Physical Security Services Market Revenue Million Forecast, by Country 2020 & 2033
- Table 30: Global Physical Security Services Market Volume Billion Forecast, by Country 2020 & 2033
- Table 31: Global Physical Security Services Market Revenue Million Forecast, by Component 2020 & 2033
- Table 32: Global Physical Security Services Market Volume Billion Forecast, by Component 2020 & 2033
- Table 33: Global Physical Security Services Market Revenue Million Forecast, by End User Industry 2020 & 2033
- Table 34: Global Physical Security Services Market Volume Billion Forecast, by End User Industry 2020 & 2033
- Table 35: Global Physical Security Services Market Revenue Million Forecast, by Country 2020 & 2033
- Table 36: Global Physical Security Services Market Volume Billion Forecast, by Country 2020 & 2033
- Table 37: Global Physical Security Services Market Revenue Million Forecast, by Component 2020 & 2033
- Table 38: Global Physical Security Services Market Volume Billion Forecast, by Component 2020 & 2033
- Table 39: Global Physical Security Services Market Revenue Million Forecast, by End User Industry 2020 & 2033
- Table 40: Global Physical Security Services Market Volume Billion Forecast, by End User Industry 2020 & 2033
- Table 41: Global Physical Security Services Market Revenue Million Forecast, by Country 2020 & 2033
- Table 42: Global Physical Security Services Market Volume Billion Forecast, by Country 2020 & 2033
Frequently Asked Questions
1. What is the projected Compound Annual Growth Rate (CAGR) of the Physical Security Services Market?
The projected CAGR is approximately 4.75%.
2. Which companies are prominent players in the Physical Security Services Market?
Key companies in the market include Johnson Controles, Honeywell International Inc, Cisco Systems Inc, Huawei Technologies Co Ltd, Genetec Inc, G4S, Securitas, Secom, Prosegur, Brinks, Loomis, Allied Barton, Garda, Relianc.
3. What are the main segments of the Physical Security Services Market?
The market segments include Component, End User Industry.
4. Can you provide details about the market size?
The market size is estimated to be USD 112.93 Million as of 2022.
5. What are some drivers contributing to market growth?
Favorable Changes in Regulatory Standards have Prompted the Use of Security Services from the Organized Sector; Dynamic Nature of the Security Threats. Especially. has Contributed the Demand for Cash Services to Safeguard Cash Transit.
6. What are the notable trends driving market growth?
The Demand for Physical Security Services is Growing in the BSFI Sector.
7. Are there any restraints impacting market growth?
Favorable Changes in Regulatory Standards have Prompted the Use of Security Services from the Organized Sector; Dynamic Nature of the Security Threats. Especially. has Contributed the Demand for Cash Services to Safeguard Cash Transit.
8. Can you provide examples of recent developments in the market?
May 2024: ZKTeco East Africa, a company providing security technology solutions, announced its partnership with Mart Networks Group Ltd at a security technology conference. ZKTecho showcased its newly launched products and solutions, including time and attendance, access control, smart locks, and video surveillance management. It also explores the potential and capabilities of ZKDigimax in digital advertising and displays cutting-edge physical security solutions from Armatura.
9. What pricing options are available for accessing the report?
Pricing options include single-user, multi-user, and enterprise licenses priced at USD 4750, USD 5250, and USD 8750 respectively.
10. Is the market size provided in terms of value or volume?
The market size is provided in terms of value, measured in Million and volume, measured in Billion.
11. Are there any specific market keywords associated with the report?
Yes, the market keyword associated with the report is "Physical Security Services Market," which aids in identifying and referencing the specific market segment covered.
12. How do I determine which pricing option suits my needs best?
The pricing options vary based on user requirements and access needs. Individual users may opt for single-user licenses, while businesses requiring broader access may choose multi-user or enterprise licenses for cost-effective access to the report.
13. Are there any additional resources or data provided in the Physical Security Services Market report?
While the report offers comprehensive insights, it's advisable to review the specific contents or supplementary materials provided to ascertain if additional resources or data are available.
14. How can I stay updated on further developments or reports in the Physical Security Services Market?
To stay informed about further developments, trends, and reports in the Physical Security Services Market, consider subscribing to industry newsletters, following relevant companies and organizations, or regularly checking reputable industry news sources and publications.
Methodology
Step 1 - Identification of Relevant Samples Size from Population Database


Step 2 - Approaches for Defining Global Market Size (Value, Volume* & Price*)

Note*: In applicable scenarios
Step 3 - Data Sources
Primary Research
- Web Analytics
- Survey Reports
- Research Institute
- Latest Research Reports
- Opinion Leaders
Secondary Research
- Annual Reports
- White Paper
- Latest Press Release
- Industry Association
- Paid Database
- Investor Presentations

Step 4 - Data Triangulation
Involves using different sources of information in order to increase the validity of a study
These sources are likely to be stakeholders in a program - participants, other researchers, program staff, other community members, and so on.
Then we put all data in single framework & apply various statistical tools to find out the dynamic on the market.
During the analysis stage, feedback from the stakeholder groups would be compared to determine areas of agreement as well as areas of divergence

