

Key Insights
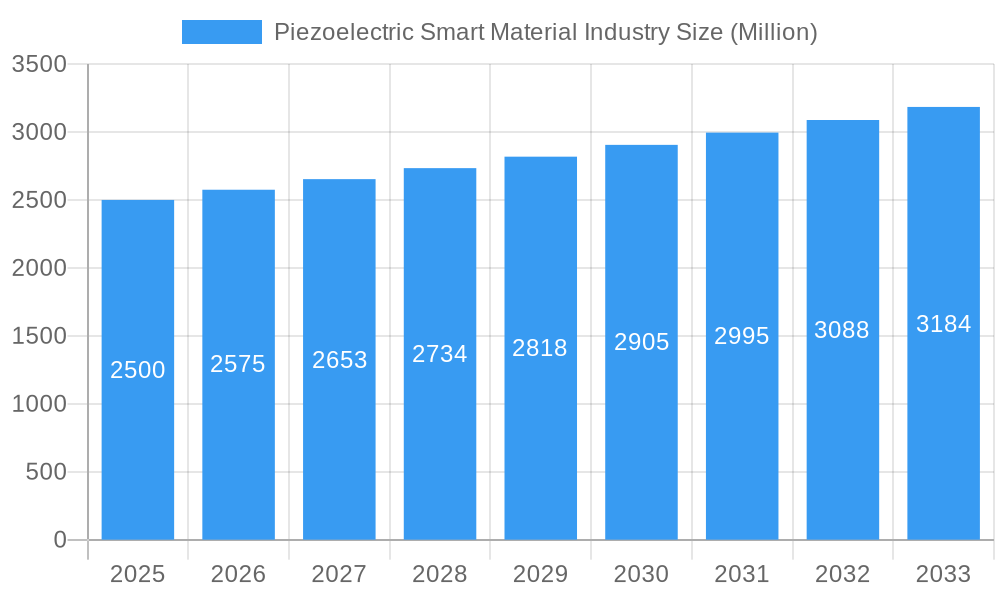
The piezoelectric smart material market is experiencing robust growth, driven by increasing demand across diverse sectors. The market size in 2025 is estimated at $2.5 billion, exhibiting a Compound Annual Growth Rate (CAGR) exceeding 3.0% throughout the forecast period (2025-2033). This expansion is fueled by several key factors. The automotive industry's push towards advanced driver-assistance systems (ADAS) and electric vehicles (EVs) significantly boosts demand for piezoelectric sensors and actuators. Similarly, the burgeoning construction and infrastructure sectors leverage these materials for smart buildings and structural health monitoring. The healthcare sector is witnessing increased adoption for medical imaging and drug delivery systems. Technological advancements leading to improved material properties, miniaturization, and enhanced performance are further stimulating market growth. While raw material costs and complex manufacturing processes present some challenges, ongoing research and development efforts are addressing these limitations. The market segmentation reveals significant potential in the ceramics segment, with applications in motors and transducers experiencing high demand. Geographically, the Asia-Pacific region, particularly China and India, is expected to dominate due to rapid industrialization and rising disposable incomes. North America and Europe, however, maintain a strong presence due to established technological infrastructure and substantial R&D activities.
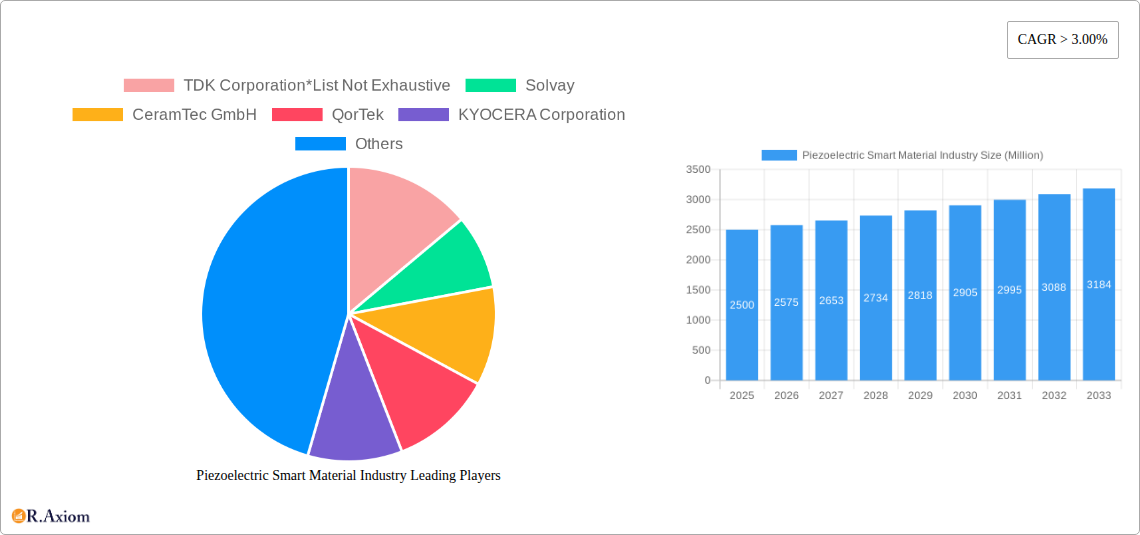
Piezoelectric Smart Material Industry Market Size (In Billion)
The market's future trajectory promises continued expansion, propelled by further technological breakthroughs in materials science and expanding applications in emerging areas like robotics, wearable technology, and energy harvesting. The ongoing miniaturization of piezoelectric devices allows for integration into increasingly smaller and more sophisticated systems, opening up novel applications. Moreover, government initiatives promoting sustainability and smart infrastructure are providing a favorable regulatory environment for market growth. Strategic alliances, acquisitions, and collaborations among market players are also driving innovation and expansion. While competitive intensity is increasing, the overall market outlook remains positive, driven by the inherent advantages and versatile applications of piezoelectric smart materials.
Piezoelectric Smart Material Industry Company Market Share
Piezoelectric Smart Material Industry: A Comprehensive Market Report (2019-2033)
This in-depth report provides a comprehensive analysis of the piezoelectric smart material industry, encompassing market size, growth forecasts, segment performance, competitive landscape, and future trends. The study covers the period from 2019 to 2033, with 2025 as the base and estimated year. The report is essential for industry stakeholders, investors, and researchers seeking actionable insights into this dynamic market. The global market size is projected to reach xx Million by 2033.
Piezoelectric Smart Material Industry Market Concentration & Innovation
The piezoelectric smart material market is characterized by a moderately concentrated landscape, with several key players holding significant market share. TDK Corporation, Solvay, CeramTec GmbH, QorTek, KYOCERA Corporation, APC International Ltd, Arkema Group, CTS Corporation, and noliac are among the prominent companies shaping the industry. However, the presence of numerous smaller players and startups indicates a dynamic competitive environment.
Market share data for 2024 indicates that TDK Corporation holds an estimated xx% market share, followed by Solvay with xx%, and CeramTec GmbH with xx%. The remaining share is distributed among other key players and smaller participants.
Innovation is a key driver, fueled by advancements in materials science, nanotechnology, and miniaturization. Regulatory frameworks, particularly concerning environmental standards and safety regulations, significantly impact market dynamics. Product substitutes, such as other sensing technologies, pose a competitive threat, while the increasing demand for smart and sustainable solutions across various end-user industries presents significant growth opportunities. M&A activities are relatively frequent, with deal values ranging from xx Million to xx Million in recent years, mostly focused on expanding product portfolios and geographical reach.
- Market Concentration: Moderately concentrated, with a few major players and numerous smaller companies.
- Innovation Drivers: Advancements in materials science, nanotechnology, and miniaturization.
- Regulatory Frameworks: Impact market dynamics through environmental and safety regulations.
- Product Substitutes: Other sensing technologies pose a competitive threat.
- End-User Trends: Increasing demand for smart and sustainable solutions.
- M&A Activities: Frequent, with deal values ranging from xx Million to xx Million.
Piezoelectric Smart Material Industry Industry Trends & Insights
The piezoelectric smart material market exhibits a robust growth trajectory, driven by the increasing adoption of smart technologies across diverse sectors. The market is witnessing significant technological disruptions, such as the development of flexible and printable piezoelectric materials, which are expanding application possibilities and reducing production costs. Consumer preferences are shifting towards energy-efficient and sustainable products, aligning with the eco-friendly nature of piezoelectric materials. The competitive landscape is dynamic, with companies focusing on product innovation, strategic partnerships, and expansion into new markets to gain a competitive edge. The Compound Annual Growth Rate (CAGR) is projected to be xx% during the forecast period (2025-2033), indicating substantial market expansion. Market penetration is gradually increasing across various applications, particularly in the automotive and healthcare sectors.
Dominant Markets & Segments in Piezoelectric Smart Material Industry
The automotive sector is currently the dominant end-user industry for piezoelectric smart materials, driven by the rising demand for advanced driver-assistance systems (ADAS) and electric vehicles (EVs). The construction and infrastructure sector presents significant growth potential, with piezoelectric materials finding increasing applications in structural health monitoring and energy harvesting. Within material types, ceramics are the leading segment due to their superior performance characteristics, while sensors represent the largest application segment due to widespread applications across diverse sectors. Key regional markets include North America, Europe, and Asia-Pacific.
- Dominant End-User Industry: Automotive (driven by ADAS and EVs).
- High-Growth End-User Industry: Construction and Infrastructure (structural health monitoring and energy harvesting).
- Dominant Material Type: Ceramics (superior performance).
- Dominant Application: Sensors (widespread applications).
- Key Regional Markets: North America, Europe, and Asia-Pacific.
Drivers for Automotive Dominance:
- Stringent automotive safety regulations.
- Increasing demand for fuel-efficient vehicles.
- Growing adoption of advanced driver assistance systems (ADAS).
Drivers for Construction & Infrastructure Growth:
- Expanding infrastructure development globally.
- Need for structural health monitoring and damage detection.
- Potential for energy harvesting in buildings.
Piezoelectric Smart Material Industry Product Developments
Recent product innovations focus on enhancing material performance, miniaturization, and cost reduction. New flexible and printable piezoelectric materials are expanding applications, while advancements in manufacturing processes are improving efficiency and scalability. The competitive advantage lies in superior material properties, cost-effectiveness, and customized solutions tailored to specific end-user needs. These developments are driving market growth and expanding the range of applications for piezoelectric smart materials.
Report Scope & Segmentation Analysis
This report segments the piezoelectric smart material market based on end-user industry (Agriculture and Food, Construction and Infrastructure, Healthcare, Leisure and Sports, Automotive, Aerospace and Defense, Other End-user Industries), material type (Ceramics, Polymers, Composites), and application (Motors, Transducers, Sensors, Building Materials). Each segment is analyzed in terms of market size, growth projections, and competitive dynamics. The report provides detailed insights into the growth potential and opportunities within each segment, offering valuable guidance for strategic decision-making. For instance, the automotive segment exhibits significant growth potential, driven by the increasing adoption of EVs and ADAS. Similarly, the healthcare segment is expected to witness substantial growth due to the rising demand for miniaturized medical devices and sensors.
Key Drivers of Piezoelectric Smart Material Industry Growth
Several key factors drive the growth of the piezoelectric smart material industry. Technological advancements, particularly in material science and nanotechnology, are continuously improving the performance and capabilities of piezoelectric materials. The increasing demand for energy-efficient and sustainable solutions across various industries is fueling the adoption of piezoelectric energy harvesting technologies. Favorable government policies and initiatives promoting the development and adoption of smart technologies further contribute to market growth.
Challenges in the Piezoelectric Smart Material Industry Sector
Despite the significant growth potential, the piezoelectric smart material industry faces several challenges. High production costs and the complexity of manufacturing processes can limit market adoption, especially for smaller companies. Supply chain disruptions and the availability of raw materials can also impact production and market stability. Furthermore, intense competition among established players and emerging startups puts pressure on pricing and profit margins. These factors may impede market expansion and limit profitability. The industry needs to address these issues to ensure sustained growth.
Emerging Opportunities in Piezoelectric Smart Material Industry
The piezoelectric smart material industry is poised for significant expansion, driven by several emerging opportunities. The growing demand for wearable technology and Internet of Things (IoT) devices is creating new applications for miniaturized piezoelectric sensors and energy harvesting devices. Advancements in 3D printing technology are opening up possibilities for the development of complex and customized piezoelectric components. Furthermore, increasing focus on sustainable energy solutions is driving demand for piezoelectric energy harvesting systems in various applications. These trends are expected to fuel market growth in the coming years.
Leading Players in the Piezoelectric Smart Material Industry Market
- TDK Corporation
- Solvay
- CeramTec GmbH
- QorTek
- KYOCERA Corporation
- APC International Ltd
- Arkema Group
- CTS Corporation
- noliac
Key Developments in Piezoelectric Smart Material Industry Industry
- April 2021: The SUPERSMART European project, coordinated by Arkema and sponsored by EIT (European Institute of Innovation and Technology), received the 2021 Organic Electronics Association competition Award for the Best Publicly Funded Project Demonstrator. This initiative advanced paper-printed organic electronics from the lab to the factory.
Strategic Outlook for Piezoelectric Smart Material Market
The piezoelectric smart material market is expected to experience substantial growth driven by technological advancements, rising demand for energy efficiency, and increasing adoption across diverse sectors. Future opportunities lie in the development of novel materials with enhanced performance characteristics, miniaturization, cost reduction, and expansion into new applications. The industry's strategic focus on innovation, sustainability, and strategic partnerships will shape its future trajectory and market leadership.
Piezoelectric Smart Material Industry Segmentation
-
1. Type
- 1.1. Ceramics
- 1.2. Polymers
- 1.3. Composites
-
2. Application
- 2.1. Motors
- 2.2. Transducers
- 2.3. Sensors
- 2.4. Building Materials
-
3. End-user Industry
- 3.1. Agriculture and Food
- 3.2. Construction and Infrastructure
- 3.3. Healthcare
- 3.4. Leisure and Sports
- 3.5. Automotive
- 3.6. Aerospace and Defense
- 3.7. Other End-user Industries
Piezoelectric Smart Material Industry Segmentation By Geography
-
1. Asia Pacific
- 1.1. China
- 1.2. India
- 1.3. Japan
- 1.4. South Korea
- 1.5. Rest of Asia Pacific
-
2. North America
- 2.1. United States
- 2.2. Canada
- 2.3. Mexico
-
3. Europe
- 3.1. Germany
- 3.2. United Kingdom
- 3.3. Italy
- 3.4. France
- 3.5. Russia
- 3.6. Rest of Europe
-
4. South America
- 4.1. Brazil
- 4.2. Argentina
- 4.3. Rest of South America
-
5. Middle East and Africa
- 5.1. Saudi Arabia
- 5.2. South Africa
- 5.3. Rest of Middle East and Africa
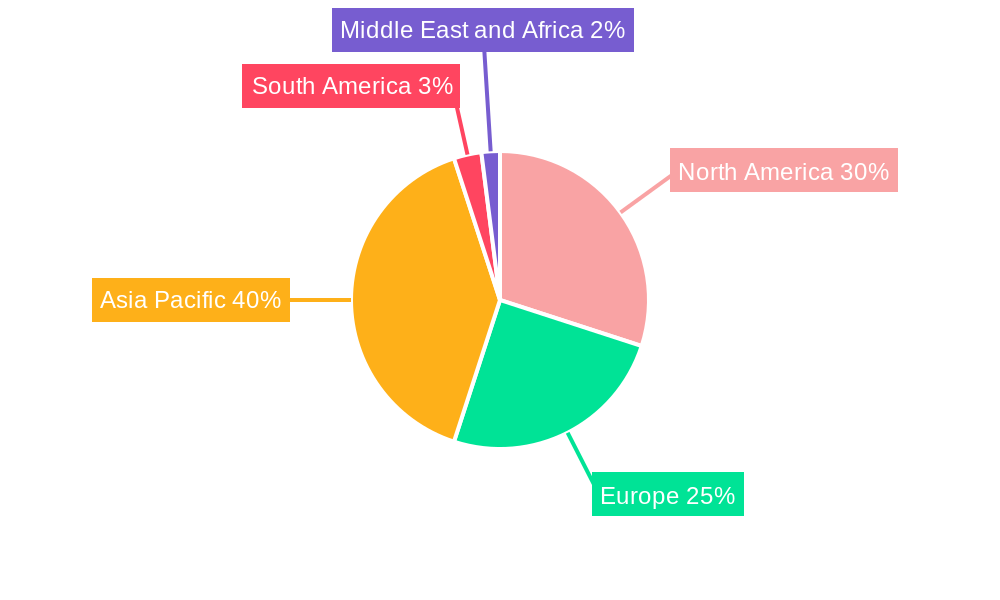
Piezoelectric Smart Material Industry Regional Market Share
Geographic Coverage of Piezoelectric Smart Material Industry
Piezoelectric Smart Material Industry REPORT HIGHLIGHTS
| Aspects | Details |
|---|---|
| Study Period | 2020-2034 |
| Base Year | 2025 |
| Estimated Year | 2026 |
| Forecast Period | 2026-2034 |
| Historical Period | 2020-2025 |
| Growth Rate | CAGR of > 3.00% from 2020-2034 |
| Segmentation |
|
Table of Contents
- 1. Introduction
- 1.1. Research Scope
- 1.2. Market Segmentation
- 1.3. Research Objective
- 1.4. Definitions and Assumptions
- 2. Executive Summary
- 2.1. Market Snapshot
- 3. Market Dynamics
- 3.1. Market Drivers
- 3.2. Market Restrains
- 3.3. Market Trends
- 3.4. Market Opportunities
- 4. Market Factor Analysis
- 4.1. Porters Five Forces
- 4.1.1. Bargaining Power of Suppliers
- 4.1.2. Bargaining Power of Buyers
- 4.1.3. Threat of New Entrants
- 4.1.4. Threat of Substitutes
- 4.1.5. Competitive Rivalry
- 4.2. PESTEL analysis
- 4.3. BCG Analysis
- 4.3.1. Stars (High Growth, High Market Share)
- 4.3.2. Cash Cows (Low Growth, High Market Share)
- 4.3.3. Question Mark (High Growth, Low Market Share)
- 4.3.4. Dogs (Low Growth, Low Market Share)
- 4.4. Ansoff Matrix Analysis
- 4.5. Supply Chain Analysis
- 4.6. Regulatory Landscape
- 4.7. Current Market Potential and Opportunity Assessment (TAM–SAM–SOM Framework)
- 4.8. RAX Analyst Note
- 4.1. Porters Five Forces
- 5. Market Analysis, Insights and Forecast 2021-2033
- 5.1. Market Analysis, Insights and Forecast - by Type
- 5.1.1. Ceramics
- 5.1.2. Polymers
- 5.1.3. Composites
- 5.2. Market Analysis, Insights and Forecast - by Application
- 5.2.1. Motors
- 5.2.2. Transducers
- 5.2.3. Sensors
- 5.2.4. Building Materials
- 5.3. Market Analysis, Insights and Forecast - by End-user Industry
- 5.3.1. Agriculture and Food
- 5.3.2. Construction and Infrastructure
- 5.3.3. Healthcare
- 5.3.4. Leisure and Sports
- 5.3.5. Automotive
- 5.3.6. Aerospace and Defense
- 5.3.7. Other End-user Industries
- 5.4. Market Analysis, Insights and Forecast - by Region
- 5.4.1. Asia Pacific
- 5.4.2. North America
- 5.4.3. Europe
- 5.4.4. South America
- 5.4.5. Middle East and Africa
- 5.1. Market Analysis, Insights and Forecast - by Type
- 6. Global Piezoelectric Smart Material Industry Analysis, Insights and Forecast, 2021-2033
- 6.1. Market Analysis, Insights and Forecast - by Type
- 6.1.1. Ceramics
- 6.1.2. Polymers
- 6.1.3. Composites
- 6.2. Market Analysis, Insights and Forecast - by Application
- 6.2.1. Motors
- 6.2.2. Transducers
- 6.2.3. Sensors
- 6.2.4. Building Materials
- 6.3. Market Analysis, Insights and Forecast - by End-user Industry
- 6.3.1. Agriculture and Food
- 6.3.2. Construction and Infrastructure
- 6.3.3. Healthcare
- 6.3.4. Leisure and Sports
- 6.3.5. Automotive
- 6.3.6. Aerospace and Defense
- 6.3.7. Other End-user Industries
- 6.1. Market Analysis, Insights and Forecast - by Type
- 7. Asia Pacific Piezoelectric Smart Material Industry Analysis, Insights and Forecast, 2020-2032
- 7.1. Market Analysis, Insights and Forecast - by Type
- 7.1.1. Ceramics
- 7.1.2. Polymers
- 7.1.3. Composites
- 7.2. Market Analysis, Insights and Forecast - by Application
- 7.2.1. Motors
- 7.2.2. Transducers
- 7.2.3. Sensors
- 7.2.4. Building Materials
- 7.3. Market Analysis, Insights and Forecast - by End-user Industry
- 7.3.1. Agriculture and Food
- 7.3.2. Construction and Infrastructure
- 7.3.3. Healthcare
- 7.3.4. Leisure and Sports
- 7.3.5. Automotive
- 7.3.6. Aerospace and Defense
- 7.3.7. Other End-user Industries
- 7.1. Market Analysis, Insights and Forecast - by Type
- 8. North America Piezoelectric Smart Material Industry Analysis, Insights and Forecast, 2020-2032
- 8.1. Market Analysis, Insights and Forecast - by Type
- 8.1.1. Ceramics
- 8.1.2. Polymers
- 8.1.3. Composites
- 8.2. Market Analysis, Insights and Forecast - by Application
- 8.2.1. Motors
- 8.2.2. Transducers
- 8.2.3. Sensors
- 8.2.4. Building Materials
- 8.3. Market Analysis, Insights and Forecast - by End-user Industry
- 8.3.1. Agriculture and Food
- 8.3.2. Construction and Infrastructure
- 8.3.3. Healthcare
- 8.3.4. Leisure and Sports
- 8.3.5. Automotive
- 8.3.6. Aerospace and Defense
- 8.3.7. Other End-user Industries
- 8.1. Market Analysis, Insights and Forecast - by Type
- 9. Europe Piezoelectric Smart Material Industry Analysis, Insights and Forecast, 2020-2032
- 9.1. Market Analysis, Insights and Forecast - by Type
- 9.1.1. Ceramics
- 9.1.2. Polymers
- 9.1.3. Composites
- 9.2. Market Analysis, Insights and Forecast - by Application
- 9.2.1. Motors
- 9.2.2. Transducers
- 9.2.3. Sensors
- 9.2.4. Building Materials
- 9.3. Market Analysis, Insights and Forecast - by End-user Industry
- 9.3.1. Agriculture and Food
- 9.3.2. Construction and Infrastructure
- 9.3.3. Healthcare
- 9.3.4. Leisure and Sports
- 9.3.5. Automotive
- 9.3.6. Aerospace and Defense
- 9.3.7. Other End-user Industries
- 9.1. Market Analysis, Insights and Forecast - by Type
- 10. South America Piezoelectric Smart Material Industry Analysis, Insights and Forecast, 2020-2032
- 10.1. Market Analysis, Insights and Forecast - by Type
- 10.1.1. Ceramics
- 10.1.2. Polymers
- 10.1.3. Composites
- 10.2. Market Analysis, Insights and Forecast - by Application
- 10.2.1. Motors
- 10.2.2. Transducers
- 10.2.3. Sensors
- 10.2.4. Building Materials
- 10.3. Market Analysis, Insights and Forecast - by End-user Industry
- 10.3.1. Agriculture and Food
- 10.3.2. Construction and Infrastructure
- 10.3.3. Healthcare
- 10.3.4. Leisure and Sports
- 10.3.5. Automotive
- 10.3.6. Aerospace and Defense
- 10.3.7. Other End-user Industries
- 10.1. Market Analysis, Insights and Forecast - by Type
- 11. Middle East and Africa Piezoelectric Smart Material Industry Analysis, Insights and Forecast, 2020-2032
- 11.1. Market Analysis, Insights and Forecast - by Type
- 11.1.1. Ceramics
- 11.1.2. Polymers
- 11.1.3. Composites
- 11.2. Market Analysis, Insights and Forecast - by Application
- 11.2.1. Motors
- 11.2.2. Transducers
- 11.2.3. Sensors
- 11.2.4. Building Materials
- 11.3. Market Analysis, Insights and Forecast - by End-user Industry
- 11.3.1. Agriculture and Food
- 11.3.2. Construction and Infrastructure
- 11.3.3. Healthcare
- 11.3.4. Leisure and Sports
- 11.3.5. Automotive
- 11.3.6. Aerospace and Defense
- 11.3.7. Other End-user Industries
- 11.1. Market Analysis, Insights and Forecast - by Type
- 12. Competitive Analysis
- 12.1. Company Profiles
- 12.1.1 TDK Corporation*List Not Exhaustive
- 12.1.1.1. Company Overview
- 12.1.1.2. Products
- 12.1.1.3. Company Financials
- 12.1.1.4. SWOT Analysis
- 12.1.2 Solvay
- 12.1.2.1. Company Overview
- 12.1.2.2. Products
- 12.1.2.3. Company Financials
- 12.1.2.4. SWOT Analysis
- 12.1.3 CeramTec GmbH
- 12.1.3.1. Company Overview
- 12.1.3.2. Products
- 12.1.3.3. Company Financials
- 12.1.3.4. SWOT Analysis
- 12.1.4 QorTek
- 12.1.4.1. Company Overview
- 12.1.4.2. Products
- 12.1.4.3. Company Financials
- 12.1.4.4. SWOT Analysis
- 12.1.5 KYOCERA Corporation
- 12.1.5.1. Company Overview
- 12.1.5.2. Products
- 12.1.5.3. Company Financials
- 12.1.5.4. SWOT Analysis
- 12.1.6 APC International Ltd
- 12.1.6.1. Company Overview
- 12.1.6.2. Products
- 12.1.6.3. Company Financials
- 12.1.6.4. SWOT Analysis
- 12.1.7 Arkema Group
- 12.1.7.1. Company Overview
- 12.1.7.2. Products
- 12.1.7.3. Company Financials
- 12.1.7.4. SWOT Analysis
- 12.1.8 CTS Corporation
- 12.1.8.1. Company Overview
- 12.1.8.2. Products
- 12.1.8.3. Company Financials
- 12.1.8.4. SWOT Analysis
- 12.1.9 noliac
- 12.1.9.1. Company Overview
- 12.1.9.2. Products
- 12.1.9.3. Company Financials
- 12.1.9.4. SWOT Analysis
- 12.1.1 TDK Corporation*List Not Exhaustive
- 12.2. Market Entropy
- 12.2.1 Company's Key Areas Served
- 12.2.2 Recent Developments
- 12.3. Company Market Share Analysis 2025
- 12.3.1 Top 5 Companies Market Share Analysis
- 12.3.2 Top 3 Companies Market Share Analysis
- 12.4. List of Potential Customers
- 13. Research Methodology
List of Figures
- Figure 1: Global Piezoelectric Smart Material Industry Revenue Breakdown (Million, %) by Region 2025 & 2033
- Figure 2: Asia Pacific Piezoelectric Smart Material Industry Revenue (Million), by Type 2025 & 2033
- Figure 3: Asia Pacific Piezoelectric Smart Material Industry Revenue Share (%), by Type 2025 & 2033
- Figure 4: Asia Pacific Piezoelectric Smart Material Industry Revenue (Million), by Application 2025 & 2033
- Figure 5: Asia Pacific Piezoelectric Smart Material Industry Revenue Share (%), by Application 2025 & 2033
- Figure 6: Asia Pacific Piezoelectric Smart Material Industry Revenue (Million), by End-user Industry 2025 & 2033
- Figure 7: Asia Pacific Piezoelectric Smart Material Industry Revenue Share (%), by End-user Industry 2025 & 2033
- Figure 8: Asia Pacific Piezoelectric Smart Material Industry Revenue (Million), by Country 2025 & 2033
- Figure 9: Asia Pacific Piezoelectric Smart Material Industry Revenue Share (%), by Country 2025 & 2033
- Figure 10: North America Piezoelectric Smart Material Industry Revenue (Million), by Type 2025 & 2033
- Figure 11: North America Piezoelectric Smart Material Industry Revenue Share (%), by Type 2025 & 2033
- Figure 12: North America Piezoelectric Smart Material Industry Revenue (Million), by Application 2025 & 2033
- Figure 13: North America Piezoelectric Smart Material Industry Revenue Share (%), by Application 2025 & 2033
- Figure 14: North America Piezoelectric Smart Material Industry Revenue (Million), by End-user Industry 2025 & 2033
- Figure 15: North America Piezoelectric Smart Material Industry Revenue Share (%), by End-user Industry 2025 & 2033
- Figure 16: North America Piezoelectric Smart Material Industry Revenue (Million), by Country 2025 & 2033
- Figure 17: North America Piezoelectric Smart Material Industry Revenue Share (%), by Country 2025 & 2033
- Figure 18: Europe Piezoelectric Smart Material Industry Revenue (Million), by Type 2025 & 2033
- Figure 19: Europe Piezoelectric Smart Material Industry Revenue Share (%), by Type 2025 & 2033
- Figure 20: Europe Piezoelectric Smart Material Industry Revenue (Million), by Application 2025 & 2033
- Figure 21: Europe Piezoelectric Smart Material Industry Revenue Share (%), by Application 2025 & 2033
- Figure 22: Europe Piezoelectric Smart Material Industry Revenue (Million), by End-user Industry 2025 & 2033
- Figure 23: Europe Piezoelectric Smart Material Industry Revenue Share (%), by End-user Industry 2025 & 2033
- Figure 24: Europe Piezoelectric Smart Material Industry Revenue (Million), by Country 2025 & 2033
- Figure 25: Europe Piezoelectric Smart Material Industry Revenue Share (%), by Country 2025 & 2033
- Figure 26: South America Piezoelectric Smart Material Industry Revenue (Million), by Type 2025 & 2033
- Figure 27: South America Piezoelectric Smart Material Industry Revenue Share (%), by Type 2025 & 2033
- Figure 28: South America Piezoelectric Smart Material Industry Revenue (Million), by Application 2025 & 2033
- Figure 29: South America Piezoelectric Smart Material Industry Revenue Share (%), by Application 2025 & 2033
- Figure 30: South America Piezoelectric Smart Material Industry Revenue (Million), by End-user Industry 2025 & 2033
- Figure 31: South America Piezoelectric Smart Material Industry Revenue Share (%), by End-user Industry 2025 & 2033
- Figure 32: South America Piezoelectric Smart Material Industry Revenue (Million), by Country 2025 & 2033
- Figure 33: South America Piezoelectric Smart Material Industry Revenue Share (%), by Country 2025 & 2033
- Figure 34: Middle East and Africa Piezoelectric Smart Material Industry Revenue (Million), by Type 2025 & 2033
- Figure 35: Middle East and Africa Piezoelectric Smart Material Industry Revenue Share (%), by Type 2025 & 2033
- Figure 36: Middle East and Africa Piezoelectric Smart Material Industry Revenue (Million), by Application 2025 & 2033
- Figure 37: Middle East and Africa Piezoelectric Smart Material Industry Revenue Share (%), by Application 2025 & 2033
- Figure 38: Middle East and Africa Piezoelectric Smart Material Industry Revenue (Million), by End-user Industry 2025 & 2033
- Figure 39: Middle East and Africa Piezoelectric Smart Material Industry Revenue Share (%), by End-user Industry 2025 & 2033
- Figure 40: Middle East and Africa Piezoelectric Smart Material Industry Revenue (Million), by Country 2025 & 2033
- Figure 41: Middle East and Africa Piezoelectric Smart Material Industry Revenue Share (%), by Country 2025 & 2033
List of Tables
- Table 1: Global Piezoelectric Smart Material Industry Revenue Million Forecast, by Type 2020 & 2033
- Table 2: Global Piezoelectric Smart Material Industry Revenue Million Forecast, by Application 2020 & 2033
- Table 3: Global Piezoelectric Smart Material Industry Revenue Million Forecast, by End-user Industry 2020 & 2033
- Table 4: Global Piezoelectric Smart Material Industry Revenue Million Forecast, by Region 2020 & 2033
- Table 5: Global Piezoelectric Smart Material Industry Revenue Million Forecast, by Type 2020 & 2033
- Table 6: Global Piezoelectric Smart Material Industry Revenue Million Forecast, by Application 2020 & 2033
- Table 7: Global Piezoelectric Smart Material Industry Revenue Million Forecast, by End-user Industry 2020 & 2033
- Table 8: Global Piezoelectric Smart Material Industry Revenue Million Forecast, by Country 2020 & 2033
- Table 9: China Piezoelectric Smart Material Industry Revenue (Million) Forecast, by Application 2020 & 2033
- Table 10: India Piezoelectric Smart Material Industry Revenue (Million) Forecast, by Application 2020 & 2033
- Table 11: Japan Piezoelectric Smart Material Industry Revenue (Million) Forecast, by Application 2020 & 2033
- Table 12: South Korea Piezoelectric Smart Material Industry Revenue (Million) Forecast, by Application 2020 & 2033
- Table 13: Rest of Asia Pacific Piezoelectric Smart Material Industry Revenue (Million) Forecast, by Application 2020 & 2033
- Table 14: Global Piezoelectric Smart Material Industry Revenue Million Forecast, by Type 2020 & 2033
- Table 15: Global Piezoelectric Smart Material Industry Revenue Million Forecast, by Application 2020 & 2033
- Table 16: Global Piezoelectric Smart Material Industry Revenue Million Forecast, by End-user Industry 2020 & 2033
- Table 17: Global Piezoelectric Smart Material Industry Revenue Million Forecast, by Country 2020 & 2033
- Table 18: United States Piezoelectric Smart Material Industry Revenue (Million) Forecast, by Application 2020 & 2033
- Table 19: Canada Piezoelectric Smart Material Industry Revenue (Million) Forecast, by Application 2020 & 2033
- Table 20: Mexico Piezoelectric Smart Material Industry Revenue (Million) Forecast, by Application 2020 & 2033
- Table 21: Global Piezoelectric Smart Material Industry Revenue Million Forecast, by Type 2020 & 2033
- Table 22: Global Piezoelectric Smart Material Industry Revenue Million Forecast, by Application 2020 & 2033
- Table 23: Global Piezoelectric Smart Material Industry Revenue Million Forecast, by End-user Industry 2020 & 2033
- Table 24: Global Piezoelectric Smart Material Industry Revenue Million Forecast, by Country 2020 & 2033
- Table 25: Germany Piezoelectric Smart Material Industry Revenue (Million) Forecast, by Application 2020 & 2033
- Table 26: United Kingdom Piezoelectric Smart Material Industry Revenue (Million) Forecast, by Application 2020 & 2033
- Table 27: Italy Piezoelectric Smart Material Industry Revenue (Million) Forecast, by Application 2020 & 2033
- Table 28: France Piezoelectric Smart Material Industry Revenue (Million) Forecast, by Application 2020 & 2033
- Table 29: Russia Piezoelectric Smart Material Industry Revenue (Million) Forecast, by Application 2020 & 2033
- Table 30: Rest of Europe Piezoelectric Smart Material Industry Revenue (Million) Forecast, by Application 2020 & 2033
- Table 31: Global Piezoelectric Smart Material Industry Revenue Million Forecast, by Type 2020 & 2033
- Table 32: Global Piezoelectric Smart Material Industry Revenue Million Forecast, by Application 2020 & 2033
- Table 33: Global Piezoelectric Smart Material Industry Revenue Million Forecast, by End-user Industry 2020 & 2033
- Table 34: Global Piezoelectric Smart Material Industry Revenue Million Forecast, by Country 2020 & 2033
- Table 35: Brazil Piezoelectric Smart Material Industry Revenue (Million) Forecast, by Application 2020 & 2033
- Table 36: Argentina Piezoelectric Smart Material Industry Revenue (Million) Forecast, by Application 2020 & 2033
- Table 37: Rest of South America Piezoelectric Smart Material Industry Revenue (Million) Forecast, by Application 2020 & 2033
- Table 38: Global Piezoelectric Smart Material Industry Revenue Million Forecast, by Type 2020 & 2033
- Table 39: Global Piezoelectric Smart Material Industry Revenue Million Forecast, by Application 2020 & 2033
- Table 40: Global Piezoelectric Smart Material Industry Revenue Million Forecast, by End-user Industry 2020 & 2033
- Table 41: Global Piezoelectric Smart Material Industry Revenue Million Forecast, by Country 2020 & 2033
- Table 42: Saudi Arabia Piezoelectric Smart Material Industry Revenue (Million) Forecast, by Application 2020 & 2033
- Table 43: South Africa Piezoelectric Smart Material Industry Revenue (Million) Forecast, by Application 2020 & 2033
- Table 44: Rest of Middle East and Africa Piezoelectric Smart Material Industry Revenue (Million) Forecast, by Application 2020 & 2033
Frequently Asked Questions
1. What is the projected Compound Annual Growth Rate (CAGR) of the Piezoelectric Smart Material Industry?
The projected CAGR is approximately > 3.00%.
2. Which companies are prominent players in the Piezoelectric Smart Material Industry?
Key companies in the market include TDK Corporation*List Not Exhaustive, Solvay, CeramTec GmbH, QorTek, KYOCERA Corporation, APC International Ltd, Arkema Group, CTS Corporation, noliac.
3. What are the main segments of the Piezoelectric Smart Material Industry?
The market segments include Type, Application, End-user Industry.
4. Can you provide details about the market size?
The market size is estimated to be USD XX Million as of 2022.
5. What are some drivers contributing to market growth?
Increase in Demand from Military and Aerospace Sector; Growing Demand from Construction.
6. What are the notable trends driving market growth?
Aerospace and Defense Industry to Witness the Highest Growth Rate.
7. Are there any restraints impacting market growth?
High Cost of Smart Materials; Other Restraints.
8. Can you provide examples of recent developments in the market?
In April 2021, The SUPERSMART European project, co-ordinated by Arkema and sponsored by EIT (European Institute of Innovation and Technology), has received the 2021 Organic Electronics Association competition Award for the Best Publicly Funded Project Demonstrator. This initiative takes the emerging technology of paper-printed organic electronics from the lab to the factory.
9. What pricing options are available for accessing the report?
Pricing options include single-user, multi-user, and enterprise licenses priced at USD 4750, USD 5250, and USD 8750 respectively.
10. Is the market size provided in terms of value or volume?
The market size is provided in terms of value, measured in Million.
11. Are there any specific market keywords associated with the report?
Yes, the market keyword associated with the report is "Piezoelectric Smart Material Industry," which aids in identifying and referencing the specific market segment covered.
12. How do I determine which pricing option suits my needs best?
The pricing options vary based on user requirements and access needs. Individual users may opt for single-user licenses, while businesses requiring broader access may choose multi-user or enterprise licenses for cost-effective access to the report.
13. Are there any additional resources or data provided in the Piezoelectric Smart Material Industry report?
While the report offers comprehensive insights, it's advisable to review the specific contents or supplementary materials provided to ascertain if additional resources or data are available.
14. How can I stay updated on further developments or reports in the Piezoelectric Smart Material Industry?
To stay informed about further developments, trends, and reports in the Piezoelectric Smart Material Industry, consider subscribing to industry newsletters, following relevant companies and organizations, or regularly checking reputable industry news sources and publications.
Methodology
Step 1 - Identification of Relevant Samples Size from Population Database


Step 2 - Approaches for Defining Global Market Size (Value, Volume* & Price*)

Note*: In applicable scenarios
Step 3 - Data Sources
Primary Research
- Web Analytics
- Survey Reports
- Research Institute
- Latest Research Reports
- Opinion Leaders
Secondary Research
- Annual Reports
- White Paper
- Latest Press Release
- Industry Association
- Paid Database
- Investor Presentations

Step 4 - Data Triangulation
Involves using different sources of information in order to increase the validity of a study
These sources are likely to be stakeholders in a program - participants, other researchers, program staff, other community members, and so on.
Then we put all data in single framework & apply various statistical tools to find out the dynamic on the market.
During the analysis stage, feedback from the stakeholder groups would be compared to determine areas of agreement as well as areas of divergence