

Key Insights
The Polish water treatment chemicals market is a significant growth sector, driven by industrial expansion, stricter environmental mandates, and escalating demand for safe potable water. With a projected Compound Annual Growth Rate (CAGR) of 6.1% and an estimated market size of 46.11 billion in the 2025 base year, this market is set for substantial development through 2033. Key growth catalysts include infrastructure upgrades, the adoption of advanced treatment technologies like membrane filtration, and heightened awareness of water scarcity and pollution. Market segmentation is expected across municipal, industrial, and agricultural sectors, each with unique chemical requirements. Leading global and regional companies are actively vying for market dominance, fostering innovation and competitive pricing.
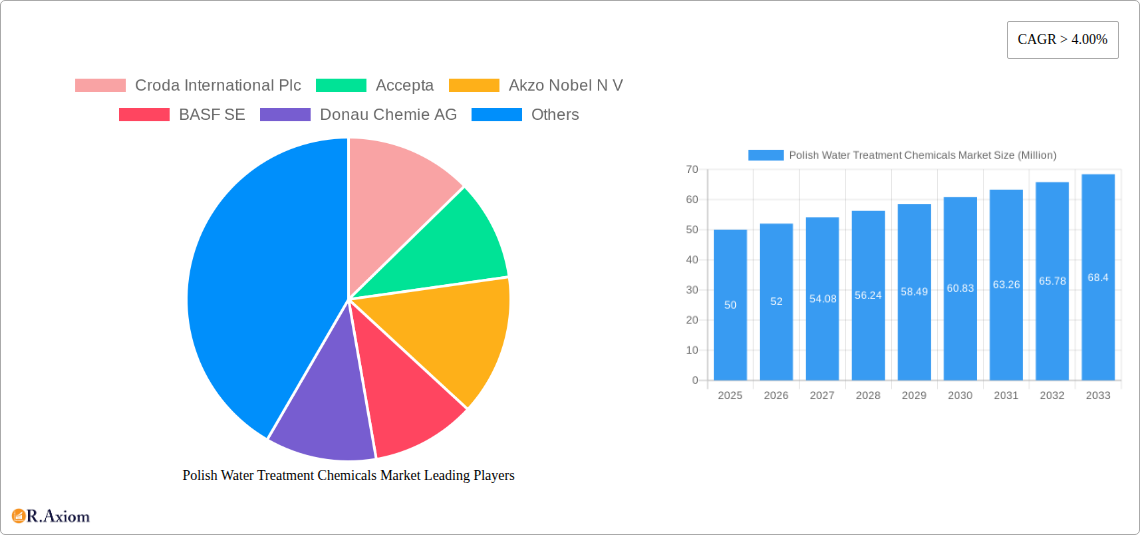
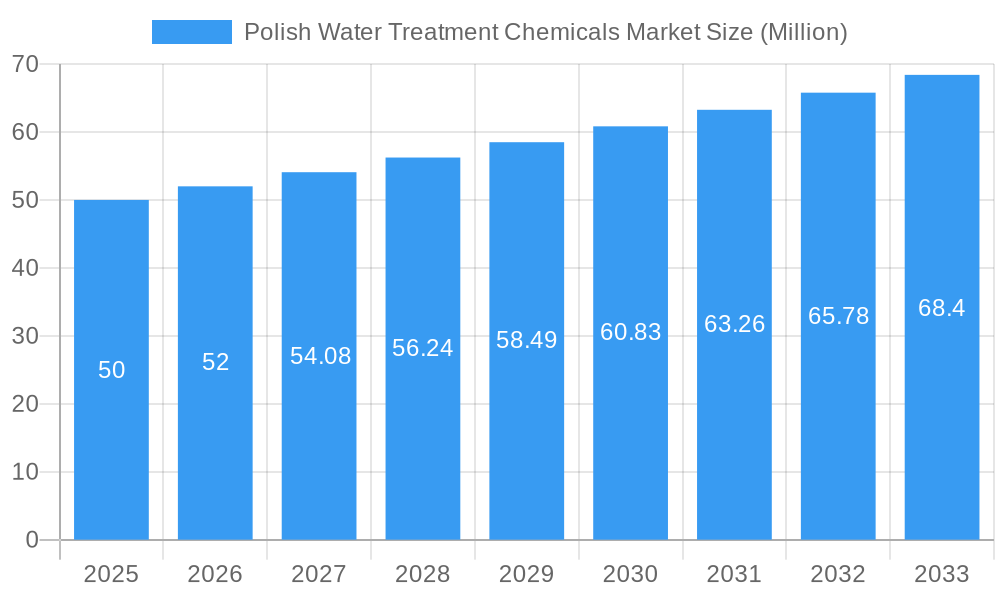
Polish Water Treatment Chemicals Market Market Size (In Billion)
The forecast period anticipates sustained growth, supported by governmental water security initiatives and private sector investment in treatment solutions. Poland's growing manufacturing and energy industries are primary demand drivers. While specific regional data is limited, industrial centers and populous regions are likely to lead market share. The increasing focus on sustainable water management practices further underpins long-term market expansion. Potential economic slowdowns or regulatory shifts may temper growth, necessitating diligent market observation for strategic planning.
Polish Water Treatment Chemicals Market Company Market Share
Polish Water Treatment Chemicals Market: A Comprehensive Analysis (2019-2033)
This comprehensive report provides an in-depth analysis of the Polish Water Treatment Chemicals market, offering invaluable insights for industry stakeholders, investors, and strategic decision-makers. The study covers the period from 2019 to 2033, with 2025 serving as the base year and estimated year. The forecast period spans from 2025 to 2033, encompassing historical data from 2019 to 2024. This report uses Million as the unit for all values.
Polish Water Treatment Chemicals Market Concentration & Innovation
This section analyzes the competitive landscape of the Polish water treatment chemicals market, exploring market concentration, innovation drivers, regulatory frameworks, product substitutes, end-user trends, and mergers & acquisitions (M&A) activities. The market exhibits a moderately concentrated structure, with several multinational corporations holding significant market share. For example, companies like Croda International Plc, Akzo Nobel N.V., BASF SE, and Ecolab hold substantial positions. However, smaller, specialized players also contribute significantly, particularly in niche segments.
Market share data suggests that the top five players collectively account for approximately xx% of the market, while the remaining share is distributed among numerous smaller companies. Innovation is driven by stringent environmental regulations, the increasing demand for sustainable solutions, and the need for improved water quality. Recent M&A activities in the Polish market have been relatively modest, with deal values averaging xx Million annually over the past five years. Notable acquisitions include [Insert specific examples if available, otherwise use "xx"]. This section also covers the impact of regulatory frameworks, particularly those related to water quality and environmental protection, which drive the adoption of advanced water treatment technologies and innovative chemical solutions. Substitution is minimal, with limited alternatives to specialized chemical treatments. The rising industrialization and urban populations are fueling the end-user demand for these chemicals.
Polish Water Treatment Chemicals Market Industry Trends & Insights
The Polish water treatment chemicals market is experiencing robust growth, driven by several key factors. The increasing industrialization, urbanization, and rising awareness of water scarcity are pushing the demand for advanced water treatment solutions. The CAGR for the market during the forecast period (2025-2033) is projected to be xx%, driven by investments in water infrastructure, stricter environmental regulations, and the rising adoption of sustainable water management practices. Market penetration remains relatively high in established industrial sectors, but opportunities exist in expanding the usage across residential and agricultural sectors. The market is witnessing significant technological disruptions, with innovations in membrane filtration, advanced oxidation processes, and bioremediation technologies. These technological advancements are improving the efficiency and effectiveness of water treatment processes, while also offering more environmentally friendly solutions. Consumer preferences are shifting towards sustainable and environmentally friendly products, which are driving the demand for eco-friendly water treatment chemicals. The competitive dynamics in the market are influenced by factors such as pricing, product innovation, and brand reputation. Key players are focusing on strategic partnerships and collaborations to expand their market reach and offer comprehensive solutions.
Dominant Markets & Segments in Polish Water Treatment Chemicals Market
The industrial sector, particularly within the manufacturing and power generation segments, dominates the Polish water treatment chemicals market. This dominance is driven by the high demand for cooling water treatment, boiler water treatment, and wastewater treatment solutions in these sectors.
- Key Drivers for Industrial Sector Dominance:
- Stringent environmental regulations requiring effective wastewater treatment.
- High water consumption in industrial processes necessitates efficient treatment.
- Growing investments in industrial infrastructure development.
- Stringent regulatory compliance requirements driving adoption of advanced solutions.
The dominance is further strengthened by the government's focus on improving industrial efficiency and reducing the environmental impact of industrial activities. Furthermore, the significant industrial production and large water-intensive facilities in specific regions of Poland contribute to this sector's leading position. The geographic distribution shows that regions with high industrial concentration experience higher market demand.
Polish Water Treatment Chemicals Market Product Developments
Recent product innovations focus on environmentally friendly formulations, enhanced performance characteristics, and customized solutions tailored to specific industrial needs. Several companies are developing chemicals with improved biodegradability and reduced toxicity. These advances respond directly to tightening environmental regulations and increasing consumer preference for sustainable products. Advanced oxidation processes (AOPs) and membrane filtration technologies are gaining traction, offering efficient and effective water treatment solutions. The market is also witnessing the emergence of specialized chemicals for specific applications, such as reverse osmosis (RO) membrane cleaning agents and scale inhibitors for cooling towers. These advancements enhance efficiency and effectiveness, providing competitive advantages in a rapidly evolving market.
Report Scope & Segmentation Analysis
This report segments the Polish water treatment chemicals market based on several factors:
- By Chemical Type: This includes coagulants, flocculants, disinfectants, corrosion inhibitors, scale inhibitors, and others. Each segment presents distinct growth trajectories and competitive dynamics, with flocculants and coagulants dominating the market due to their wide application in various industrial processes.
- By Application: The market is further segmented into industrial, municipal, and agricultural applications. The industrial segment is projected to register the highest growth, driven by expanding manufacturing and energy sectors.
- By End-User Industry: This encompasses power generation, manufacturing, chemical processing, food & beverage, pharmaceuticals, and others.
Growth projections vary across segments, with the industrial application segment exhibiting the most significant growth potential. Competitive intensity also differs depending on the specific segment, with some segments characterized by intense competition and others exhibiting more niche players.
Key Drivers of Polish Water Treatment Chemicals Market Growth
Several factors are driving the growth of the Polish water treatment chemicals market:
- Stringent Environmental Regulations: The Polish government's emphasis on protecting water resources has resulted in stringent environmental regulations, mandating the adoption of advanced water treatment technologies and chemicals.
- Expanding Industrialization: The growth of various industrial sectors, particularly manufacturing and energy, is increasing the demand for water treatment solutions.
- Rising Urbanization: The increasing urban population contributes to a higher demand for clean water and wastewater treatment services.
- Investments in Water Infrastructure: Government initiatives and private investments in upgrading water infrastructure are creating significant opportunities for water treatment chemical suppliers.
Challenges in the Polish Water Treatment Chemicals Market Sector
The Polish water treatment chemicals market faces several challenges:
- Price Volatility of Raw Materials: Fluctuations in the price of raw materials used in the production of these chemicals can impact profitability and pricing strategies.
- Stringent Regulatory Compliance: Meeting the ever-evolving environmental regulations can be costly and complex.
- Competition from Established Players: The market is characterized by a presence of established multinational players which poses a challenge to smaller and newer entrants.
These factors can significantly affect the market dynamics and the profitability of companies operating within this sector.
Emerging Opportunities in Polish Water Treatment Chemicals Market
Emerging trends present promising opportunities:
- Growing Demand for Sustainable Solutions: Increasing consumer and regulatory pressure is driving the demand for eco-friendly and biodegradable water treatment chemicals.
- Technological Advancements: Innovations in membrane technology and advanced oxidation processes offer opportunities for enhanced efficiency and effectiveness.
- Expansion into Agricultural Applications: The growing agricultural sector presents significant growth potential for water treatment chemicals.
Leading Players in the Polish Water Treatment Chemicals Market Market
- Croda International Plc
- Accepta
- Akzo Nobel N.V.
- BASF SE
- Donau Chemie AG
- DuPont de Nemours Inc
- Ecolab
- HELAMIN
- Huntsman International LLC
- Italmatch Chemicals S.p.A
- Kemira
- Kurita Water Industries Ltd
- LANXESS
- Lonza
- SNF
- Solenis
- SUEZ
- Thermax Global
- Veolia
- PCC Group
- List Not Exhaustive
Key Developments in Polish Water Treatment Chemicals Market Industry
- [Month, Year]: [Insert specific development with impact on market dynamics, e.g., "Ecolab launched a new line of environmentally friendly coagulants."]
- [Month, Year]: [Insert specific development with impact on market dynamics, e.g., "Akzo Nobel acquired a Polish water treatment company, expanding its market share."]
- [Month, Year]: [Insert specific development with impact on market dynamics]
- [Month, Year]: [Insert specific development with impact on market dynamics]
- Further developments to be added as available
Strategic Outlook for Polish Water Treatment Chemicals Market Market
The Polish water treatment chemicals market is poised for sustained growth, driven by a combination of factors including stringent environmental regulations, the expanding industrial base, and increased investments in water infrastructure. Opportunities exist for companies focusing on innovative, sustainable, and cost-effective solutions. Strategic partnerships and collaborations will be crucial for success in this evolving market. Focusing on niche applications and offering customized solutions will also be key differentiators. The market's future potential hinges on the ongoing development of advanced technologies and the continuous adaptation to evolving environmental regulations.
Polish Water Treatment Chemicals Market Segmentation
-
1. Product
-
1.1. Flocculants
- 1.1.1. Natural
-
1.1.2. Artificial
- 1.1.2.1. Organic
- 1.1.2.2. Inorganic
- 1.2. Coagulants
- 1.3. Biocides and Disinfectants
- 1.4. Defoamer and Defoaming Agents
- 1.5. pH Adjuster and Softeners
- 1.6. Corrosion Inhibitors
- 1.7. Scale Inhibitors
- 1.8. Other Products
-
1.1. Flocculants
-
2. End-user Industry
- 2.1. Power
- 2.2. Oil and Gas
- 2.3. Chemical Manufacturing (including Petrochemicals)
- 2.4. Mining & Mineral Processing
- 2.5. Municipal
- 2.6. Food and Beverage
- 2.7. Pulp and Paper
- 2.8. Other En
Polish Water Treatment Chemicals Market Segmentation By Geography
-
1. North America
- 1.1. United States
- 1.2. Canada
- 1.3. Mexico
-
2. South America
- 2.1. Brazil
- 2.2. Argentina
- 2.3. Rest of South America
-
3. Europe
- 3.1. United Kingdom
- 3.2. Germany
- 3.3. France
- 3.4. Italy
- 3.5. Spain
- 3.6. Russia
- 3.7. Benelux
- 3.8. Nordics
- 3.9. Rest of Europe
-
4. Middle East & Africa
- 4.1. Turkey
- 4.2. Israel
- 4.3. GCC
- 4.4. North Africa
- 4.5. South Africa
- 4.6. Rest of Middle East & Africa
-
5. Asia Pacific
- 5.1. China
- 5.2. India
- 5.3. Japan
- 5.4. South Korea
- 5.5. ASEAN
- 5.6. Oceania
- 5.7. Rest of Asia Pacific
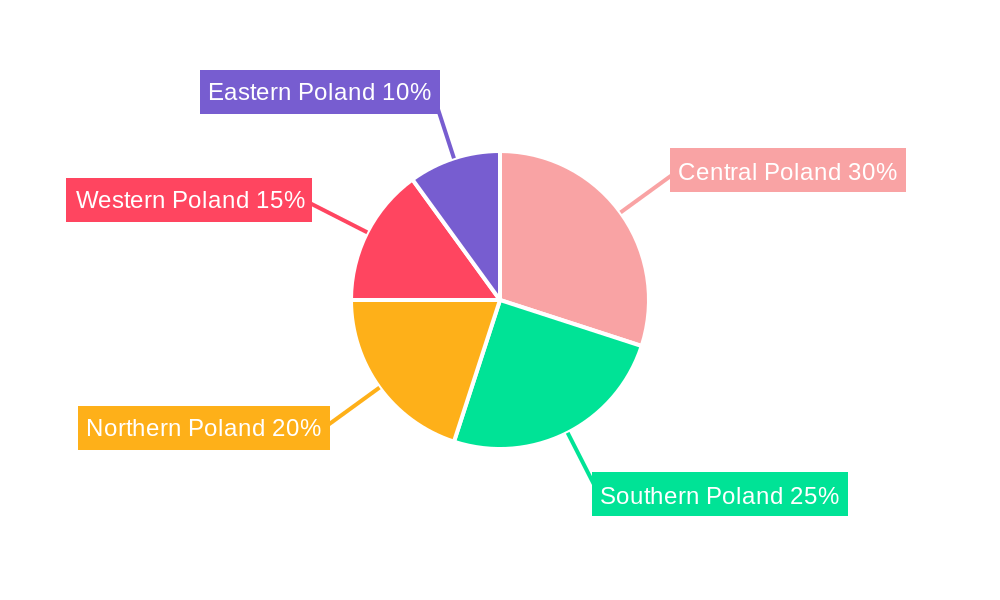
Polish Water Treatment Chemicals Market Regional Market Share
Geographic Coverage of Polish Water Treatment Chemicals Market
Polish Water Treatment Chemicals Market REPORT HIGHLIGHTS
| Aspects | Details |
|---|---|
| Study Period | 2020-2034 |
| Base Year | 2025 |
| Estimated Year | 2026 |
| Forecast Period | 2026-2034 |
| Historical Period | 2020-2025 |
| Growth Rate | CAGR of 6.1% from 2020-2034 |
| Segmentation |
|
Table of Contents
- 1. Introduction
- 1.1. Research Scope
- 1.2. Market Segmentation
- 1.3. Research Objective
- 1.4. Definitions and Assumptions
- 2. Executive Summary
- 2.1. Market Snapshot
- 3. Market Dynamics
- 3.1. Market Drivers
- 3.2. Market Restrains
- 3.3. Market Trends
- 3.4. Market Opportunities
- 4. Market Factor Analysis
- 4.1. Porters Five Forces
- 4.1.1. Bargaining Power of Suppliers
- 4.1.2. Bargaining Power of Buyers
- 4.1.3. Threat of New Entrants
- 4.1.4. Threat of Substitutes
- 4.1.5. Competitive Rivalry
- 4.2. PESTEL analysis
- 4.3. BCG Analysis
- 4.3.1. Stars (High Growth, High Market Share)
- 4.3.2. Cash Cows (Low Growth, High Market Share)
- 4.3.3. Question Mark (High Growth, Low Market Share)
- 4.3.4. Dogs (Low Growth, Low Market Share)
- 4.4. Ansoff Matrix Analysis
- 4.5. Supply Chain Analysis
- 4.6. Regulatory Landscape
- 4.7. Current Market Potential and Opportunity Assessment (TAM–SAM–SOM Framework)
- 4.8. RAX Analyst Note
- 4.1. Porters Five Forces
- 5. Market Analysis, Insights and Forecast 2021-2033
- 5.1. Market Analysis, Insights and Forecast - by Product
- 5.1.1. Flocculants
- 5.1.1.1. Natural
- 5.1.1.2. Artificial
- 5.1.1.2.1. Organic
- 5.1.1.2.2. Inorganic
- 5.1.2. Coagulants
- 5.1.3. Biocides and Disinfectants
- 5.1.4. Defoamer and Defoaming Agents
- 5.1.5. pH Adjuster and Softeners
- 5.1.6. Corrosion Inhibitors
- 5.1.7. Scale Inhibitors
- 5.1.8. Other Products
- 5.1.1. Flocculants
- 5.2. Market Analysis, Insights and Forecast - by End-user Industry
- 5.2.1. Power
- 5.2.2. Oil and Gas
- 5.2.3. Chemical Manufacturing (including Petrochemicals)
- 5.2.4. Mining & Mineral Processing
- 5.2.5. Municipal
- 5.2.6. Food and Beverage
- 5.2.7. Pulp and Paper
- 5.2.8. Other En
- 5.3. Market Analysis, Insights and Forecast - by Region
- 5.3.1. North America
- 5.3.2. South America
- 5.3.3. Europe
- 5.3.4. Middle East & Africa
- 5.3.5. Asia Pacific
- 5.1. Market Analysis, Insights and Forecast - by Product
- 6. Global Polish Water Treatment Chemicals Market Analysis, Insights and Forecast, 2021-2033
- 6.1. Market Analysis, Insights and Forecast - by Product
- 6.1.1. Flocculants
- 6.1.1.1. Natural
- 6.1.1.2. Artificial
- 6.1.1.2.1. Organic
- 6.1.1.2.2. Inorganic
- 6.1.2. Coagulants
- 6.1.3. Biocides and Disinfectants
- 6.1.4. Defoamer and Defoaming Agents
- 6.1.5. pH Adjuster and Softeners
- 6.1.6. Corrosion Inhibitors
- 6.1.7. Scale Inhibitors
- 6.1.8. Other Products
- 6.1.1. Flocculants
- 6.2. Market Analysis, Insights and Forecast - by End-user Industry
- 6.2.1. Power
- 6.2.2. Oil and Gas
- 6.2.3. Chemical Manufacturing (including Petrochemicals)
- 6.2.4. Mining & Mineral Processing
- 6.2.5. Municipal
- 6.2.6. Food and Beverage
- 6.2.7. Pulp and Paper
- 6.2.8. Other En
- 6.1. Market Analysis, Insights and Forecast - by Product
- 7. North America Polish Water Treatment Chemicals Market Analysis, Insights and Forecast, 2020-2032
- 7.1. Market Analysis, Insights and Forecast - by Product
- 7.1.1. Flocculants
- 7.1.1.1. Natural
- 7.1.1.2. Artificial
- 7.1.1.2.1. Organic
- 7.1.1.2.2. Inorganic
- 7.1.2. Coagulants
- 7.1.3. Biocides and Disinfectants
- 7.1.4. Defoamer and Defoaming Agents
- 7.1.5. pH Adjuster and Softeners
- 7.1.6. Corrosion Inhibitors
- 7.1.7. Scale Inhibitors
- 7.1.8. Other Products
- 7.1.1. Flocculants
- 7.2. Market Analysis, Insights and Forecast - by End-user Industry
- 7.2.1. Power
- 7.2.2. Oil and Gas
- 7.2.3. Chemical Manufacturing (including Petrochemicals)
- 7.2.4. Mining & Mineral Processing
- 7.2.5. Municipal
- 7.2.6. Food and Beverage
- 7.2.7. Pulp and Paper
- 7.2.8. Other En
- 7.1. Market Analysis, Insights and Forecast - by Product
- 8. South America Polish Water Treatment Chemicals Market Analysis, Insights and Forecast, 2020-2032
- 8.1. Market Analysis, Insights and Forecast - by Product
- 8.1.1. Flocculants
- 8.1.1.1. Natural
- 8.1.1.2. Artificial
- 8.1.1.2.1. Organic
- 8.1.1.2.2. Inorganic
- 8.1.2. Coagulants
- 8.1.3. Biocides and Disinfectants
- 8.1.4. Defoamer and Defoaming Agents
- 8.1.5. pH Adjuster and Softeners
- 8.1.6. Corrosion Inhibitors
- 8.1.7. Scale Inhibitors
- 8.1.8. Other Products
- 8.1.1. Flocculants
- 8.2. Market Analysis, Insights and Forecast - by End-user Industry
- 8.2.1. Power
- 8.2.2. Oil and Gas
- 8.2.3. Chemical Manufacturing (including Petrochemicals)
- 8.2.4. Mining & Mineral Processing
- 8.2.5. Municipal
- 8.2.6. Food and Beverage
- 8.2.7. Pulp and Paper
- 8.2.8. Other En
- 8.1. Market Analysis, Insights and Forecast - by Product
- 9. Europe Polish Water Treatment Chemicals Market Analysis, Insights and Forecast, 2020-2032
- 9.1. Market Analysis, Insights and Forecast - by Product
- 9.1.1. Flocculants
- 9.1.1.1. Natural
- 9.1.1.2. Artificial
- 9.1.1.2.1. Organic
- 9.1.1.2.2. Inorganic
- 9.1.2. Coagulants
- 9.1.3. Biocides and Disinfectants
- 9.1.4. Defoamer and Defoaming Agents
- 9.1.5. pH Adjuster and Softeners
- 9.1.6. Corrosion Inhibitors
- 9.1.7. Scale Inhibitors
- 9.1.8. Other Products
- 9.1.1. Flocculants
- 9.2. Market Analysis, Insights and Forecast - by End-user Industry
- 9.2.1. Power
- 9.2.2. Oil and Gas
- 9.2.3. Chemical Manufacturing (including Petrochemicals)
- 9.2.4. Mining & Mineral Processing
- 9.2.5. Municipal
- 9.2.6. Food and Beverage
- 9.2.7. Pulp and Paper
- 9.2.8. Other En
- 9.1. Market Analysis, Insights and Forecast - by Product
- 10. Middle East & Africa Polish Water Treatment Chemicals Market Analysis, Insights and Forecast, 2020-2032
- 10.1. Market Analysis, Insights and Forecast - by Product
- 10.1.1. Flocculants
- 10.1.1.1. Natural
- 10.1.1.2. Artificial
- 10.1.1.2.1. Organic
- 10.1.1.2.2. Inorganic
- 10.1.2. Coagulants
- 10.1.3. Biocides and Disinfectants
- 10.1.4. Defoamer and Defoaming Agents
- 10.1.5. pH Adjuster and Softeners
- 10.1.6. Corrosion Inhibitors
- 10.1.7. Scale Inhibitors
- 10.1.8. Other Products
- 10.1.1. Flocculants
- 10.2. Market Analysis, Insights and Forecast - by End-user Industry
- 10.2.1. Power
- 10.2.2. Oil and Gas
- 10.2.3. Chemical Manufacturing (including Petrochemicals)
- 10.2.4. Mining & Mineral Processing
- 10.2.5. Municipal
- 10.2.6. Food and Beverage
- 10.2.7. Pulp and Paper
- 10.2.8. Other En
- 10.1. Market Analysis, Insights and Forecast - by Product
- 11. Asia Pacific Polish Water Treatment Chemicals Market Analysis, Insights and Forecast, 2020-2032
- 11.1. Market Analysis, Insights and Forecast - by Product
- 11.1.1. Flocculants
- 11.1.1.1. Natural
- 11.1.1.2. Artificial
- 11.1.1.2.1. Organic
- 11.1.1.2.2. Inorganic
- 11.1.2. Coagulants
- 11.1.3. Biocides and Disinfectants
- 11.1.4. Defoamer and Defoaming Agents
- 11.1.5. pH Adjuster and Softeners
- 11.1.6. Corrosion Inhibitors
- 11.1.7. Scale Inhibitors
- 11.1.8. Other Products
- 11.1.1. Flocculants
- 11.2. Market Analysis, Insights and Forecast - by End-user Industry
- 11.2.1. Power
- 11.2.2. Oil and Gas
- 11.2.3. Chemical Manufacturing (including Petrochemicals)
- 11.2.4. Mining & Mineral Processing
- 11.2.5. Municipal
- 11.2.6. Food and Beverage
- 11.2.7. Pulp and Paper
- 11.2.8. Other En
- 11.1. Market Analysis, Insights and Forecast - by Product
- 12. Competitive Analysis
- 12.1. Company Profiles
- 12.1.1 Croda International Plc
- 12.1.1.1. Company Overview
- 12.1.1.2. Products
- 12.1.1.3. Company Financials
- 12.1.1.4. SWOT Analysis
- 12.1.2 Accepta
- 12.1.2.1. Company Overview
- 12.1.2.2. Products
- 12.1.2.3. Company Financials
- 12.1.2.4. SWOT Analysis
- 12.1.3 Akzo Nobel N V
- 12.1.3.1. Company Overview
- 12.1.3.2. Products
- 12.1.3.3. Company Financials
- 12.1.3.4. SWOT Analysis
- 12.1.4 BASF SE
- 12.1.4.1. Company Overview
- 12.1.4.2. Products
- 12.1.4.3. Company Financials
- 12.1.4.4. SWOT Analysis
- 12.1.5 Donau Chemie AG
- 12.1.5.1. Company Overview
- 12.1.5.2. Products
- 12.1.5.3. Company Financials
- 12.1.5.4. SWOT Analysis
- 12.1.6 DuPont de Nemours Inc
- 12.1.6.1. Company Overview
- 12.1.6.2. Products
- 12.1.6.3. Company Financials
- 12.1.6.4. SWOT Analysis
- 12.1.7 Ecolab
- 12.1.7.1. Company Overview
- 12.1.7.2. Products
- 12.1.7.3. Company Financials
- 12.1.7.4. SWOT Analysis
- 12.1.8 HELAMIN
- 12.1.8.1. Company Overview
- 12.1.8.2. Products
- 12.1.8.3. Company Financials
- 12.1.8.4. SWOT Analysis
- 12.1.9 Huntsman International LLC
- 12.1.9.1. Company Overview
- 12.1.9.2. Products
- 12.1.9.3. Company Financials
- 12.1.9.4. SWOT Analysis
- 12.1.10 Italmatch Chemicals S p A
- 12.1.10.1. Company Overview
- 12.1.10.2. Products
- 12.1.10.3. Company Financials
- 12.1.10.4. SWOT Analysis
- 12.1.11 Kemira
- 12.1.11.1. Company Overview
- 12.1.11.2. Products
- 12.1.11.3. Company Financials
- 12.1.11.4. SWOT Analysis
- 12.1.12 Kurita Water Industries Ltd
- 12.1.12.1. Company Overview
- 12.1.12.2. Products
- 12.1.12.3. Company Financials
- 12.1.12.4. SWOT Analysis
- 12.1.13 LANXESS
- 12.1.13.1. Company Overview
- 12.1.13.2. Products
- 12.1.13.3. Company Financials
- 12.1.13.4. SWOT Analysis
- 12.1.14 Lonza
- 12.1.14.1. Company Overview
- 12.1.14.2. Products
- 12.1.14.3. Company Financials
- 12.1.14.4. SWOT Analysis
- 12.1.15 SNF
- 12.1.15.1. Company Overview
- 12.1.15.2. Products
- 12.1.15.3. Company Financials
- 12.1.15.4. SWOT Analysis
- 12.1.16 Solenis
- 12.1.16.1. Company Overview
- 12.1.16.2. Products
- 12.1.16.3. Company Financials
- 12.1.16.4. SWOT Analysis
- 12.1.17 SUEZ
- 12.1.17.1. Company Overview
- 12.1.17.2. Products
- 12.1.17.3. Company Financials
- 12.1.17.4. SWOT Analysis
- 12.1.18 Thermax Global
- 12.1.18.1. Company Overview
- 12.1.18.2. Products
- 12.1.18.3. Company Financials
- 12.1.18.4. SWOT Analysis
- 12.1.19 Veolia
- 12.1.19.1. Company Overview
- 12.1.19.2. Products
- 12.1.19.3. Company Financials
- 12.1.19.4. SWOT Analysis
- 12.1.20 PCC Group*List Not Exhaustive
- 12.1.20.1. Company Overview
- 12.1.20.2. Products
- 12.1.20.3. Company Financials
- 12.1.20.4. SWOT Analysis
- 12.1.1 Croda International Plc
- 12.2. Market Entropy
- 12.2.1 Company's Key Areas Served
- 12.2.2 Recent Developments
- 12.3. Company Market Share Analysis 2025
- 12.3.1 Top 5 Companies Market Share Analysis
- 12.3.2 Top 3 Companies Market Share Analysis
- 12.4. List of Potential Customers
- 13. Research Methodology
List of Figures
- Figure 1: Global Polish Water Treatment Chemicals Market Revenue Breakdown (billion, %) by Region 2025 & 2033
- Figure 2: North America Polish Water Treatment Chemicals Market Revenue (billion), by Product 2025 & 2033
- Figure 3: North America Polish Water Treatment Chemicals Market Revenue Share (%), by Product 2025 & 2033
- Figure 4: North America Polish Water Treatment Chemicals Market Revenue (billion), by End-user Industry 2025 & 2033
- Figure 5: North America Polish Water Treatment Chemicals Market Revenue Share (%), by End-user Industry 2025 & 2033
- Figure 6: North America Polish Water Treatment Chemicals Market Revenue (billion), by Country 2025 & 2033
- Figure 7: North America Polish Water Treatment Chemicals Market Revenue Share (%), by Country 2025 & 2033
- Figure 8: South America Polish Water Treatment Chemicals Market Revenue (billion), by Product 2025 & 2033
- Figure 9: South America Polish Water Treatment Chemicals Market Revenue Share (%), by Product 2025 & 2033
- Figure 10: South America Polish Water Treatment Chemicals Market Revenue (billion), by End-user Industry 2025 & 2033
- Figure 11: South America Polish Water Treatment Chemicals Market Revenue Share (%), by End-user Industry 2025 & 2033
- Figure 12: South America Polish Water Treatment Chemicals Market Revenue (billion), by Country 2025 & 2033
- Figure 13: South America Polish Water Treatment Chemicals Market Revenue Share (%), by Country 2025 & 2033
- Figure 14: Europe Polish Water Treatment Chemicals Market Revenue (billion), by Product 2025 & 2033
- Figure 15: Europe Polish Water Treatment Chemicals Market Revenue Share (%), by Product 2025 & 2033
- Figure 16: Europe Polish Water Treatment Chemicals Market Revenue (billion), by End-user Industry 2025 & 2033
- Figure 17: Europe Polish Water Treatment Chemicals Market Revenue Share (%), by End-user Industry 2025 & 2033
- Figure 18: Europe Polish Water Treatment Chemicals Market Revenue (billion), by Country 2025 & 2033
- Figure 19: Europe Polish Water Treatment Chemicals Market Revenue Share (%), by Country 2025 & 2033
- Figure 20: Middle East & Africa Polish Water Treatment Chemicals Market Revenue (billion), by Product 2025 & 2033
- Figure 21: Middle East & Africa Polish Water Treatment Chemicals Market Revenue Share (%), by Product 2025 & 2033
- Figure 22: Middle East & Africa Polish Water Treatment Chemicals Market Revenue (billion), by End-user Industry 2025 & 2033
- Figure 23: Middle East & Africa Polish Water Treatment Chemicals Market Revenue Share (%), by End-user Industry 2025 & 2033
- Figure 24: Middle East & Africa Polish Water Treatment Chemicals Market Revenue (billion), by Country 2025 & 2033
- Figure 25: Middle East & Africa Polish Water Treatment Chemicals Market Revenue Share (%), by Country 2025 & 2033
- Figure 26: Asia Pacific Polish Water Treatment Chemicals Market Revenue (billion), by Product 2025 & 2033
- Figure 27: Asia Pacific Polish Water Treatment Chemicals Market Revenue Share (%), by Product 2025 & 2033
- Figure 28: Asia Pacific Polish Water Treatment Chemicals Market Revenue (billion), by End-user Industry 2025 & 2033
- Figure 29: Asia Pacific Polish Water Treatment Chemicals Market Revenue Share (%), by End-user Industry 2025 & 2033
- Figure 30: Asia Pacific Polish Water Treatment Chemicals Market Revenue (billion), by Country 2025 & 2033
- Figure 31: Asia Pacific Polish Water Treatment Chemicals Market Revenue Share (%), by Country 2025 & 2033
List of Tables
- Table 1: Global Polish Water Treatment Chemicals Market Revenue billion Forecast, by Product 2020 & 2033
- Table 2: Global Polish Water Treatment Chemicals Market Revenue billion Forecast, by End-user Industry 2020 & 2033
- Table 3: Global Polish Water Treatment Chemicals Market Revenue billion Forecast, by Region 2020 & 2033
- Table 4: Global Polish Water Treatment Chemicals Market Revenue billion Forecast, by Product 2020 & 2033
- Table 5: Global Polish Water Treatment Chemicals Market Revenue billion Forecast, by End-user Industry 2020 & 2033
- Table 6: Global Polish Water Treatment Chemicals Market Revenue billion Forecast, by Country 2020 & 2033
- Table 7: United States Polish Water Treatment Chemicals Market Revenue (billion) Forecast, by Application 2020 & 2033
- Table 8: Canada Polish Water Treatment Chemicals Market Revenue (billion) Forecast, by Application 2020 & 2033
- Table 9: Mexico Polish Water Treatment Chemicals Market Revenue (billion) Forecast, by Application 2020 & 2033
- Table 10: Global Polish Water Treatment Chemicals Market Revenue billion Forecast, by Product 2020 & 2033
- Table 11: Global Polish Water Treatment Chemicals Market Revenue billion Forecast, by End-user Industry 2020 & 2033
- Table 12: Global Polish Water Treatment Chemicals Market Revenue billion Forecast, by Country 2020 & 2033
- Table 13: Brazil Polish Water Treatment Chemicals Market Revenue (billion) Forecast, by Application 2020 & 2033
- Table 14: Argentina Polish Water Treatment Chemicals Market Revenue (billion) Forecast, by Application 2020 & 2033
- Table 15: Rest of South America Polish Water Treatment Chemicals Market Revenue (billion) Forecast, by Application 2020 & 2033
- Table 16: Global Polish Water Treatment Chemicals Market Revenue billion Forecast, by Product 2020 & 2033
- Table 17: Global Polish Water Treatment Chemicals Market Revenue billion Forecast, by End-user Industry 2020 & 2033
- Table 18: Global Polish Water Treatment Chemicals Market Revenue billion Forecast, by Country 2020 & 2033
- Table 19: United Kingdom Polish Water Treatment Chemicals Market Revenue (billion) Forecast, by Application 2020 & 2033
- Table 20: Germany Polish Water Treatment Chemicals Market Revenue (billion) Forecast, by Application 2020 & 2033
- Table 21: France Polish Water Treatment Chemicals Market Revenue (billion) Forecast, by Application 2020 & 2033
- Table 22: Italy Polish Water Treatment Chemicals Market Revenue (billion) Forecast, by Application 2020 & 2033
- Table 23: Spain Polish Water Treatment Chemicals Market Revenue (billion) Forecast, by Application 2020 & 2033
- Table 24: Russia Polish Water Treatment Chemicals Market Revenue (billion) Forecast, by Application 2020 & 2033
- Table 25: Benelux Polish Water Treatment Chemicals Market Revenue (billion) Forecast, by Application 2020 & 2033
- Table 26: Nordics Polish Water Treatment Chemicals Market Revenue (billion) Forecast, by Application 2020 & 2033
- Table 27: Rest of Europe Polish Water Treatment Chemicals Market Revenue (billion) Forecast, by Application 2020 & 2033
- Table 28: Global Polish Water Treatment Chemicals Market Revenue billion Forecast, by Product 2020 & 2033
- Table 29: Global Polish Water Treatment Chemicals Market Revenue billion Forecast, by End-user Industry 2020 & 2033
- Table 30: Global Polish Water Treatment Chemicals Market Revenue billion Forecast, by Country 2020 & 2033
- Table 31: Turkey Polish Water Treatment Chemicals Market Revenue (billion) Forecast, by Application 2020 & 2033
- Table 32: Israel Polish Water Treatment Chemicals Market Revenue (billion) Forecast, by Application 2020 & 2033
- Table 33: GCC Polish Water Treatment Chemicals Market Revenue (billion) Forecast, by Application 2020 & 2033
- Table 34: North Africa Polish Water Treatment Chemicals Market Revenue (billion) Forecast, by Application 2020 & 2033
- Table 35: South Africa Polish Water Treatment Chemicals Market Revenue (billion) Forecast, by Application 2020 & 2033
- Table 36: Rest of Middle East & Africa Polish Water Treatment Chemicals Market Revenue (billion) Forecast, by Application 2020 & 2033
- Table 37: Global Polish Water Treatment Chemicals Market Revenue billion Forecast, by Product 2020 & 2033
- Table 38: Global Polish Water Treatment Chemicals Market Revenue billion Forecast, by End-user Industry 2020 & 2033
- Table 39: Global Polish Water Treatment Chemicals Market Revenue billion Forecast, by Country 2020 & 2033
- Table 40: China Polish Water Treatment Chemicals Market Revenue (billion) Forecast, by Application 2020 & 2033
- Table 41: India Polish Water Treatment Chemicals Market Revenue (billion) Forecast, by Application 2020 & 2033
- Table 42: Japan Polish Water Treatment Chemicals Market Revenue (billion) Forecast, by Application 2020 & 2033
- Table 43: South Korea Polish Water Treatment Chemicals Market Revenue (billion) Forecast, by Application 2020 & 2033
- Table 44: ASEAN Polish Water Treatment Chemicals Market Revenue (billion) Forecast, by Application 2020 & 2033
- Table 45: Oceania Polish Water Treatment Chemicals Market Revenue (billion) Forecast, by Application 2020 & 2033
- Table 46: Rest of Asia Pacific Polish Water Treatment Chemicals Market Revenue (billion) Forecast, by Application 2020 & 2033
Frequently Asked Questions
1. What is the projected Compound Annual Growth Rate (CAGR) of the Polish Water Treatment Chemicals Market?
The projected CAGR is approximately 6.1%.
2. Which companies are prominent players in the Polish Water Treatment Chemicals Market?
Key companies in the market include Croda International Plc, Accepta, Akzo Nobel N V, BASF SE, Donau Chemie AG, DuPont de Nemours Inc, Ecolab, HELAMIN, Huntsman International LLC, Italmatch Chemicals S p A, Kemira, Kurita Water Industries Ltd, LANXESS, Lonza, SNF, Solenis, SUEZ, Thermax Global, Veolia, PCC Group*List Not Exhaustive.
3. What are the main segments of the Polish Water Treatment Chemicals Market?
The market segments include Product, End-user Industry.
4. Can you provide details about the market size?
The market size is estimated to be USD 46.11 billion as of 2022.
5. What are some drivers contributing to market growth?
N/A
6. What are the notable trends driving market growth?
Increasing Demand for Biocides and Disinfectants.
7. Are there any restraints impacting market growth?
N/A
8. Can you provide examples of recent developments in the market?
N/A
9. What pricing options are available for accessing the report?
Pricing options include single-user, multi-user, and enterprise licenses priced at USD 3800, USD 4500, and USD 5800 respectively.
10. Is the market size provided in terms of value or volume?
The market size is provided in terms of value, measured in billion.
11. Are there any specific market keywords associated with the report?
Yes, the market keyword associated with the report is "Polish Water Treatment Chemicals Market," which aids in identifying and referencing the specific market segment covered.
12. How do I determine which pricing option suits my needs best?
The pricing options vary based on user requirements and access needs. Individual users may opt for single-user licenses, while businesses requiring broader access may choose multi-user or enterprise licenses for cost-effective access to the report.
13. Are there any additional resources or data provided in the Polish Water Treatment Chemicals Market report?
While the report offers comprehensive insights, it's advisable to review the specific contents or supplementary materials provided to ascertain if additional resources or data are available.
14. How can I stay updated on further developments or reports in the Polish Water Treatment Chemicals Market?
To stay informed about further developments, trends, and reports in the Polish Water Treatment Chemicals Market, consider subscribing to industry newsletters, following relevant companies and organizations, or regularly checking reputable industry news sources and publications.
Methodology
Step 1 - Identification of Relevant Samples Size from Population Database


Step 2 - Approaches for Defining Global Market Size (Value, Volume* & Price*)

Note*: In applicable scenarios
Step 3 - Data Sources
Primary Research
- Web Analytics
- Survey Reports
- Research Institute
- Latest Research Reports
- Opinion Leaders
Secondary Research
- Annual Reports
- White Paper
- Latest Press Release
- Industry Association
- Paid Database
- Investor Presentations

Step 4 - Data Triangulation
Involves using different sources of information in order to increase the validity of a study
These sources are likely to be stakeholders in a program - participants, other researchers, program staff, other community members, and so on.
Then we put all data in single framework & apply various statistical tools to find out the dynamic on the market.
During the analysis stage, feedback from the stakeholder groups would be compared to determine areas of agreement as well as areas of divergence