

Key Insights
The global polyether amine market is poised for substantial expansion, driven by increasing demand across diverse applications. Projections indicate a market size of 9.05 billion by 2025, with a Compound Annual Growth Rate (CAGR) of 13.56%. Key growth catalysts include the robust polyurea coatings sector, favored for its exceptional durability and rapid curing in infrastructure and protective applications. The automotive and aerospace industries significantly contribute to demand through their use in fuel additives and high-performance composites. Furthermore, the widespread adoption of epoxy coatings in construction and electronics bolsters market growth. Specialized amine types, such as di- and tri-amines, are gaining traction for their superior performance characteristics. While supply chain complexities and raw material price volatility present challenges, technological advancements enhancing efficiency and cost-effectiveness are mitigating these restraints. The Asia-Pacific region, led by China and India's industrialization, is expected to spearhead growth, with North America and Europe maintaining significant shares due to mature industries and advanced technology adoption.
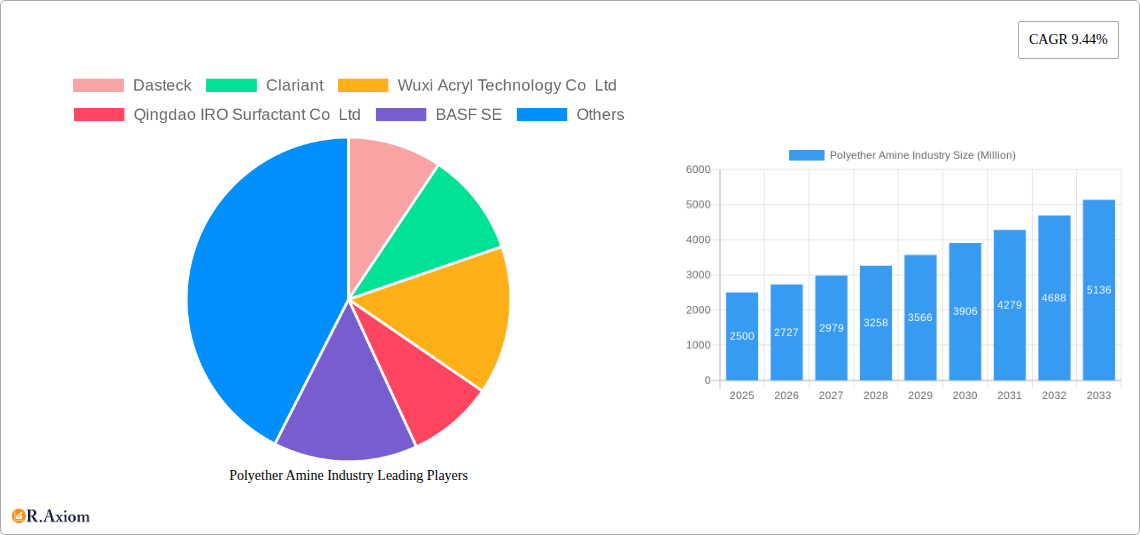
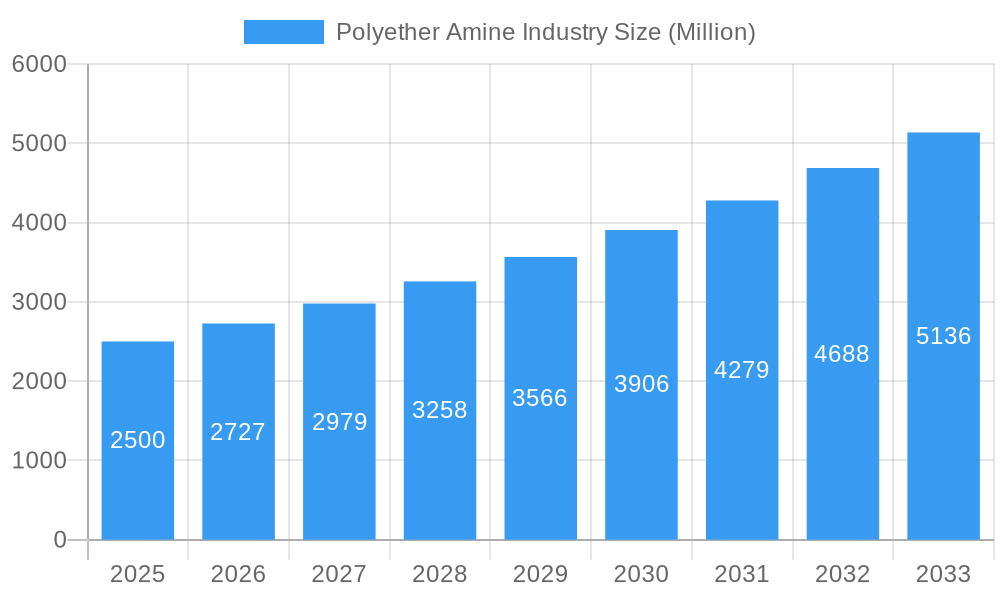
Polyether Amine Industry Market Size (In Billion)
The competitive landscape features a blend of multinational corporations and regional manufacturers. Leading entities like BASF SE and Huntsman International LLC drive innovation through extensive R&D to meet evolving market demands. The presence of numerous regional players, particularly in Asia, underscores localized demand and growth opportunities. Future market trajectory will be shaped by ongoing research into novel applications, the development of sustainable and eco-friendly formulations, and regulatory landscapes promoting environmentally sound materials. Expect continued innovation and market consolidation through capacity expansions and strategic partnerships. Success will hinge on specializing in niche applications and addressing specific regional requirements within this dynamic market.
Polyether Amine Industry Company Market Share
This comprehensive analysis delves into the Polyether Amine industry, covering market size, segmentation, growth drivers, challenges, and key players. The report encompasses the historical period (2019-2024), base year (2025), and forecast period (2025-2033), delivering actionable insights for stakeholders across the value chain.
Polyether Amine Industry Market Concentration & Innovation
The Polyether Amine market exhibits a moderately concentrated landscape, with key players like BASF SE, Huntsman International LLC, and Clariant holding significant market share. However, the presence of several regional and specialized players indicates a dynamic competitive environment. Market share data for 2024 suggests BASF SE holds approximately xx% of the market, followed by Huntsman International LLC at xx% and Clariant at xx%. Innovation in the industry is driven by the need for enhanced performance characteristics, such as improved curing speed, flexibility, and durability in applications like coatings and adhesives. Regulatory frameworks, particularly concerning environmental regulations and safety standards, significantly influence product development and market access. Product substitutes, such as other types of amines and polyols, present competitive pressures. End-user trends towards higher-performance materials and sustainable solutions continue to shape industry innovation. M&A activities, while not frequent, have played a role in shaping the market structure. For example, while specific deal values are not publicly available for all transactions, the partnership between Brenntag and BASF in 2022 signifies a strategic move to enhance distribution reach. Overall, the market shows a balance between established players and emerging innovators driving ongoing evolution.
Polyether Amine Industry Industry Trends & Insights
The Polyether Amine market is experiencing robust growth, with a projected Compound Annual Growth Rate (CAGR) of xx% during the forecast period (2025-2033). This growth is fueled by several factors, including increasing demand from various end-use sectors, technological advancements leading to improved product performance, and the growing adoption of sustainable practices across industries. The rising popularity of polyurea coatings, for instance, is significantly driving the demand for polyether amines. Market penetration in specific applications, such as epoxy coatings and adhesives, continues to grow, especially in developing economies. Technological disruptions, such as the development of novel catalyst systems and advanced polymerization techniques, are enabling the production of more efficient and versatile polyether amines. Consumer preferences for high-performance materials with enhanced properties, like durability and flexibility, further stimulate market growth. The competitive landscape is dynamic, with existing players focusing on capacity expansion and new product development to maintain market share. Price fluctuations in raw materials and global economic conditions, however, pose potential challenges to sustained growth.
Dominant Markets & Segments in Polyether Amine Industry
Dominant Regions & Countries: The Asia-Pacific region is anticipated to dominate the Polyether Amine market during the forecast period, driven by robust economic growth, increasing industrialization, and expanding infrastructure development in countries like China and India. Europe and North America will remain significant markets due to established industrial bases and a high demand for high-performance materials.
Dominant Segments:
By Type: Diamine currently holds the largest market share among the different types (monoamine, diamine, triamine) owing to its versatile applications across various industries.
By Application: Polyurea coatings represent the most significant segment by application. This is attributed to its superior properties like high abrasion resistance, rapid curing, and waterproofing capabilities, which are highly sought after in several sectors including construction and infrastructure.
Key Drivers for Dominance:
- Asia-Pacific: Rapid industrialization, infrastructure development, favorable government policies, and a growing automotive industry are major contributors to the region’s dominance.
- Diamine: Versatility in applications and compatibility with various resins and curing agents contribute to its market leadership.
- Polyurea Coatings: Superior performance characteristics and widespread applications in diverse industries contribute to its high demand.
Polyether Amine Industry Product Developments
Recent product developments focus on creating polyether amines with enhanced properties like improved thermal stability, faster curing times, and better adhesion. These advancements cater to the rising demand for high-performance materials in diverse applications, including aerospace, automotive, and construction. Technological advancements in catalyst systems and polymerization techniques are driving the creation of more sustainable and cost-effective products. Companies are also focusing on developing specialized polyether amines tailored for specific applications to gain competitive advantages.
Report Scope & Segmentation Analysis
The report segments the Polyether Amine market based on Type (Monoamine, Diamine, Triamine) and Application (Polyurea, Fuel Additives, Composites, Epoxy Coatings, Adhesives and Sealants, Other Applications). Each segment’s growth projections, market size (in Million), and competitive dynamics are analyzed. For instance, the Diamine segment is expected to witness significant growth due to its versatility, while the Polyurea application segment shows strong potential driven by its robust properties.
Key Drivers of Polyether Amine Industry Growth
The Polyether Amine industry's growth is propelled by several factors. Increasing demand from the construction and automotive industries, driven by infrastructure development and vehicle production, is a primary driver. Technological advancements resulting in improved material properties and processing efficiency also contribute significantly. Furthermore, government regulations favoring sustainable and environmentally friendly materials are fostering the adoption of polyether amines in various applications.
Challenges in the Polyether Amine Industry Sector
The Polyether Amine industry faces challenges, including fluctuations in raw material prices and potential supply chain disruptions. Stringent environmental regulations and safety standards necessitate significant investment in compliance. Intense competition among established players and the emergence of new market entrants also pose challenges. These factors collectively affect production costs and profitability, potentially impacting market growth.
Emerging Opportunities in Polyether Amine Industry
Emerging opportunities lie in the development of bio-based polyether amines and sustainable manufacturing processes. Expanding applications in renewable energy technologies and the growth of advanced composites represent promising avenues. Further market penetration in developing economies and the exploration of niche applications will also contribute to future growth.
Leading Players in the Polyether Amine Industry Market
- Dasteck
- Clariant
- Wuxi Acryl Technology Co Ltd
- Qingdao IRO Surfactant Co Ltd
- BASF SE
- Huntsman International LLC
- Shanghai Chenhua International Trade Co Ltd
- Chia Tai New Materials (Zibo Zhengda Polyurethane Co Ltd)
Key Developments in Polyether Amine Industry Industry
- June 2022: BASF announced the expansion of its production capacity for specialty amines at the Geismar site in North America, expected to be operational by mid-2023, boosting its polyetheramine production under the Baxxodur brand. This signals a significant investment in expanding market share.
- March 2022: Brenntag's collaboration with BASF SE to exclusively distribute its polyetheramines and Baxxodur portfolio in the US and Canada expands BASF's market reach and distribution network. This strategic partnership demonstrates a focus on market penetration.
Strategic Outlook for Polyether Amine Industry Market
The Polyether Amine market holds significant growth potential, driven by increasing demand across various sectors and continuous innovation in product development. The focus on sustainable solutions and the exploration of new applications will shape future market dynamics. Companies strategically investing in capacity expansion, R&D, and strategic partnerships are poised to capitalize on the industry's growth trajectory.
Polyether Amine Industry Segmentation
-
1. Type
- 1.1. Monoamine
- 1.2. Diamine
- 1.3. Triamine
-
2. Application
- 2.1. Polyurea
- 2.2. Fuel Additives
- 2.3. Composites
- 2.4. Epoxy Coatings
- 2.5. Adhesives and Sealants
- 2.6. Other Applications
Polyether Amine Industry Segmentation By Geography
-
1. Asia Pacific
- 1.1. China
- 1.2. India
- 1.3. Japan
- 1.4. South Korea
- 1.5. Rest of Asia Pacific
-
2. North America
- 2.1. United States
- 2.2. Canada
- 2.3. Mexico
-
3. Europe
- 3.1. Germany
- 3.2. United Kingdom
- 3.3. Italy
- 3.4. France
- 3.5. Rest of Europe
-
4. South America
- 4.1. Brazil
- 4.2. Argentina
- 4.3. Rest of South America
-
5. Middle East and Africa
- 5.1. Saudi Arabia
- 5.2. South Africa
- 5.3. Rest of Middle East and Africa
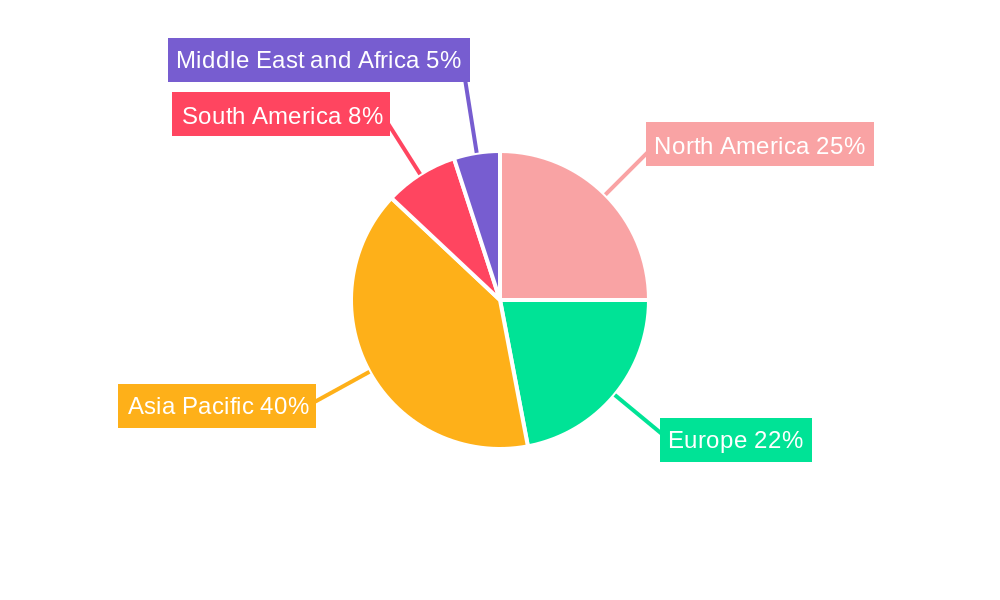
Polyether Amine Industry Regional Market Share
Geographic Coverage of Polyether Amine Industry
Polyether Amine Industry REPORT HIGHLIGHTS
| Aspects | Details |
|---|---|
| Study Period | 2020-2034 |
| Base Year | 2025 |
| Estimated Year | 2026 |
| Forecast Period | 2026-2034 |
| Historical Period | 2020-2025 |
| Growth Rate | CAGR of 13.56% from 2020-2034 |
| Segmentation |
|
Table of Contents
- 1. Introduction
- 1.1. Research Scope
- 1.2. Market Segmentation
- 1.3. Research Objective
- 1.4. Definitions and Assumptions
- 2. Executive Summary
- 2.1. Market Snapshot
- 3. Market Dynamics
- 3.1. Market Drivers
- 3.2. Market Restrains
- 3.3. Market Trends
- 3.4. Market Opportunities
- 4. Market Factor Analysis
- 4.1. Porters Five Forces
- 4.1.1. Bargaining Power of Suppliers
- 4.1.2. Bargaining Power of Buyers
- 4.1.3. Threat of New Entrants
- 4.1.4. Threat of Substitutes
- 4.1.5. Competitive Rivalry
- 4.2. PESTEL analysis
- 4.3. BCG Analysis
- 4.3.1. Stars (High Growth, High Market Share)
- 4.3.2. Cash Cows (Low Growth, High Market Share)
- 4.3.3. Question Mark (High Growth, Low Market Share)
- 4.3.4. Dogs (Low Growth, Low Market Share)
- 4.4. Ansoff Matrix Analysis
- 4.5. Supply Chain Analysis
- 4.6. Regulatory Landscape
- 4.7. Current Market Potential and Opportunity Assessment (TAM–SAM–SOM Framework)
- 4.8. RAX Analyst Note
- 4.1. Porters Five Forces
- 5. Market Analysis, Insights and Forecast 2021-2033
- 5.1. Market Analysis, Insights and Forecast - by Type
- 5.1.1. Monoamine
- 5.1.2. Diamine
- 5.1.3. Triamine
- 5.2. Market Analysis, Insights and Forecast - by Application
- 5.2.1. Polyurea
- 5.2.2. Fuel Additives
- 5.2.3. Composites
- 5.2.4. Epoxy Coatings
- 5.2.5. Adhesives and Sealants
- 5.2.6. Other Applications
- 5.3. Market Analysis, Insights and Forecast - by Region
- 5.3.1. Asia Pacific
- 5.3.2. North America
- 5.3.3. Europe
- 5.3.4. South America
- 5.3.5. Middle East and Africa
- 5.1. Market Analysis, Insights and Forecast - by Type
- 6. Global Polyether Amine Industry Analysis, Insights and Forecast, 2021-2033
- 6.1. Market Analysis, Insights and Forecast - by Type
- 6.1.1. Monoamine
- 6.1.2. Diamine
- 6.1.3. Triamine
- 6.2. Market Analysis, Insights and Forecast - by Application
- 6.2.1. Polyurea
- 6.2.2. Fuel Additives
- 6.2.3. Composites
- 6.2.4. Epoxy Coatings
- 6.2.5. Adhesives and Sealants
- 6.2.6. Other Applications
- 6.1. Market Analysis, Insights and Forecast - by Type
- 7. Asia Pacific Polyether Amine Industry Analysis, Insights and Forecast, 2020-2032
- 7.1. Market Analysis, Insights and Forecast - by Type
- 7.1.1. Monoamine
- 7.1.2. Diamine
- 7.1.3. Triamine
- 7.2. Market Analysis, Insights and Forecast - by Application
- 7.2.1. Polyurea
- 7.2.2. Fuel Additives
- 7.2.3. Composites
- 7.2.4. Epoxy Coatings
- 7.2.5. Adhesives and Sealants
- 7.2.6. Other Applications
- 7.1. Market Analysis, Insights and Forecast - by Type
- 8. North America Polyether Amine Industry Analysis, Insights and Forecast, 2020-2032
- 8.1. Market Analysis, Insights and Forecast - by Type
- 8.1.1. Monoamine
- 8.1.2. Diamine
- 8.1.3. Triamine
- 8.2. Market Analysis, Insights and Forecast - by Application
- 8.2.1. Polyurea
- 8.2.2. Fuel Additives
- 8.2.3. Composites
- 8.2.4. Epoxy Coatings
- 8.2.5. Adhesives and Sealants
- 8.2.6. Other Applications
- 8.1. Market Analysis, Insights and Forecast - by Type
- 9. Europe Polyether Amine Industry Analysis, Insights and Forecast, 2020-2032
- 9.1. Market Analysis, Insights and Forecast - by Type
- 9.1.1. Monoamine
- 9.1.2. Diamine
- 9.1.3. Triamine
- 9.2. Market Analysis, Insights and Forecast - by Application
- 9.2.1. Polyurea
- 9.2.2. Fuel Additives
- 9.2.3. Composites
- 9.2.4. Epoxy Coatings
- 9.2.5. Adhesives and Sealants
- 9.2.6. Other Applications
- 9.1. Market Analysis, Insights and Forecast - by Type
- 10. South America Polyether Amine Industry Analysis, Insights and Forecast, 2020-2032
- 10.1. Market Analysis, Insights and Forecast - by Type
- 10.1.1. Monoamine
- 10.1.2. Diamine
- 10.1.3. Triamine
- 10.2. Market Analysis, Insights and Forecast - by Application
- 10.2.1. Polyurea
- 10.2.2. Fuel Additives
- 10.2.3. Composites
- 10.2.4. Epoxy Coatings
- 10.2.5. Adhesives and Sealants
- 10.2.6. Other Applications
- 10.1. Market Analysis, Insights and Forecast - by Type
- 11. Middle East and Africa Polyether Amine Industry Analysis, Insights and Forecast, 2020-2032
- 11.1. Market Analysis, Insights and Forecast - by Type
- 11.1.1. Monoamine
- 11.1.2. Diamine
- 11.1.3. Triamine
- 11.2. Market Analysis, Insights and Forecast - by Application
- 11.2.1. Polyurea
- 11.2.2. Fuel Additives
- 11.2.3. Composites
- 11.2.4. Epoxy Coatings
- 11.2.5. Adhesives and Sealants
- 11.2.6. Other Applications
- 11.1. Market Analysis, Insights and Forecast - by Type
- 12. Competitive Analysis
- 12.1. Company Profiles
- 12.1.1 Dasteck
- 12.1.1.1. Company Overview
- 12.1.1.2. Products
- 12.1.1.3. Company Financials
- 12.1.1.4. SWOT Analysis
- 12.1.2 Clariant
- 12.1.2.1. Company Overview
- 12.1.2.2. Products
- 12.1.2.3. Company Financials
- 12.1.2.4. SWOT Analysis
- 12.1.3 Wuxi Acryl Technology Co Ltd
- 12.1.3.1. Company Overview
- 12.1.3.2. Products
- 12.1.3.3. Company Financials
- 12.1.3.4. SWOT Analysis
- 12.1.4 Qingdao IRO Surfactant Co Ltd
- 12.1.4.1. Company Overview
- 12.1.4.2. Products
- 12.1.4.3. Company Financials
- 12.1.4.4. SWOT Analysis
- 12.1.5 BASF SE
- 12.1.5.1. Company Overview
- 12.1.5.2. Products
- 12.1.5.3. Company Financials
- 12.1.5.4. SWOT Analysis
- 12.1.6 Huntsman International LLC
- 12.1.6.1. Company Overview
- 12.1.6.2. Products
- 12.1.6.3. Company Financials
- 12.1.6.4. SWOT Analysis
- 12.1.7 Shanghai Chenhua International Trade Co Ltd
- 12.1.7.1. Company Overview
- 12.1.7.2. Products
- 12.1.7.3. Company Financials
- 12.1.7.4. SWOT Analysis
- 12.1.8 Chia Tai New Materials (Zibo Zhengda Polyurethane Co Ltd )
- 12.1.8.1. Company Overview
- 12.1.8.2. Products
- 12.1.8.3. Company Financials
- 12.1.8.4. SWOT Analysis
- 12.1.1 Dasteck
- 12.2. Market Entropy
- 12.2.1 Company's Key Areas Served
- 12.2.2 Recent Developments
- 12.3. Company Market Share Analysis 2025
- 12.3.1 Top 5 Companies Market Share Analysis
- 12.3.2 Top 3 Companies Market Share Analysis
- 12.4. List of Potential Customers
- 13. Research Methodology
List of Figures
- Figure 1: Global Polyether Amine Industry Revenue Breakdown (billion, %) by Region 2025 & 2033
- Figure 2: Global Polyether Amine Industry Volume Breakdown (kilotons, %) by Region 2025 & 2033
- Figure 3: Asia Pacific Polyether Amine Industry Revenue (billion), by Type 2025 & 2033
- Figure 4: Asia Pacific Polyether Amine Industry Volume (kilotons), by Type 2025 & 2033
- Figure 5: Asia Pacific Polyether Amine Industry Revenue Share (%), by Type 2025 & 2033
- Figure 6: Asia Pacific Polyether Amine Industry Volume Share (%), by Type 2025 & 2033
- Figure 7: Asia Pacific Polyether Amine Industry Revenue (billion), by Application 2025 & 2033
- Figure 8: Asia Pacific Polyether Amine Industry Volume (kilotons), by Application 2025 & 2033
- Figure 9: Asia Pacific Polyether Amine Industry Revenue Share (%), by Application 2025 & 2033
- Figure 10: Asia Pacific Polyether Amine Industry Volume Share (%), by Application 2025 & 2033
- Figure 11: Asia Pacific Polyether Amine Industry Revenue (billion), by Country 2025 & 2033
- Figure 12: Asia Pacific Polyether Amine Industry Volume (kilotons), by Country 2025 & 2033
- Figure 13: Asia Pacific Polyether Amine Industry Revenue Share (%), by Country 2025 & 2033
- Figure 14: Asia Pacific Polyether Amine Industry Volume Share (%), by Country 2025 & 2033
- Figure 15: North America Polyether Amine Industry Revenue (billion), by Type 2025 & 2033
- Figure 16: North America Polyether Amine Industry Volume (kilotons), by Type 2025 & 2033
- Figure 17: North America Polyether Amine Industry Revenue Share (%), by Type 2025 & 2033
- Figure 18: North America Polyether Amine Industry Volume Share (%), by Type 2025 & 2033
- Figure 19: North America Polyether Amine Industry Revenue (billion), by Application 2025 & 2033
- Figure 20: North America Polyether Amine Industry Volume (kilotons), by Application 2025 & 2033
- Figure 21: North America Polyether Amine Industry Revenue Share (%), by Application 2025 & 2033
- Figure 22: North America Polyether Amine Industry Volume Share (%), by Application 2025 & 2033
- Figure 23: North America Polyether Amine Industry Revenue (billion), by Country 2025 & 2033
- Figure 24: North America Polyether Amine Industry Volume (kilotons), by Country 2025 & 2033
- Figure 25: North America Polyether Amine Industry Revenue Share (%), by Country 2025 & 2033
- Figure 26: North America Polyether Amine Industry Volume Share (%), by Country 2025 & 2033
- Figure 27: Europe Polyether Amine Industry Revenue (billion), by Type 2025 & 2033
- Figure 28: Europe Polyether Amine Industry Volume (kilotons), by Type 2025 & 2033
- Figure 29: Europe Polyether Amine Industry Revenue Share (%), by Type 2025 & 2033
- Figure 30: Europe Polyether Amine Industry Volume Share (%), by Type 2025 & 2033
- Figure 31: Europe Polyether Amine Industry Revenue (billion), by Application 2025 & 2033
- Figure 32: Europe Polyether Amine Industry Volume (kilotons), by Application 2025 & 2033
- Figure 33: Europe Polyether Amine Industry Revenue Share (%), by Application 2025 & 2033
- Figure 34: Europe Polyether Amine Industry Volume Share (%), by Application 2025 & 2033
- Figure 35: Europe Polyether Amine Industry Revenue (billion), by Country 2025 & 2033
- Figure 36: Europe Polyether Amine Industry Volume (kilotons), by Country 2025 & 2033
- Figure 37: Europe Polyether Amine Industry Revenue Share (%), by Country 2025 & 2033
- Figure 38: Europe Polyether Amine Industry Volume Share (%), by Country 2025 & 2033
- Figure 39: South America Polyether Amine Industry Revenue (billion), by Type 2025 & 2033
- Figure 40: South America Polyether Amine Industry Volume (kilotons), by Type 2025 & 2033
- Figure 41: South America Polyether Amine Industry Revenue Share (%), by Type 2025 & 2033
- Figure 42: South America Polyether Amine Industry Volume Share (%), by Type 2025 & 2033
- Figure 43: South America Polyether Amine Industry Revenue (billion), by Application 2025 & 2033
- Figure 44: South America Polyether Amine Industry Volume (kilotons), by Application 2025 & 2033
- Figure 45: South America Polyether Amine Industry Revenue Share (%), by Application 2025 & 2033
- Figure 46: South America Polyether Amine Industry Volume Share (%), by Application 2025 & 2033
- Figure 47: South America Polyether Amine Industry Revenue (billion), by Country 2025 & 2033
- Figure 48: South America Polyether Amine Industry Volume (kilotons), by Country 2025 & 2033
- Figure 49: South America Polyether Amine Industry Revenue Share (%), by Country 2025 & 2033
- Figure 50: South America Polyether Amine Industry Volume Share (%), by Country 2025 & 2033
- Figure 51: Middle East and Africa Polyether Amine Industry Revenue (billion), by Type 2025 & 2033
- Figure 52: Middle East and Africa Polyether Amine Industry Volume (kilotons), by Type 2025 & 2033
- Figure 53: Middle East and Africa Polyether Amine Industry Revenue Share (%), by Type 2025 & 2033
- Figure 54: Middle East and Africa Polyether Amine Industry Volume Share (%), by Type 2025 & 2033
- Figure 55: Middle East and Africa Polyether Amine Industry Revenue (billion), by Application 2025 & 2033
- Figure 56: Middle East and Africa Polyether Amine Industry Volume (kilotons), by Application 2025 & 2033
- Figure 57: Middle East and Africa Polyether Amine Industry Revenue Share (%), by Application 2025 & 2033
- Figure 58: Middle East and Africa Polyether Amine Industry Volume Share (%), by Application 2025 & 2033
- Figure 59: Middle East and Africa Polyether Amine Industry Revenue (billion), by Country 2025 & 2033
- Figure 60: Middle East and Africa Polyether Amine Industry Volume (kilotons), by Country 2025 & 2033
- Figure 61: Middle East and Africa Polyether Amine Industry Revenue Share (%), by Country 2025 & 2033
- Figure 62: Middle East and Africa Polyether Amine Industry Volume Share (%), by Country 2025 & 2033
List of Tables
- Table 1: Global Polyether Amine Industry Revenue billion Forecast, by Type 2020 & 2033
- Table 2: Global Polyether Amine Industry Volume kilotons Forecast, by Type 2020 & 2033
- Table 3: Global Polyether Amine Industry Revenue billion Forecast, by Application 2020 & 2033
- Table 4: Global Polyether Amine Industry Volume kilotons Forecast, by Application 2020 & 2033
- Table 5: Global Polyether Amine Industry Revenue billion Forecast, by Region 2020 & 2033
- Table 6: Global Polyether Amine Industry Volume kilotons Forecast, by Region 2020 & 2033
- Table 7: Global Polyether Amine Industry Revenue billion Forecast, by Type 2020 & 2033
- Table 8: Global Polyether Amine Industry Volume kilotons Forecast, by Type 2020 & 2033
- Table 9: Global Polyether Amine Industry Revenue billion Forecast, by Application 2020 & 2033
- Table 10: Global Polyether Amine Industry Volume kilotons Forecast, by Application 2020 & 2033
- Table 11: Global Polyether Amine Industry Revenue billion Forecast, by Country 2020 & 2033
- Table 12: Global Polyether Amine Industry Volume kilotons Forecast, by Country 2020 & 2033
- Table 13: China Polyether Amine Industry Revenue (billion) Forecast, by Application 2020 & 2033
- Table 14: China Polyether Amine Industry Volume (kilotons) Forecast, by Application 2020 & 2033
- Table 15: India Polyether Amine Industry Revenue (billion) Forecast, by Application 2020 & 2033
- Table 16: India Polyether Amine Industry Volume (kilotons) Forecast, by Application 2020 & 2033
- Table 17: Japan Polyether Amine Industry Revenue (billion) Forecast, by Application 2020 & 2033
- Table 18: Japan Polyether Amine Industry Volume (kilotons) Forecast, by Application 2020 & 2033
- Table 19: South Korea Polyether Amine Industry Revenue (billion) Forecast, by Application 2020 & 2033
- Table 20: South Korea Polyether Amine Industry Volume (kilotons) Forecast, by Application 2020 & 2033
- Table 21: Rest of Asia Pacific Polyether Amine Industry Revenue (billion) Forecast, by Application 2020 & 2033
- Table 22: Rest of Asia Pacific Polyether Amine Industry Volume (kilotons) Forecast, by Application 2020 & 2033
- Table 23: Global Polyether Amine Industry Revenue billion Forecast, by Type 2020 & 2033
- Table 24: Global Polyether Amine Industry Volume kilotons Forecast, by Type 2020 & 2033
- Table 25: Global Polyether Amine Industry Revenue billion Forecast, by Application 2020 & 2033
- Table 26: Global Polyether Amine Industry Volume kilotons Forecast, by Application 2020 & 2033
- Table 27: Global Polyether Amine Industry Revenue billion Forecast, by Country 2020 & 2033
- Table 28: Global Polyether Amine Industry Volume kilotons Forecast, by Country 2020 & 2033
- Table 29: United States Polyether Amine Industry Revenue (billion) Forecast, by Application 2020 & 2033
- Table 30: United States Polyether Amine Industry Volume (kilotons) Forecast, by Application 2020 & 2033
- Table 31: Canada Polyether Amine Industry Revenue (billion) Forecast, by Application 2020 & 2033
- Table 32: Canada Polyether Amine Industry Volume (kilotons) Forecast, by Application 2020 & 2033
- Table 33: Mexico Polyether Amine Industry Revenue (billion) Forecast, by Application 2020 & 2033
- Table 34: Mexico Polyether Amine Industry Volume (kilotons) Forecast, by Application 2020 & 2033
- Table 35: Global Polyether Amine Industry Revenue billion Forecast, by Type 2020 & 2033
- Table 36: Global Polyether Amine Industry Volume kilotons Forecast, by Type 2020 & 2033
- Table 37: Global Polyether Amine Industry Revenue billion Forecast, by Application 2020 & 2033
- Table 38: Global Polyether Amine Industry Volume kilotons Forecast, by Application 2020 & 2033
- Table 39: Global Polyether Amine Industry Revenue billion Forecast, by Country 2020 & 2033
- Table 40: Global Polyether Amine Industry Volume kilotons Forecast, by Country 2020 & 2033
- Table 41: Germany Polyether Amine Industry Revenue (billion) Forecast, by Application 2020 & 2033
- Table 42: Germany Polyether Amine Industry Volume (kilotons) Forecast, by Application 2020 & 2033
- Table 43: United Kingdom Polyether Amine Industry Revenue (billion) Forecast, by Application 2020 & 2033
- Table 44: United Kingdom Polyether Amine Industry Volume (kilotons) Forecast, by Application 2020 & 2033
- Table 45: Italy Polyether Amine Industry Revenue (billion) Forecast, by Application 2020 & 2033
- Table 46: Italy Polyether Amine Industry Volume (kilotons) Forecast, by Application 2020 & 2033
- Table 47: France Polyether Amine Industry Revenue (billion) Forecast, by Application 2020 & 2033
- Table 48: France Polyether Amine Industry Volume (kilotons) Forecast, by Application 2020 & 2033
- Table 49: Rest of Europe Polyether Amine Industry Revenue (billion) Forecast, by Application 2020 & 2033
- Table 50: Rest of Europe Polyether Amine Industry Volume (kilotons) Forecast, by Application 2020 & 2033
- Table 51: Global Polyether Amine Industry Revenue billion Forecast, by Type 2020 & 2033
- Table 52: Global Polyether Amine Industry Volume kilotons Forecast, by Type 2020 & 2033
- Table 53: Global Polyether Amine Industry Revenue billion Forecast, by Application 2020 & 2033
- Table 54: Global Polyether Amine Industry Volume kilotons Forecast, by Application 2020 & 2033
- Table 55: Global Polyether Amine Industry Revenue billion Forecast, by Country 2020 & 2033
- Table 56: Global Polyether Amine Industry Volume kilotons Forecast, by Country 2020 & 2033
- Table 57: Brazil Polyether Amine Industry Revenue (billion) Forecast, by Application 2020 & 2033
- Table 58: Brazil Polyether Amine Industry Volume (kilotons) Forecast, by Application 2020 & 2033
- Table 59: Argentina Polyether Amine Industry Revenue (billion) Forecast, by Application 2020 & 2033
- Table 60: Argentina Polyether Amine Industry Volume (kilotons) Forecast, by Application 2020 & 2033
- Table 61: Rest of South America Polyether Amine Industry Revenue (billion) Forecast, by Application 2020 & 2033
- Table 62: Rest of South America Polyether Amine Industry Volume (kilotons) Forecast, by Application 2020 & 2033
- Table 63: Global Polyether Amine Industry Revenue billion Forecast, by Type 2020 & 2033
- Table 64: Global Polyether Amine Industry Volume kilotons Forecast, by Type 2020 & 2033
- Table 65: Global Polyether Amine Industry Revenue billion Forecast, by Application 2020 & 2033
- Table 66: Global Polyether Amine Industry Volume kilotons Forecast, by Application 2020 & 2033
- Table 67: Global Polyether Amine Industry Revenue billion Forecast, by Country 2020 & 2033
- Table 68: Global Polyether Amine Industry Volume kilotons Forecast, by Country 2020 & 2033
- Table 69: Saudi Arabia Polyether Amine Industry Revenue (billion) Forecast, by Application 2020 & 2033
- Table 70: Saudi Arabia Polyether Amine Industry Volume (kilotons) Forecast, by Application 2020 & 2033
- Table 71: South Africa Polyether Amine Industry Revenue (billion) Forecast, by Application 2020 & 2033
- Table 72: South Africa Polyether Amine Industry Volume (kilotons) Forecast, by Application 2020 & 2033
- Table 73: Rest of Middle East and Africa Polyether Amine Industry Revenue (billion) Forecast, by Application 2020 & 2033
- Table 74: Rest of Middle East and Africa Polyether Amine Industry Volume (kilotons) Forecast, by Application 2020 & 2033
Frequently Asked Questions
1. What is the projected Compound Annual Growth Rate (CAGR) of the Polyether Amine Industry?
The projected CAGR is approximately 13.56%.
2. Which companies are prominent players in the Polyether Amine Industry?
Key companies in the market include Dasteck, Clariant, Wuxi Acryl Technology Co Ltd , Qingdao IRO Surfactant Co Ltd, BASF SE, Huntsman International LLC, Shanghai Chenhua International Trade Co Ltd, Chia Tai New Materials (Zibo Zhengda Polyurethane Co Ltd ).
3. What are the main segments of the Polyether Amine Industry?
The market segments include Type, Application.
4. Can you provide details about the market size?
The market size is estimated to be USD 9.05 billion as of 2022.
5. What are some drivers contributing to market growth?
Increasing Demand from Construction Industry; Growing Trend of Eco-friendly and Renewable Energy Generation; Other Drivers.
6. What are the notable trends driving market growth?
Increasing Demand from Composite Application.
7. Are there any restraints impacting market growth?
Environmental Concern Due to Excessive Use of Polyetheramines; Other Restraints.
8. Can you provide examples of recent developments in the market?
June 2022: BASF made an announcement about the ongoing expansion of production capacity at the Geismar site in North America, with the aim of being on-stream by mid-2023. This expansion will focus on key specialty amines and will enable the production of more polyetheramines marketed under the Baxxodur brand.
9. What pricing options are available for accessing the report?
Pricing options include single-user, multi-user, and enterprise licenses priced at USD 4750, USD 5250, and USD 8750 respectively.
10. Is the market size provided in terms of value or volume?
The market size is provided in terms of value, measured in billion and volume, measured in kilotons.
11. Are there any specific market keywords associated with the report?
Yes, the market keyword associated with the report is "Polyether Amine Industry," which aids in identifying and referencing the specific market segment covered.
12. How do I determine which pricing option suits my needs best?
The pricing options vary based on user requirements and access needs. Individual users may opt for single-user licenses, while businesses requiring broader access may choose multi-user or enterprise licenses for cost-effective access to the report.
13. Are there any additional resources or data provided in the Polyether Amine Industry report?
While the report offers comprehensive insights, it's advisable to review the specific contents or supplementary materials provided to ascertain if additional resources or data are available.
14. How can I stay updated on further developments or reports in the Polyether Amine Industry?
To stay informed about further developments, trends, and reports in the Polyether Amine Industry, consider subscribing to industry newsletters, following relevant companies and organizations, or regularly checking reputable industry news sources and publications.
Methodology
Step 1 - Identification of Relevant Samples Size from Population Database


Step 2 - Approaches for Defining Global Market Size (Value, Volume* & Price*)

Note*: In applicable scenarios
Step 3 - Data Sources
Primary Research
- Web Analytics
- Survey Reports
- Research Institute
- Latest Research Reports
- Opinion Leaders
Secondary Research
- Annual Reports
- White Paper
- Latest Press Release
- Industry Association
- Paid Database
- Investor Presentations

Step 4 - Data Triangulation
Involves using different sources of information in order to increase the validity of a study
These sources are likely to be stakeholders in a program - participants, other researchers, program staff, other community members, and so on.
Then we put all data in single framework & apply various statistical tools to find out the dynamic on the market.
During the analysis stage, feedback from the stakeholder groups would be compared to determine areas of agreement as well as areas of divergence