

Key Insights
The global Polyurethane Composites Market is projected for significant growth, with a current market size of 870.93 million in the base year 2025. This expansion is driven by a Compound Annual Growth Rate (CAGR) of 5.96%, indicating substantial future market value. Key growth drivers include the increasing demand for lightweight, durable materials across sectors like Transportation for automotive components and Building & Construction for insulation and structural applications. The Electrical & Electronics sector's requirement for advanced composite materials with superior insulating properties, alongside the growing Wind Energy market's need for robust, lightweight composite blades, further propel this growth. Polyurethane composites are increasingly favored over traditional materials due to their excellent strength-to-weight ratio, design flexibility, and cost-effectiveness.
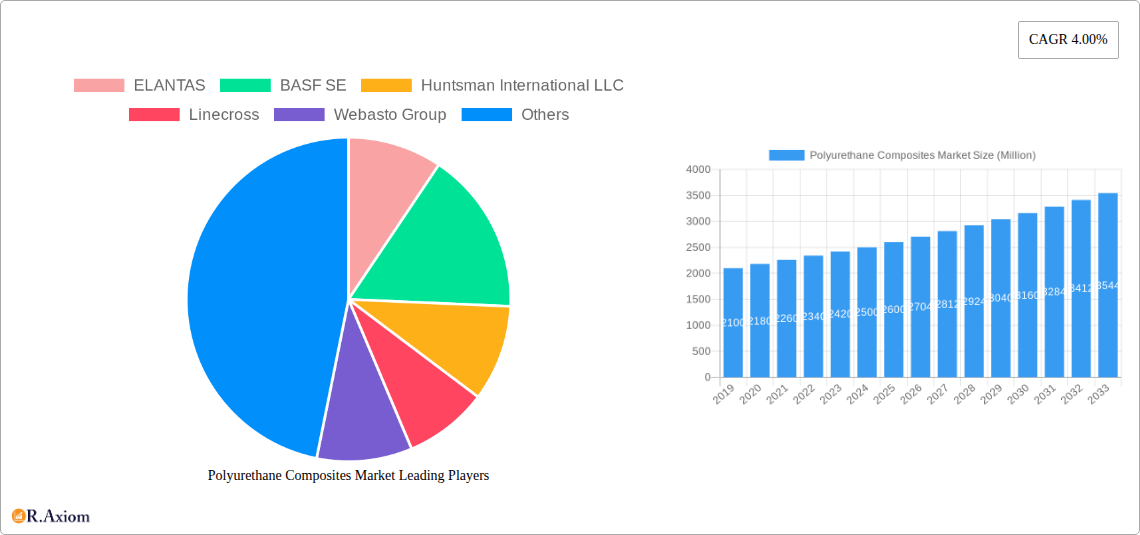
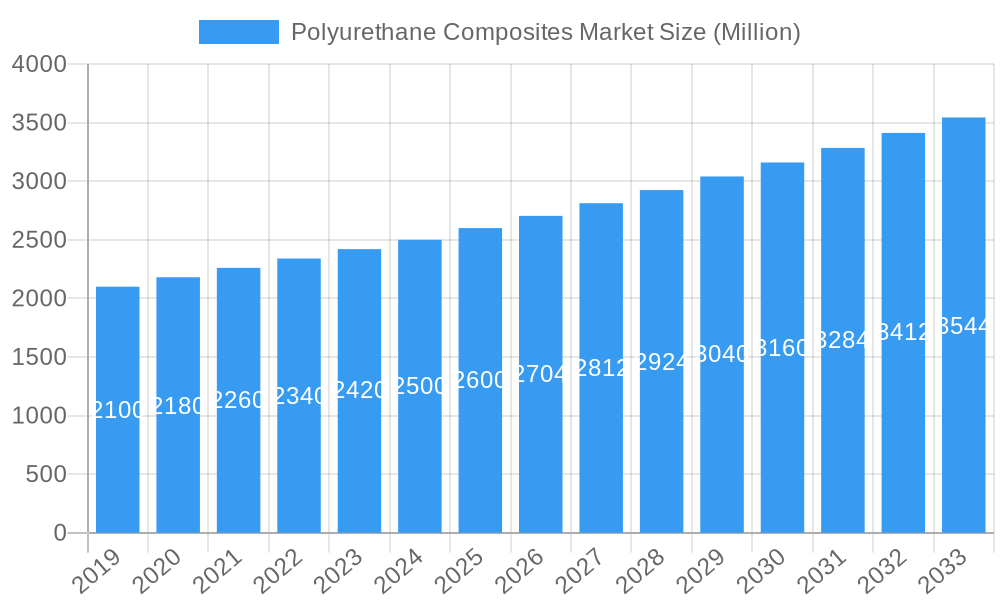
Polyurethane Composites Market Market Size (In Million)
Market expansion is also influenced by advancements in composite manufacturing processes and the development of novel polyurethane formulations delivering enhanced performance. Emerging economies, particularly in the Asia Pacific region, are expected to be significant contributors due to rapid industrialization and infrastructure development. Potential challenges include raw material price volatility and the need for specialized manufacturing expertise. Despite these factors, continued innovation and market penetration are anticipated, with glass and carbon fiber composites leading the segmentations to meet diverse end-user requirements for high-performance composites.
Polyurethane Composites Market Company Market Share
This comprehensive report provides critical insights into the global Polyurethane Composites Market. The analysis covers the historical period from 2019 to 2024, with a base year of 2025, and offers robust forecasts extending to 2033. It examines market concentration, innovation drivers, industry trends, dominant segments, product developments, growth drivers, challenges, emerging opportunities, and strategic outlook. The market is segmented by Fiber Type (Glass, Carbon, Others) and End-user Industry (Transportation, Building & Construction, Electrical & Electronics, Wind Energy, Others).
Polyurethane Composites Market Market Concentration & Innovation
The global Polyurethane Composites Market exhibits a moderate to high degree of concentration, with key players such as ELANTAS, BASF SE, Huntsman International LLC, Linecross, Webasto Group, Henkel Corporation, and Covestro AG holding significant market shares. Innovation is a primary driver, fueled by ongoing research and development in material science, leading to the creation of composites with enhanced strength-to-weight ratios, improved thermal and acoustic insulation properties, and greater design flexibility. Regulatory frameworks, particularly those focused on sustainability and fire safety standards in the building and construction sectors, are increasingly influencing product development and market entry. The availability of substitute materials, such as traditional plastics, metals, and other composite types, presents a competitive challenge, necessitating continuous innovation in performance and cost-effectiveness. End-user trends, characterized by a growing demand for lightweight, durable, and energy-efficient materials across various industries, are a significant catalyst for market expansion. Mergers and acquisitions (M&A) activities, with an estimated total deal value of over $500 Million in the historical period, are a common strategy employed by leading companies to consolidate market share, acquire new technologies, and expand their geographic reach.
Polyurethane Composites Market Industry Trends & Insights
The Polyurethane Composites Market is poised for substantial growth, projected to witness a Compound Annual Growth Rate (CAGR) of approximately 6.5% during the forecast period of 2025-2033. This robust expansion is driven by a confluence of technological advancements, evolving consumer preferences, and favorable economic conditions. Technological disruptions, including the development of advanced manufacturing techniques like additive manufacturing (3D printing) and novel resin systems, are enhancing the performance and application range of polyurethane composites. These innovations are enabling the creation of complex geometries and customized solutions, thereby opening up new market avenues. Consumer preferences are increasingly leaning towards sustainable, lightweight, and high-performance materials, directly benefiting polyurethane composites due to their inherent properties. The rising global demand for fuel-efficient vehicles, energy-efficient buildings, and renewable energy infrastructure, such as wind turbines, are significant market penetration drivers. The competitive dynamics within the market are characterized by intense R&D efforts, strategic partnerships, and a focus on cost optimization to meet the demands of price-sensitive applications. The increasing adoption of lightweight materials in the automotive sector, aimed at reducing vehicle weight and improving fuel economy, is a particularly strong growth catalyst, with an estimated market penetration of over 30% in new vehicle models by 2028. Similarly, in the building and construction industry, the demand for advanced insulation materials and structural components that offer enhanced energy efficiency and durability is accelerating the adoption of polyurethane composites, with an estimated market penetration of around 15% in new construction projects. The electrical and electronics sector is also witnessing increased utilization of these composites for their insulating and flame-retardant properties, further contributing to market expansion.
Dominant Markets & Segments in Polyurethane Composites Market
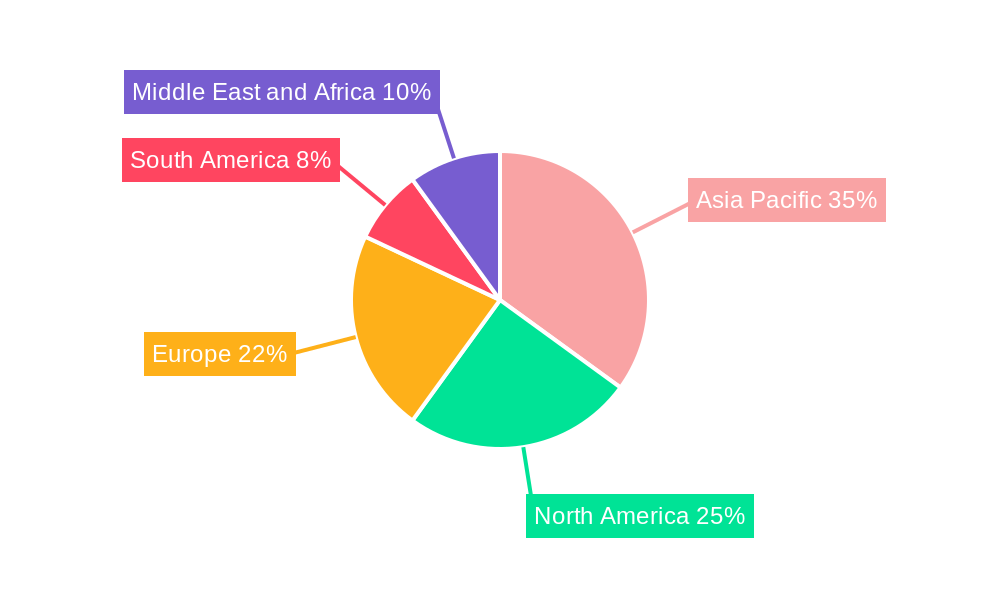
The global Polyurethane Composites Market is characterized by strong regional dominance and a clear preference for specific fiber types and end-user industries. North America and Europe currently lead the market, driven by established manufacturing bases, stringent environmental regulations promoting lightweight and sustainable materials, and significant investments in infrastructure development and renewable energy projects. Asia Pacific is emerging as the fastest-growing region, fueled by rapid industrialization, expanding automotive and construction sectors, and increasing government support for advanced manufacturing.
Within the Fiber Type segmentation:
- Glass Fiber composites are currently the dominant segment, accounting for an estimated market share of over 60%. This dominance is attributed to their cost-effectiveness, good mechanical properties, and widespread availability, making them suitable for a broad range of applications, particularly in transportation and building & construction. The ease of processing and inherent strength make them a preferred choice for structural components and panels.
- Carbon Fiber composites, while a smaller segment with an estimated 25% market share, are experiencing rapid growth due to their exceptional strength-to-weight ratio, stiffness, and fatigue resistance. Their application is expanding in high-performance sectors like aerospace, advanced automotive designs, and high-end sports equipment, where weight reduction and superior performance are paramount.
- Other Fiber composites, including natural fibers and aramid fibers, represent a niche segment with an estimated 15% market share. These materials are gaining traction in applications prioritizing sustainability and specific performance characteristics, such as impact resistance.
Within the End-user Industry segmentation:
- Transportation is the largest and most influential end-user industry, commanding an estimated market share of over 40%. The automotive industry's relentless pursuit of lightweight materials to improve fuel efficiency and reduce emissions, coupled with advancements in electric vehicle technology, is a primary growth driver. This includes applications in structural components, interior parts, and battery enclosures. The aerospace sector also contributes significantly, utilizing these composites for aircraft interiors and structural components where weight reduction is critical.
- Building & Construction represents another significant segment, with an estimated market share of around 25%. The demand for high-performance insulation materials, energy-efficient building envelopes, durable structural components, and aesthetic architectural elements is driving the adoption of polyurethane composites. Their excellent thermal insulation properties, moisture resistance, and design flexibility make them ideal for modern construction.
- Electrical & Electronics is a growing segment, accounting for an estimated 15% market share. Polyurethane composites are utilized for their excellent electrical insulation properties, flame retardancy, and dimensional stability in components like casings, circuit boards, and connectors.
- Wind Energy is a rapidly expanding sector, with an estimated market share of 10%. The increasing global demand for renewable energy and the development of larger, more efficient wind turbines are driving the use of lightweight and durable composite materials for turbine blades, nacelles, and towers.
- Others, including applications in sporting goods, industrial equipment, and furniture, represent the remaining market share.
Polyurethane Composites Market Product Developments
Recent product developments in the Polyurethane Composites Market are focused on enhancing material performance, sustainability, and cost-effectiveness. Innovations include the development of bio-based polyurethane resins derived from renewable resources, offering a more environmentally friendly alternative. Advancements in additive manufacturing are enabling the creation of complex, customized composite parts with reduced waste. Furthermore, research into novel fiber reinforcements and curing technologies is leading to composites with improved mechanical properties, such as increased tensile strength and impact resistance, providing manufacturers with enhanced design freedom and competitive advantages in niche applications.
Report Scope & Segmentation Analysis
This comprehensive market report segments the global Polyurethane Composites Market into key categories to provide a granular understanding of market dynamics. The Fiber Type segmentation includes Glass, Carbon, and Other fiber composites, each with distinct properties and application profiles. The End-user Industry segmentation encompasses Transportation, Building & Construction, Electrical & Electronics, Wind Energy, and Others. Each segment is analyzed for its current market size, projected growth trajectory, and competitive landscape, offering actionable insights into the specific demand drivers and market penetration potential within each category.
Key Drivers of Polyurethane Composites Market Growth
The growth of the Polyurethane Composites Market is primarily propelled by several key factors. The escalating demand for lightweight materials across industries like automotive and aerospace, aimed at improving fuel efficiency and reducing carbon emissions, is a major catalyst. Technological advancements in composite manufacturing, such as enhanced resin systems and faster curing processes, are increasing production efficiency and enabling new applications. Stringent environmental regulations and a global push towards sustainability are favoring the adoption of durable, long-lasting materials with lower embodied energy. Furthermore, the expanding infrastructure development in emerging economies and the increasing investment in renewable energy sources, particularly wind power, are creating significant demand for high-performance composite materials.
Challenges in the Polyurethane Composites Market Sector
Despite its robust growth, the Polyurethane Composites Market faces several challenges. The relatively high cost of raw materials, particularly for carbon fiber composites, can limit their adoption in price-sensitive applications. The complexity of manufacturing processes and the need for specialized equipment and skilled labor can also pose barriers to entry for smaller players. Stringent recycling and end-of-life management protocols for composite materials are still under development, posing potential environmental concerns. Furthermore, the availability and performance of alternative materials, such as advanced polymers and metals, present ongoing competition.
Emerging Opportunities in Polyurethane Composites Market
The Polyurethane Composites Market is ripe with emerging opportunities. The burgeoning electric vehicle (EV) market presents a significant avenue for growth, with demand for lightweight structural components, battery casings, and interior parts. The increasing focus on sustainable construction and retrofitting existing buildings for energy efficiency is creating demand for advanced insulation and structural composite solutions. The expansion of offshore wind farms and the development of next-generation wind turbines are driving the need for larger, more durable composite blades and components. Furthermore, advancements in additive manufacturing are opening up new possibilities for customization and on-demand production of complex composite parts.
Leading Players in the Polyurethane Composites Market Market
ELANTAS BASF SE Huntsman International LLC Linecross Webasto Group Henkel Corporation Covestro AG
Key Developments in Polyurethane Composites Market Industry
- 2024: Launch of a new bio-based polyurethane resin system by a leading chemical company, focusing on enhanced sustainability and reduced environmental impact.
- 2023: A major automotive manufacturer announces the increased use of polyurethane composites in its next-generation electric vehicle platform to achieve significant weight reduction and improve energy efficiency.
- 2023: Expansion of a wind energy component manufacturer's facility to meet the growing demand for larger and more advanced composite turbine blades.
- 2022: Acquisition of a specialized composite materials supplier by a global chemical corporation to bolster its portfolio and expand its market reach.
- 2021: Introduction of advanced additive manufacturing techniques for producing complex polyurethane composite parts, enabling faster prototyping and customized production.
Strategic Outlook for Polyurethane Composites Market Market
The strategic outlook for the Polyurethane Composites Market is highly positive, driven by the accelerating global demand for lightweight, high-performance, and sustainable materials. Key growth catalysts include continued innovation in material science, particularly in areas like bio-based composites and advanced manufacturing processes. The expanding applications in electric vehicles, renewable energy infrastructure, and energy-efficient buildings present substantial opportunities for market expansion. Companies that can effectively navigate regulatory landscapes, invest in R&D, and focus on cost optimization while emphasizing sustainability are well-positioned for long-term success and market leadership in this dynamic sector.
Polyurethane Composites Market Segmentation
-
1. Fiber Type
- 1.1. Glass
- 1.2. Carbon
- 1.3. Others
-
2. End-user Industry
- 2.1. Transportation
- 2.2. Building & Construction
- 2.3. Electrical & Electronics
- 2.4. Wind Energy
- 2.5. Others
Polyurethane Composites Market Segmentation By Geography
-
1. Asia Pacific
- 1.1. China
- 1.2. India
- 1.3. Japan
- 1.4. South Korea
- 1.5. Rest of Asia Pacific
-
2. North America
- 2.1. United States
- 2.2. Canada
- 2.3. Mexico
-
3. Europe
- 3.1. Germany
- 3.2. United Kingdom
- 3.3. Italy
- 3.4. France
- 3.5. Rest of Europe
-
4. South America
- 4.1. Brazil
- 4.2. Argentina
- 4.3. Rest of South America
-
5. Middle East and Africa
- 5.1. Saudi Arabia
- 5.2. South Africa
- 5.3. Rest of Middle East and Africa
Polyurethane Composites Market Regional Market Share
Geographic Coverage of Polyurethane Composites Market
Polyurethane Composites Market REPORT HIGHLIGHTS
| Aspects | Details |
|---|---|
| Study Period | 2020-2034 |
| Base Year | 2025 |
| Estimated Year | 2026 |
| Forecast Period | 2026-2034 |
| Historical Period | 2020-2025 |
| Growth Rate | CAGR of 5.96% from 2020-2034 |
| Segmentation |
|
Table of Contents
- 1. Introduction
- 1.1. Research Scope
- 1.2. Market Segmentation
- 1.3. Research Objective
- 1.4. Definitions and Assumptions
- 2. Executive Summary
- 2.1. Market Snapshot
- 3. Market Dynamics
- 3.1. Market Drivers
- 3.2. Market Restrains
- 3.3. Market Trends
- 3.4. Market Opportunities
- 4. Market Factor Analysis
- 4.1. Porters Five Forces
- 4.1.1. Bargaining Power of Suppliers
- 4.1.2. Bargaining Power of Buyers
- 4.1.3. Threat of New Entrants
- 4.1.4. Threat of Substitutes
- 4.1.5. Competitive Rivalry
- 4.2. PESTEL analysis
- 4.3. BCG Analysis
- 4.3.1. Stars (High Growth, High Market Share)
- 4.3.2. Cash Cows (Low Growth, High Market Share)
- 4.3.3. Question Mark (High Growth, Low Market Share)
- 4.3.4. Dogs (Low Growth, Low Market Share)
- 4.4. Ansoff Matrix Analysis
- 4.5. Supply Chain Analysis
- 4.6. Regulatory Landscape
- 4.7. Current Market Potential and Opportunity Assessment (TAM–SAM–SOM Framework)
- 4.8. RAX Analyst Note
- 4.1. Porters Five Forces
- 5. Market Analysis, Insights and Forecast 2021-2033
- 5.1. Market Analysis, Insights and Forecast - by Fiber Type
- 5.1.1. Glass
- 5.1.2. Carbon
- 5.1.3. Others
- 5.2. Market Analysis, Insights and Forecast - by End-user Industry
- 5.2.1. Transportation
- 5.2.2. Building & Construction
- 5.2.3. Electrical & Electronics
- 5.2.4. Wind Energy
- 5.2.5. Others
- 5.3. Market Analysis, Insights and Forecast - by Region
- 5.3.1. Asia Pacific
- 5.3.2. North America
- 5.3.3. Europe
- 5.3.4. South America
- 5.3.5. Middle East and Africa
- 5.1. Market Analysis, Insights and Forecast - by Fiber Type
- 6. Global Polyurethane Composites Market Analysis, Insights and Forecast, 2021-2033
- 6.1. Market Analysis, Insights and Forecast - by Fiber Type
- 6.1.1. Glass
- 6.1.2. Carbon
- 6.1.3. Others
- 6.2. Market Analysis, Insights and Forecast - by End-user Industry
- 6.2.1. Transportation
- 6.2.2. Building & Construction
- 6.2.3. Electrical & Electronics
- 6.2.4. Wind Energy
- 6.2.5. Others
- 6.1. Market Analysis, Insights and Forecast - by Fiber Type
- 7. Asia Pacific Polyurethane Composites Market Analysis, Insights and Forecast, 2020-2032
- 7.1. Market Analysis, Insights and Forecast - by Fiber Type
- 7.1.1. Glass
- 7.1.2. Carbon
- 7.1.3. Others
- 7.2. Market Analysis, Insights and Forecast - by End-user Industry
- 7.2.1. Transportation
- 7.2.2. Building & Construction
- 7.2.3. Electrical & Electronics
- 7.2.4. Wind Energy
- 7.2.5. Others
- 7.1. Market Analysis, Insights and Forecast - by Fiber Type
- 8. North America Polyurethane Composites Market Analysis, Insights and Forecast, 2020-2032
- 8.1. Market Analysis, Insights and Forecast - by Fiber Type
- 8.1.1. Glass
- 8.1.2. Carbon
- 8.1.3. Others
- 8.2. Market Analysis, Insights and Forecast - by End-user Industry
- 8.2.1. Transportation
- 8.2.2. Building & Construction
- 8.2.3. Electrical & Electronics
- 8.2.4. Wind Energy
- 8.2.5. Others
- 8.1. Market Analysis, Insights and Forecast - by Fiber Type
- 9. Europe Polyurethane Composites Market Analysis, Insights and Forecast, 2020-2032
- 9.1. Market Analysis, Insights and Forecast - by Fiber Type
- 9.1.1. Glass
- 9.1.2. Carbon
- 9.1.3. Others
- 9.2. Market Analysis, Insights and Forecast - by End-user Industry
- 9.2.1. Transportation
- 9.2.2. Building & Construction
- 9.2.3. Electrical & Electronics
- 9.2.4. Wind Energy
- 9.2.5. Others
- 9.1. Market Analysis, Insights and Forecast - by Fiber Type
- 10. South America Polyurethane Composites Market Analysis, Insights and Forecast, 2020-2032
- 10.1. Market Analysis, Insights and Forecast - by Fiber Type
- 10.1.1. Glass
- 10.1.2. Carbon
- 10.1.3. Others
- 10.2. Market Analysis, Insights and Forecast - by End-user Industry
- 10.2.1. Transportation
- 10.2.2. Building & Construction
- 10.2.3. Electrical & Electronics
- 10.2.4. Wind Energy
- 10.2.5. Others
- 10.1. Market Analysis, Insights and Forecast - by Fiber Type
- 11. Middle East and Africa Polyurethane Composites Market Analysis, Insights and Forecast, 2020-2032
- 11.1. Market Analysis, Insights and Forecast - by Fiber Type
- 11.1.1. Glass
- 11.1.2. Carbon
- 11.1.3. Others
- 11.2. Market Analysis, Insights and Forecast - by End-user Industry
- 11.2.1. Transportation
- 11.2.2. Building & Construction
- 11.2.3. Electrical & Electronics
- 11.2.4. Wind Energy
- 11.2.5. Others
- 11.1. Market Analysis, Insights and Forecast - by Fiber Type
- 12. Competitive Analysis
- 12.1. Company Profiles
- 12.1.1 ELANTAS
- 12.1.1.1. Company Overview
- 12.1.1.2. Products
- 12.1.1.3. Company Financials
- 12.1.1.4. SWOT Analysis
- 12.1.2 BASF SE
- 12.1.2.1. Company Overview
- 12.1.2.2. Products
- 12.1.2.3. Company Financials
- 12.1.2.4. SWOT Analysis
- 12.1.3 Huntsman International LLC
- 12.1.3.1. Company Overview
- 12.1.3.2. Products
- 12.1.3.3. Company Financials
- 12.1.3.4. SWOT Analysis
- 12.1.4 Linecross
- 12.1.4.1. Company Overview
- 12.1.4.2. Products
- 12.1.4.3. Company Financials
- 12.1.4.4. SWOT Analysis
- 12.1.5 Webasto Group
- 12.1.5.1. Company Overview
- 12.1.5.2. Products
- 12.1.5.3. Company Financials
- 12.1.5.4. SWOT Analysis
- 12.1.6 Henkel Corporation
- 12.1.6.1. Company Overview
- 12.1.6.2. Products
- 12.1.6.3. Company Financials
- 12.1.6.4. SWOT Analysis
- 12.1.7 Covestro AG
- 12.1.7.1. Company Overview
- 12.1.7.2. Products
- 12.1.7.3. Company Financials
- 12.1.7.4. SWOT Analysis
- 12.1.1 ELANTAS
- 12.2. Market Entropy
- 12.2.1 Company's Key Areas Served
- 12.2.2 Recent Developments
- 12.3. Company Market Share Analysis 2025
- 12.3.1 Top 5 Companies Market Share Analysis
- 12.3.2 Top 3 Companies Market Share Analysis
- 12.4. List of Potential Customers
- 13. Research Methodology
List of Figures
- Figure 1: Global Polyurethane Composites Market Revenue Breakdown (million, %) by Region 2025 & 2033
- Figure 2: Global Polyurethane Composites Market Volume Breakdown (grams per cubic centimeter , %) by Region 2025 & 2033
- Figure 3: Asia Pacific Polyurethane Composites Market Revenue (million), by Fiber Type 2025 & 2033
- Figure 4: Asia Pacific Polyurethane Composites Market Volume (grams per cubic centimeter ), by Fiber Type 2025 & 2033
- Figure 5: Asia Pacific Polyurethane Composites Market Revenue Share (%), by Fiber Type 2025 & 2033
- Figure 6: Asia Pacific Polyurethane Composites Market Volume Share (%), by Fiber Type 2025 & 2033
- Figure 7: Asia Pacific Polyurethane Composites Market Revenue (million), by End-user Industry 2025 & 2033
- Figure 8: Asia Pacific Polyurethane Composites Market Volume (grams per cubic centimeter ), by End-user Industry 2025 & 2033
- Figure 9: Asia Pacific Polyurethane Composites Market Revenue Share (%), by End-user Industry 2025 & 2033
- Figure 10: Asia Pacific Polyurethane Composites Market Volume Share (%), by End-user Industry 2025 & 2033
- Figure 11: Asia Pacific Polyurethane Composites Market Revenue (million), by Country 2025 & 2033
- Figure 12: Asia Pacific Polyurethane Composites Market Volume (grams per cubic centimeter ), by Country 2025 & 2033
- Figure 13: Asia Pacific Polyurethane Composites Market Revenue Share (%), by Country 2025 & 2033
- Figure 14: Asia Pacific Polyurethane Composites Market Volume Share (%), by Country 2025 & 2033
- Figure 15: North America Polyurethane Composites Market Revenue (million), by Fiber Type 2025 & 2033
- Figure 16: North America Polyurethane Composites Market Volume (grams per cubic centimeter ), by Fiber Type 2025 & 2033
- Figure 17: North America Polyurethane Composites Market Revenue Share (%), by Fiber Type 2025 & 2033
- Figure 18: North America Polyurethane Composites Market Volume Share (%), by Fiber Type 2025 & 2033
- Figure 19: North America Polyurethane Composites Market Revenue (million), by End-user Industry 2025 & 2033
- Figure 20: North America Polyurethane Composites Market Volume (grams per cubic centimeter ), by End-user Industry 2025 & 2033
- Figure 21: North America Polyurethane Composites Market Revenue Share (%), by End-user Industry 2025 & 2033
- Figure 22: North America Polyurethane Composites Market Volume Share (%), by End-user Industry 2025 & 2033
- Figure 23: North America Polyurethane Composites Market Revenue (million), by Country 2025 & 2033
- Figure 24: North America Polyurethane Composites Market Volume (grams per cubic centimeter ), by Country 2025 & 2033
- Figure 25: North America Polyurethane Composites Market Revenue Share (%), by Country 2025 & 2033
- Figure 26: North America Polyurethane Composites Market Volume Share (%), by Country 2025 & 2033
- Figure 27: Europe Polyurethane Composites Market Revenue (million), by Fiber Type 2025 & 2033
- Figure 28: Europe Polyurethane Composites Market Volume (grams per cubic centimeter ), by Fiber Type 2025 & 2033
- Figure 29: Europe Polyurethane Composites Market Revenue Share (%), by Fiber Type 2025 & 2033
- Figure 30: Europe Polyurethane Composites Market Volume Share (%), by Fiber Type 2025 & 2033
- Figure 31: Europe Polyurethane Composites Market Revenue (million), by End-user Industry 2025 & 2033
- Figure 32: Europe Polyurethane Composites Market Volume (grams per cubic centimeter ), by End-user Industry 2025 & 2033
- Figure 33: Europe Polyurethane Composites Market Revenue Share (%), by End-user Industry 2025 & 2033
- Figure 34: Europe Polyurethane Composites Market Volume Share (%), by End-user Industry 2025 & 2033
- Figure 35: Europe Polyurethane Composites Market Revenue (million), by Country 2025 & 2033
- Figure 36: Europe Polyurethane Composites Market Volume (grams per cubic centimeter ), by Country 2025 & 2033
- Figure 37: Europe Polyurethane Composites Market Revenue Share (%), by Country 2025 & 2033
- Figure 38: Europe Polyurethane Composites Market Volume Share (%), by Country 2025 & 2033
- Figure 39: South America Polyurethane Composites Market Revenue (million), by Fiber Type 2025 & 2033
- Figure 40: South America Polyurethane Composites Market Volume (grams per cubic centimeter ), by Fiber Type 2025 & 2033
- Figure 41: South America Polyurethane Composites Market Revenue Share (%), by Fiber Type 2025 & 2033
- Figure 42: South America Polyurethane Composites Market Volume Share (%), by Fiber Type 2025 & 2033
- Figure 43: South America Polyurethane Composites Market Revenue (million), by End-user Industry 2025 & 2033
- Figure 44: South America Polyurethane Composites Market Volume (grams per cubic centimeter ), by End-user Industry 2025 & 2033
- Figure 45: South America Polyurethane Composites Market Revenue Share (%), by End-user Industry 2025 & 2033
- Figure 46: South America Polyurethane Composites Market Volume Share (%), by End-user Industry 2025 & 2033
- Figure 47: South America Polyurethane Composites Market Revenue (million), by Country 2025 & 2033
- Figure 48: South America Polyurethane Composites Market Volume (grams per cubic centimeter ), by Country 2025 & 2033
- Figure 49: South America Polyurethane Composites Market Revenue Share (%), by Country 2025 & 2033
- Figure 50: South America Polyurethane Composites Market Volume Share (%), by Country 2025 & 2033
- Figure 51: Middle East and Africa Polyurethane Composites Market Revenue (million), by Fiber Type 2025 & 2033
- Figure 52: Middle East and Africa Polyurethane Composites Market Volume (grams per cubic centimeter ), by Fiber Type 2025 & 2033
- Figure 53: Middle East and Africa Polyurethane Composites Market Revenue Share (%), by Fiber Type 2025 & 2033
- Figure 54: Middle East and Africa Polyurethane Composites Market Volume Share (%), by Fiber Type 2025 & 2033
- Figure 55: Middle East and Africa Polyurethane Composites Market Revenue (million), by End-user Industry 2025 & 2033
- Figure 56: Middle East and Africa Polyurethane Composites Market Volume (grams per cubic centimeter ), by End-user Industry 2025 & 2033
- Figure 57: Middle East and Africa Polyurethane Composites Market Revenue Share (%), by End-user Industry 2025 & 2033
- Figure 58: Middle East and Africa Polyurethane Composites Market Volume Share (%), by End-user Industry 2025 & 2033
- Figure 59: Middle East and Africa Polyurethane Composites Market Revenue (million), by Country 2025 & 2033
- Figure 60: Middle East and Africa Polyurethane Composites Market Volume (grams per cubic centimeter ), by Country 2025 & 2033
- Figure 61: Middle East and Africa Polyurethane Composites Market Revenue Share (%), by Country 2025 & 2033
- Figure 62: Middle East and Africa Polyurethane Composites Market Volume Share (%), by Country 2025 & 2033
List of Tables
- Table 1: Global Polyurethane Composites Market Revenue million Forecast, by Fiber Type 2020 & 2033
- Table 2: Global Polyurethane Composites Market Volume grams per cubic centimeter Forecast, by Fiber Type 2020 & 2033
- Table 3: Global Polyurethane Composites Market Revenue million Forecast, by End-user Industry 2020 & 2033
- Table 4: Global Polyurethane Composites Market Volume grams per cubic centimeter Forecast, by End-user Industry 2020 & 2033
- Table 5: Global Polyurethane Composites Market Revenue million Forecast, by Region 2020 & 2033
- Table 6: Global Polyurethane Composites Market Volume grams per cubic centimeter Forecast, by Region 2020 & 2033
- Table 7: Global Polyurethane Composites Market Revenue million Forecast, by Fiber Type 2020 & 2033
- Table 8: Global Polyurethane Composites Market Volume grams per cubic centimeter Forecast, by Fiber Type 2020 & 2033
- Table 9: Global Polyurethane Composites Market Revenue million Forecast, by End-user Industry 2020 & 2033
- Table 10: Global Polyurethane Composites Market Volume grams per cubic centimeter Forecast, by End-user Industry 2020 & 2033
- Table 11: Global Polyurethane Composites Market Revenue million Forecast, by Country 2020 & 2033
- Table 12: Global Polyurethane Composites Market Volume grams per cubic centimeter Forecast, by Country 2020 & 2033
- Table 13: China Polyurethane Composites Market Revenue (million) Forecast, by Application 2020 & 2033
- Table 14: China Polyurethane Composites Market Volume (grams per cubic centimeter ) Forecast, by Application 2020 & 2033
- Table 15: India Polyurethane Composites Market Revenue (million) Forecast, by Application 2020 & 2033
- Table 16: India Polyurethane Composites Market Volume (grams per cubic centimeter ) Forecast, by Application 2020 & 2033
- Table 17: Japan Polyurethane Composites Market Revenue (million) Forecast, by Application 2020 & 2033
- Table 18: Japan Polyurethane Composites Market Volume (grams per cubic centimeter ) Forecast, by Application 2020 & 2033
- Table 19: South Korea Polyurethane Composites Market Revenue (million) Forecast, by Application 2020 & 2033
- Table 20: South Korea Polyurethane Composites Market Volume (grams per cubic centimeter ) Forecast, by Application 2020 & 2033
- Table 21: Rest of Asia Pacific Polyurethane Composites Market Revenue (million) Forecast, by Application 2020 & 2033
- Table 22: Rest of Asia Pacific Polyurethane Composites Market Volume (grams per cubic centimeter ) Forecast, by Application 2020 & 2033
- Table 23: Global Polyurethane Composites Market Revenue million Forecast, by Fiber Type 2020 & 2033
- Table 24: Global Polyurethane Composites Market Volume grams per cubic centimeter Forecast, by Fiber Type 2020 & 2033
- Table 25: Global Polyurethane Composites Market Revenue million Forecast, by End-user Industry 2020 & 2033
- Table 26: Global Polyurethane Composites Market Volume grams per cubic centimeter Forecast, by End-user Industry 2020 & 2033
- Table 27: Global Polyurethane Composites Market Revenue million Forecast, by Country 2020 & 2033
- Table 28: Global Polyurethane Composites Market Volume grams per cubic centimeter Forecast, by Country 2020 & 2033
- Table 29: United States Polyurethane Composites Market Revenue (million) Forecast, by Application 2020 & 2033
- Table 30: United States Polyurethane Composites Market Volume (grams per cubic centimeter ) Forecast, by Application 2020 & 2033
- Table 31: Canada Polyurethane Composites Market Revenue (million) Forecast, by Application 2020 & 2033
- Table 32: Canada Polyurethane Composites Market Volume (grams per cubic centimeter ) Forecast, by Application 2020 & 2033
- Table 33: Mexico Polyurethane Composites Market Revenue (million) Forecast, by Application 2020 & 2033
- Table 34: Mexico Polyurethane Composites Market Volume (grams per cubic centimeter ) Forecast, by Application 2020 & 2033
- Table 35: Global Polyurethane Composites Market Revenue million Forecast, by Fiber Type 2020 & 2033
- Table 36: Global Polyurethane Composites Market Volume grams per cubic centimeter Forecast, by Fiber Type 2020 & 2033
- Table 37: Global Polyurethane Composites Market Revenue million Forecast, by End-user Industry 2020 & 2033
- Table 38: Global Polyurethane Composites Market Volume grams per cubic centimeter Forecast, by End-user Industry 2020 & 2033
- Table 39: Global Polyurethane Composites Market Revenue million Forecast, by Country 2020 & 2033
- Table 40: Global Polyurethane Composites Market Volume grams per cubic centimeter Forecast, by Country 2020 & 2033
- Table 41: Germany Polyurethane Composites Market Revenue (million) Forecast, by Application 2020 & 2033
- Table 42: Germany Polyurethane Composites Market Volume (grams per cubic centimeter ) Forecast, by Application 2020 & 2033
- Table 43: United Kingdom Polyurethane Composites Market Revenue (million) Forecast, by Application 2020 & 2033
- Table 44: United Kingdom Polyurethane Composites Market Volume (grams per cubic centimeter ) Forecast, by Application 2020 & 2033
- Table 45: Italy Polyurethane Composites Market Revenue (million) Forecast, by Application 2020 & 2033
- Table 46: Italy Polyurethane Composites Market Volume (grams per cubic centimeter ) Forecast, by Application 2020 & 2033
- Table 47: France Polyurethane Composites Market Revenue (million) Forecast, by Application 2020 & 2033
- Table 48: France Polyurethane Composites Market Volume (grams per cubic centimeter ) Forecast, by Application 2020 & 2033
- Table 49: Rest of Europe Polyurethane Composites Market Revenue (million) Forecast, by Application 2020 & 2033
- Table 50: Rest of Europe Polyurethane Composites Market Volume (grams per cubic centimeter ) Forecast, by Application 2020 & 2033
- Table 51: Global Polyurethane Composites Market Revenue million Forecast, by Fiber Type 2020 & 2033
- Table 52: Global Polyurethane Composites Market Volume grams per cubic centimeter Forecast, by Fiber Type 2020 & 2033
- Table 53: Global Polyurethane Composites Market Revenue million Forecast, by End-user Industry 2020 & 2033
- Table 54: Global Polyurethane Composites Market Volume grams per cubic centimeter Forecast, by End-user Industry 2020 & 2033
- Table 55: Global Polyurethane Composites Market Revenue million Forecast, by Country 2020 & 2033
- Table 56: Global Polyurethane Composites Market Volume grams per cubic centimeter Forecast, by Country 2020 & 2033
- Table 57: Brazil Polyurethane Composites Market Revenue (million) Forecast, by Application 2020 & 2033
- Table 58: Brazil Polyurethane Composites Market Volume (grams per cubic centimeter ) Forecast, by Application 2020 & 2033
- Table 59: Argentina Polyurethane Composites Market Revenue (million) Forecast, by Application 2020 & 2033
- Table 60: Argentina Polyurethane Composites Market Volume (grams per cubic centimeter ) Forecast, by Application 2020 & 2033
- Table 61: Rest of South America Polyurethane Composites Market Revenue (million) Forecast, by Application 2020 & 2033
- Table 62: Rest of South America Polyurethane Composites Market Volume (grams per cubic centimeter ) Forecast, by Application 2020 & 2033
- Table 63: Global Polyurethane Composites Market Revenue million Forecast, by Fiber Type 2020 & 2033
- Table 64: Global Polyurethane Composites Market Volume grams per cubic centimeter Forecast, by Fiber Type 2020 & 2033
- Table 65: Global Polyurethane Composites Market Revenue million Forecast, by End-user Industry 2020 & 2033
- Table 66: Global Polyurethane Composites Market Volume grams per cubic centimeter Forecast, by End-user Industry 2020 & 2033
- Table 67: Global Polyurethane Composites Market Revenue million Forecast, by Country 2020 & 2033
- Table 68: Global Polyurethane Composites Market Volume grams per cubic centimeter Forecast, by Country 2020 & 2033
- Table 69: Saudi Arabia Polyurethane Composites Market Revenue (million) Forecast, by Application 2020 & 2033
- Table 70: Saudi Arabia Polyurethane Composites Market Volume (grams per cubic centimeter ) Forecast, by Application 2020 & 2033
- Table 71: South Africa Polyurethane Composites Market Revenue (million) Forecast, by Application 2020 & 2033
- Table 72: South Africa Polyurethane Composites Market Volume (grams per cubic centimeter ) Forecast, by Application 2020 & 2033
- Table 73: Rest of Middle East and Africa Polyurethane Composites Market Revenue (million) Forecast, by Application 2020 & 2033
- Table 74: Rest of Middle East and Africa Polyurethane Composites Market Volume (grams per cubic centimeter ) Forecast, by Application 2020 & 2033
Frequently Asked Questions
1. What is the projected Compound Annual Growth Rate (CAGR) of the Polyurethane Composites Market?
The projected CAGR is approximately 5.96%.
2. Which companies are prominent players in the Polyurethane Composites Market?
Key companies in the market include ELANTAS, BASF SE, Huntsman International LLC, Linecross, Webasto Group, Henkel Corporation, Covestro AG.
3. What are the main segments of the Polyurethane Composites Market?
The market segments include Fiber Type, End-user Industry.
4. Can you provide details about the market size?
The market size is estimated to be USD 870.93 million as of 2022.
5. What are some drivers contributing to market growth?
; Increasing Demand for the Lightweight Materials From the Transportation Industry; Growing Demand from the Building and Construction Industry.
6. What are the notable trends driving market growth?
Increasing demand from the Transportation Industry.
7. Are there any restraints impacting market growth?
; Slowdown in the Global Automotive Production; High Production Costs.
8. Can you provide examples of recent developments in the market?
N/A
9. What pricing options are available for accessing the report?
Pricing options include single-user, multi-user, and enterprise licenses priced at USD 4750, USD 5250, and USD 8750 respectively.
10. Is the market size provided in terms of value or volume?
The market size is provided in terms of value, measured in million and volume, measured in grams per cubic centimeter .
11. Are there any specific market keywords associated with the report?
Yes, the market keyword associated with the report is "Polyurethane Composites Market," which aids in identifying and referencing the specific market segment covered.
12. How do I determine which pricing option suits my needs best?
The pricing options vary based on user requirements and access needs. Individual users may opt for single-user licenses, while businesses requiring broader access may choose multi-user or enterprise licenses for cost-effective access to the report.
13. Are there any additional resources or data provided in the Polyurethane Composites Market report?
While the report offers comprehensive insights, it's advisable to review the specific contents or supplementary materials provided to ascertain if additional resources or data are available.
14. How can I stay updated on further developments or reports in the Polyurethane Composites Market?
To stay informed about further developments, trends, and reports in the Polyurethane Composites Market, consider subscribing to industry newsletters, following relevant companies and organizations, or regularly checking reputable industry news sources and publications.
Methodology
Step 1 - Identification of Relevant Samples Size from Population Database


Step 2 - Approaches for Defining Global Market Size (Value, Volume* & Price*)

Note*: In applicable scenarios
Step 3 - Data Sources
Primary Research
- Web Analytics
- Survey Reports
- Research Institute
- Latest Research Reports
- Opinion Leaders
Secondary Research
- Annual Reports
- White Paper
- Latest Press Release
- Industry Association
- Paid Database
- Investor Presentations

Step 4 - Data Triangulation
Involves using different sources of information in order to increase the validity of a study
These sources are likely to be stakeholders in a program - participants, other researchers, program staff, other community members, and so on.
Then we put all data in single framework & apply various statistical tools to find out the dynamic on the market.
During the analysis stage, feedback from the stakeholder groups would be compared to determine areas of agreement as well as areas of divergence