

Key Insights
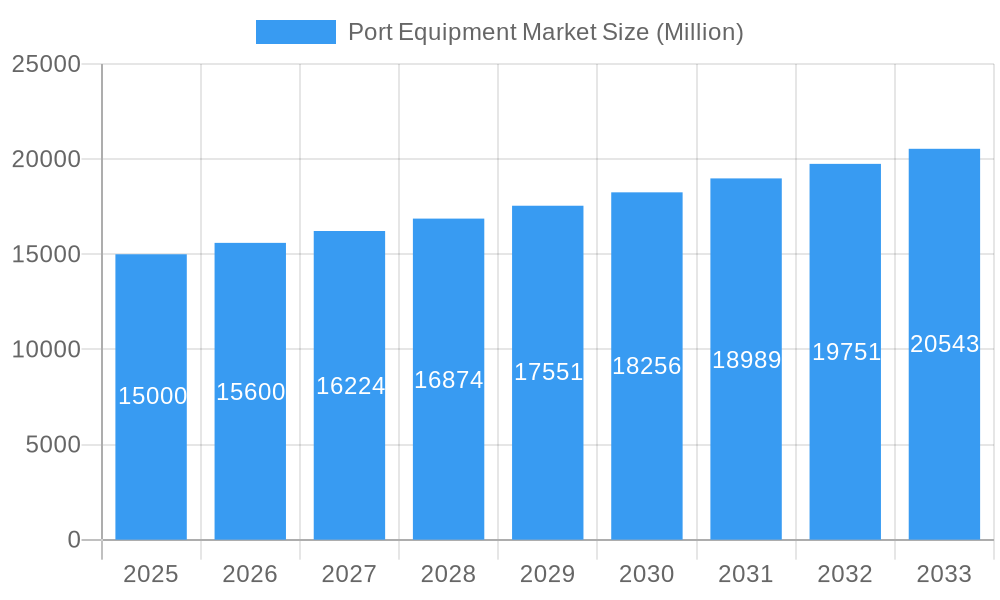
The global port equipment market is poised for substantial expansion, driven by surging global trade, extensive port modernization efforts, and a growing demand for optimized cargo handling solutions. The market, valued at $20.4 billion in 2025, is projected to grow at a Compound Annual Growth Rate (CAGR) of 5.7% from 2025 to 2033. Key growth drivers include the increasing integration of automation and advanced technologies, such as automated guided vehicles (AGVs) and automated stacking cranes, which enhance operational efficiency and reduce labor expenditures. The trend towards larger container vessels also mandates the deployment of high-capacity port equipment for rapid turnaround times. Additionally, stringent environmental regulations are accelerating the adoption of sustainable, eco-friendly equipment, including electric and hybrid port machinery. While Asia-Pacific is expected to lead market growth due to its concentration of major ports and robust trade activity in China and India, significant opportunities also exist in North America and Europe, fueled by infrastructure investments and expansion projects.
Port Equipment Market Market Size (In Billion)
Market growth faces certain constraints, including the significant initial capital investment required for advanced equipment, the necessity for a skilled workforce to operate and maintain sophisticated systems, and the potential impact of supply chain disruptions on equipment availability. By equipment type, cranes, reach stackers, and forklifts represent leading segments, addressing diverse port operational needs. Container handling remains the predominant application, underscoring the critical role of efficient container throughput for overall port performance. Within the fuel type segmentation, the market is witnessing a shift towards electric and hybrid solutions, spurred by environmental imperatives and the prospect of long-term operational cost savings, despite higher initial purchase prices. Leading market participants, including ABB Ltd, Liebherr Group, Konecranes Oyj, and Kalmar, are actively pursuing technological advancements, product innovation, and strategic collaborations to secure their competitive positions in this evolving landscape.
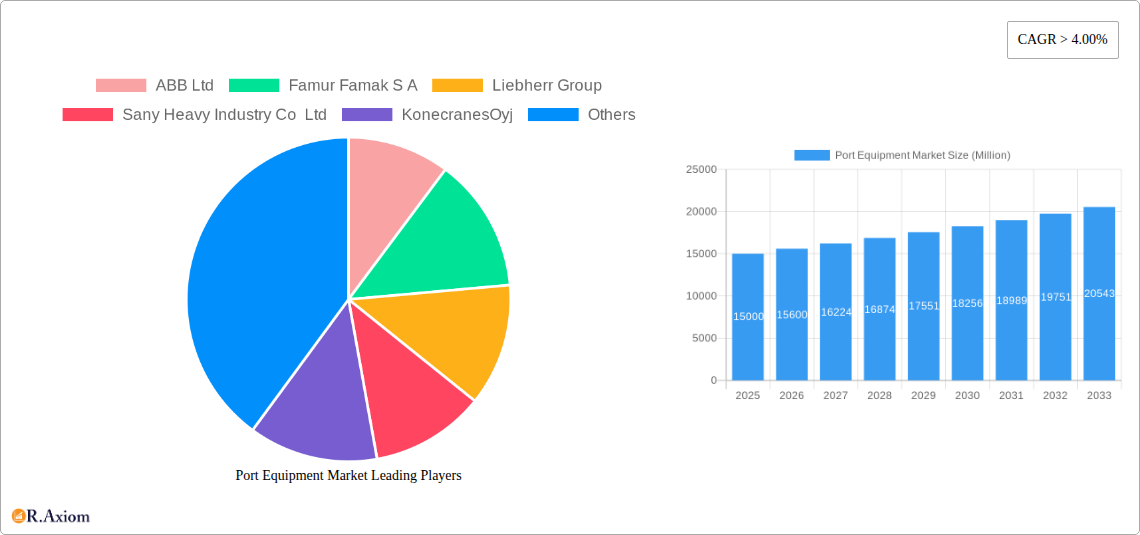
Port Equipment Market Company Market Share
Port Equipment Market: A Comprehensive Analysis & Forecast (2019-2033)
This in-depth report provides a comprehensive analysis of the global Port Equipment market, offering valuable insights for stakeholders across the industry. The study covers the period from 2019 to 2033, with 2025 serving as the base and estimated year. The report meticulously examines market dynamics, growth drivers, competitive landscapes, and future projections, providing actionable intelligence for informed decision-making. The market is segmented by equipment type (Cranes, Trucks, Reach Stackers, Forklifts, Others), application (Container Handling, Ship Handling), and fuel type (Diesel, Electric, Hybrid). Key players analyzed include ABB Ltd, Famur Famak S A, Liebherr Group, Sany Heavy Industry Co Ltd, Konecranes Oyj, Cavote, TTS Group, Kalmar, CVS Ferrari, and Hyster-Yale Group. The report projects a market value of xx Million by 2033, exhibiting a CAGR of xx% during the forecast period (2025-2033).
Port Equipment Market Market Concentration & Innovation
The Port Equipment market exhibits a moderately concentrated structure, with a few major players holding significant market share. While precise market share figures for each company are proprietary data within the full report, Liebherr Group, Konecranes Oyj, and Kalmar are among the prominent players, collectively accounting for an estimated xx% of the market in 2025. The market is characterized by continuous innovation, driven by factors such as increasing port automation, the need for enhanced efficiency, and stringent environmental regulations.
- Innovation Drivers: Automation technologies (e.g., autonomous vehicles, remote operation), electrification of equipment, and the development of hybrid powertrains are major drivers of innovation.
- Regulatory Frameworks: International Maritime Organization (IMO) regulations on emissions and port safety standards significantly influence technological advancements and market adoption.
- Product Substitutes: While direct substitutes are limited, the market experiences competition from alternative handling methods and optimization software.
- End-User Trends: Growing port capacity requirements, rising container volumes, and the demand for faster turnaround times are key end-user trends.
- M&A Activities: The market has witnessed a moderate level of M&A activity in recent years, with deal values ranging from xx Million to xx Million, primarily focused on consolidating market share and expanding product portfolios. Examples include [mention specific M&A deals, if available, with values].
Port Equipment Market Industry Trends & Insights
The Port Equipment market is experiencing robust growth, propelled by a confluence of factors. Global trade expansion continues to drive demand for efficient port infrastructure and handling equipment. The increasing adoption of automation technologies is streamlining port operations, boosting productivity and reducing operational costs. Consumer preference for faster and more reliable shipping has also pushed port authorities to invest in advanced equipment.
The market’s growth trajectory reflects a positive outlook for global trade, particularly in Asia and Europe. Technological disruptions, such as the introduction of autonomous cranes and electric trucks, are reshaping the competitive landscape, favoring companies that can adapt and innovate. Competition remains intense, with established players focusing on enhancing product features and service offerings, and new entrants seeking niche market opportunities. The market penetration of electric and hybrid equipment is growing steadily, driven by environmental concerns and sustainability initiatives, although diesel-powered equipment continues to dominate. The report projects a CAGR of xx% for the overall market during the forecast period (2025-2033).
Dominant Markets & Segments in Port Equipment Market
The Asia-Pacific region currently holds the largest market share, driven by robust port infrastructure development and significant trade volumes. China and Southeast Asian nations are particularly strong contributors. Within the segment breakdown:
- Equipment Type: Cranes represent the largest segment, followed by trucks and reach stackers. The demand for specialized equipment, like forklifts and other handling devices, is also significant and growing.
- Application: Container handling dominates the market, reflecting the growth in containerized shipping. Ship handling is also a substantial segment, particularly in larger ports.
- Fuel Type: Diesel currently holds the largest market share, but electric and hybrid technologies are rapidly gaining traction due to environmental regulations and cost savings in the long run.
Key Drivers:
- Economic Policies: Government investments in port infrastructure and supportive trade policies significantly influence market growth.
- Infrastructure Development: Ongoing expansions and upgrades of port facilities worldwide fuel demand for new equipment.
Port Equipment Market Product Developments
Recent product innovations focus on enhancing efficiency, sustainability, and safety. Manufacturers are actively incorporating automation, remote operation capabilities, and hybrid/electric powertrains into their equipment. These advancements offer significant advantages in terms of reduced operating costs, lower emissions, and improved overall performance. The market is witnessing a shift towards intelligent port solutions, integrating various technologies to optimize port operations.
Report Scope & Segmentation Analysis
This report segments the Port Equipment market by Equipment Type (Cranes, Trucks, Reach Stackers, Forklifts, Others), Application (Container Handling, Ship Handling), and Fuel Type (Diesel, Electric, Hybrid). Each segment’s analysis includes growth projections, market size estimations (in Million), and competitive landscapes. For instance, the Crane segment is expected to witness significant growth driven by automation and capacity expansion needs. Similarly, the Container Handling application segment will experience strong growth aligned with global container shipping volume. The Electric and Hybrid fuel types are poised for significant expansion due to environmental regulations and cost-effectiveness.
Key Drivers of Port Equipment Market Growth
Several factors drive the growth of the Port Equipment market. The increasing volume of global trade fuels demand for efficient port handling equipment. Government investments in port infrastructure development and modernization contribute significantly. Technological advancements, especially in automation and electrification, are increasing equipment efficiency and reducing operational costs. Stringent environmental regulations are pushing the adoption of eco-friendly technologies.
Challenges in the Port Equipment Market Sector
The Port Equipment market faces challenges such as high initial investment costs for advanced equipment, potential supply chain disruptions impacting production and delivery, and intense competition among established players. Regulatory compliance and the need for skilled labor also pose challenges. The volatility of global trade and economic fluctuations also impact market growth.
Emerging Opportunities in Port Equipment Market
Emerging opportunities lie in the growing adoption of automation technologies, particularly autonomous vehicles and remote operation systems. The increasing demand for eco-friendly equipment, like electric and hybrid models, presents significant growth potential. Expanding port infrastructure in developing economies offers considerable market expansion opportunities.
Leading Players in the Port Equipment Market Market
- ABB Ltd
- Famur Famak S A
- Liebherr Group
- Sany Heavy Industry Co Ltd
- Konecranes Oyj
- Cavote
- TTS Group
- Kalmar
- CVS Ferrari
- Hyster-Yale Group
Key Developments in Port Equipment Market Industry
- 2023 Q4: Konecranes Oyj launched a new line of automated stacking cranes, enhancing efficiency in container handling.
- 2022 Q3: Liebherr Group announced a significant investment in R&D for electric port equipment.
- 2021 Q2: [Add other relevant developments with dates]
Strategic Outlook for Port Equipment Market Market
The Port Equipment market is poised for continued growth, driven by increasing global trade, infrastructure development, and technological advancements. The shift towards automation, electrification, and digitalization offers significant opportunities for market players. Focusing on innovation, strategic partnerships, and efficient supply chain management will be crucial for success in this dynamic market.
Port Equipment Market Segmentation
-
1. Equipment Type
- 1.1. Cranes
- 1.2. Trucks
- 1.3. Reach Stackers
- 1.4. Forklifts
- 1.5. Others
-
2. Application
- 2.1. Container Handling
- 2.2. Ship Handling
-
3. Fuel Type
- 3.1. Diesel
- 3.2. Electric
- 3.3. Hybrid
Port Equipment Market Segmentation By Geography
-
1. North America
- 1.1. United States
- 1.2. Canada
- 1.3. Rest of North America
-
2. Europe
- 2.1. Germany
- 2.2. United Kingdom
- 2.3. France
- 2.4. Rest of Europe
-
3. Asia Pacific
- 3.1. India
- 3.2. China
- 3.3. Japan
- 3.4. South Korea
- 3.5. Rest of Asia Pacific
-
4. Rest of the World
- 4.1. Brazil
- 4.2. Mexico
- 4.3. United Arab Emirates
- 4.4. Other Countries
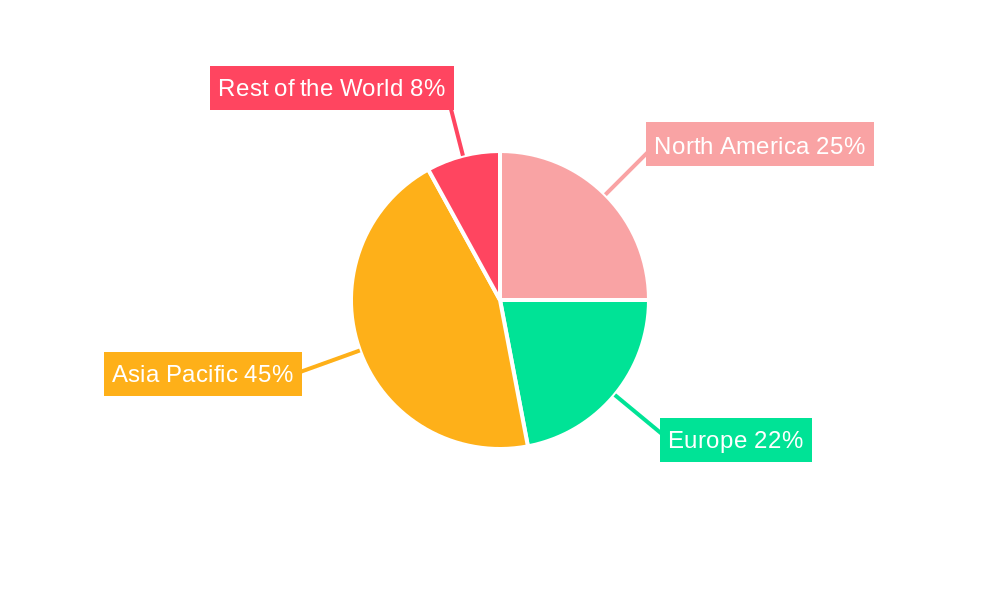
Port Equipment Market Regional Market Share
Geographic Coverage of Port Equipment Market
Port Equipment Market REPORT HIGHLIGHTS
| Aspects | Details |
|---|---|
| Study Period | 2020-2034 |
| Base Year | 2025 |
| Estimated Year | 2026 |
| Forecast Period | 2026-2034 |
| Historical Period | 2020-2025 |
| Growth Rate | CAGR of 5.7% from 2020-2034 |
| Segmentation |
|
Table of Contents
- 1. Introduction
- 1.1. Research Scope
- 1.2. Market Segmentation
- 1.3. Research Objective
- 1.4. Definitions and Assumptions
- 2. Executive Summary
- 2.1. Market Snapshot
- 3. Market Dynamics
- 3.1. Market Drivers
- 3.2. Market Restrains
- 3.3. Market Trends
- 3.4. Market Opportunities
- 4. Market Factor Analysis
- 4.1. Porters Five Forces
- 4.1.1. Bargaining Power of Suppliers
- 4.1.2. Bargaining Power of Buyers
- 4.1.3. Threat of New Entrants
- 4.1.4. Threat of Substitutes
- 4.1.5. Competitive Rivalry
- 4.2. PESTEL analysis
- 4.3. BCG Analysis
- 4.3.1. Stars (High Growth, High Market Share)
- 4.3.2. Cash Cows (Low Growth, High Market Share)
- 4.3.3. Question Mark (High Growth, Low Market Share)
- 4.3.4. Dogs (Low Growth, Low Market Share)
- 4.4. Ansoff Matrix Analysis
- 4.5. Supply Chain Analysis
- 4.6. Regulatory Landscape
- 4.7. Current Market Potential and Opportunity Assessment (TAM–SAM–SOM Framework)
- 4.8. RAX Analyst Note
- 4.1. Porters Five Forces
- 5. Market Analysis, Insights and Forecast 2021-2033
- 5.1. Market Analysis, Insights and Forecast - by Equipment Type
- 5.1.1. Cranes
- 5.1.2. Trucks
- 5.1.3. Reach Stackers
- 5.1.4. Forklifts
- 5.1.5. Others
- 5.2. Market Analysis, Insights and Forecast - by Application
- 5.2.1. Container Handling
- 5.2.2. Ship Handling
- 5.3. Market Analysis, Insights and Forecast - by Fuel Type
- 5.3.1. Diesel
- 5.3.2. Electric
- 5.3.3. Hybrid
- 5.4. Market Analysis, Insights and Forecast - by Region
- 5.4.1. North America
- 5.4.2. Europe
- 5.4.3. Asia Pacific
- 5.4.4. Rest of the World
- 5.1. Market Analysis, Insights and Forecast - by Equipment Type
- 6. Global Port Equipment Market Analysis, Insights and Forecast, 2021-2033
- 6.1. Market Analysis, Insights and Forecast - by Equipment Type
- 6.1.1. Cranes
- 6.1.2. Trucks
- 6.1.3. Reach Stackers
- 6.1.4. Forklifts
- 6.1.5. Others
- 6.2. Market Analysis, Insights and Forecast - by Application
- 6.2.1. Container Handling
- 6.2.2. Ship Handling
- 6.3. Market Analysis, Insights and Forecast - by Fuel Type
- 6.3.1. Diesel
- 6.3.2. Electric
- 6.3.3. Hybrid
- 6.1. Market Analysis, Insights and Forecast - by Equipment Type
- 7. North America Port Equipment Market Analysis, Insights and Forecast, 2020-2032
- 7.1. Market Analysis, Insights and Forecast - by Equipment Type
- 7.1.1. Cranes
- 7.1.2. Trucks
- 7.1.3. Reach Stackers
- 7.1.4. Forklifts
- 7.1.5. Others
- 7.2. Market Analysis, Insights and Forecast - by Application
- 7.2.1. Container Handling
- 7.2.2. Ship Handling
- 7.3. Market Analysis, Insights and Forecast - by Fuel Type
- 7.3.1. Diesel
- 7.3.2. Electric
- 7.3.3. Hybrid
- 7.1. Market Analysis, Insights and Forecast - by Equipment Type
- 8. Europe Port Equipment Market Analysis, Insights and Forecast, 2020-2032
- 8.1. Market Analysis, Insights and Forecast - by Equipment Type
- 8.1.1. Cranes
- 8.1.2. Trucks
- 8.1.3. Reach Stackers
- 8.1.4. Forklifts
- 8.1.5. Others
- 8.2. Market Analysis, Insights and Forecast - by Application
- 8.2.1. Container Handling
- 8.2.2. Ship Handling
- 8.3. Market Analysis, Insights and Forecast - by Fuel Type
- 8.3.1. Diesel
- 8.3.2. Electric
- 8.3.3. Hybrid
- 8.1. Market Analysis, Insights and Forecast - by Equipment Type
- 9. Asia Pacific Port Equipment Market Analysis, Insights and Forecast, 2020-2032
- 9.1. Market Analysis, Insights and Forecast - by Equipment Type
- 9.1.1. Cranes
- 9.1.2. Trucks
- 9.1.3. Reach Stackers
- 9.1.4. Forklifts
- 9.1.5. Others
- 9.2. Market Analysis, Insights and Forecast - by Application
- 9.2.1. Container Handling
- 9.2.2. Ship Handling
- 9.3. Market Analysis, Insights and Forecast - by Fuel Type
- 9.3.1. Diesel
- 9.3.2. Electric
- 9.3.3. Hybrid
- 9.1. Market Analysis, Insights and Forecast - by Equipment Type
- 10. Rest of the World Port Equipment Market Analysis, Insights and Forecast, 2020-2032
- 10.1. Market Analysis, Insights and Forecast - by Equipment Type
- 10.1.1. Cranes
- 10.1.2. Trucks
- 10.1.3. Reach Stackers
- 10.1.4. Forklifts
- 10.1.5. Others
- 10.2. Market Analysis, Insights and Forecast - by Application
- 10.2.1. Container Handling
- 10.2.2. Ship Handling
- 10.3. Market Analysis, Insights and Forecast - by Fuel Type
- 10.3.1. Diesel
- 10.3.2. Electric
- 10.3.3. Hybrid
- 10.1. Market Analysis, Insights and Forecast - by Equipment Type
- 11. Competitive Analysis
- 11.1. Company Profiles
- 11.1.1 ABB Ltd
- 11.1.1.1. Company Overview
- 11.1.1.2. Products
- 11.1.1.3. Company Financials
- 11.1.1.4. SWOT Analysis
- 11.1.2 Famur Famak S A
- 11.1.2.1. Company Overview
- 11.1.2.2. Products
- 11.1.2.3. Company Financials
- 11.1.2.4. SWOT Analysis
- 11.1.3 Liebherr Group
- 11.1.3.1. Company Overview
- 11.1.3.2. Products
- 11.1.3.3. Company Financials
- 11.1.3.4. SWOT Analysis
- 11.1.4 Sany Heavy Industry Co Ltd
- 11.1.4.1. Company Overview
- 11.1.4.2. Products
- 11.1.4.3. Company Financials
- 11.1.4.4. SWOT Analysis
- 11.1.5 KonecranesOyj
- 11.1.5.1. Company Overview
- 11.1.5.2. Products
- 11.1.5.3. Company Financials
- 11.1.5.4. SWOT Analysis
- 11.1.6 Cavote
- 11.1.6.1. Company Overview
- 11.1.6.2. Products
- 11.1.6.3. Company Financials
- 11.1.6.4. SWOT Analysis
- 11.1.7 TTS Group
- 11.1.7.1. Company Overview
- 11.1.7.2. Products
- 11.1.7.3. Company Financials
- 11.1.7.4. SWOT Analysis
- 11.1.8 Kalmar
- 11.1.8.1. Company Overview
- 11.1.8.2. Products
- 11.1.8.3. Company Financials
- 11.1.8.4. SWOT Analysis
- 11.1.9 CVS Ferrari
- 11.1.9.1. Company Overview
- 11.1.9.2. Products
- 11.1.9.3. Company Financials
- 11.1.9.4. SWOT Analysis
- 11.1.10 Hyster-Yale Group
- 11.1.10.1. Company Overview
- 11.1.10.2. Products
- 11.1.10.3. Company Financials
- 11.1.10.4. SWOT Analysis
- 11.1.1 ABB Ltd
- 11.2. Market Entropy
- 11.2.1 Company's Key Areas Served
- 11.2.2 Recent Developments
- 11.3. Company Market Share Analysis 2025
- 11.3.1 Top 5 Companies Market Share Analysis
- 11.3.2 Top 3 Companies Market Share Analysis
- 11.4. List of Potential Customers
- 12. Research Methodology
List of Figures
- Figure 1: Global Port Equipment Market Revenue Breakdown (billion, %) by Region 2025 & 2033
- Figure 2: North America Port Equipment Market Revenue (billion), by Equipment Type 2025 & 2033
- Figure 3: North America Port Equipment Market Revenue Share (%), by Equipment Type 2025 & 2033
- Figure 4: North America Port Equipment Market Revenue (billion), by Application 2025 & 2033
- Figure 5: North America Port Equipment Market Revenue Share (%), by Application 2025 & 2033
- Figure 6: North America Port Equipment Market Revenue (billion), by Fuel Type 2025 & 2033
- Figure 7: North America Port Equipment Market Revenue Share (%), by Fuel Type 2025 & 2033
- Figure 8: North America Port Equipment Market Revenue (billion), by Country 2025 & 2033
- Figure 9: North America Port Equipment Market Revenue Share (%), by Country 2025 & 2033
- Figure 10: Europe Port Equipment Market Revenue (billion), by Equipment Type 2025 & 2033
- Figure 11: Europe Port Equipment Market Revenue Share (%), by Equipment Type 2025 & 2033
- Figure 12: Europe Port Equipment Market Revenue (billion), by Application 2025 & 2033
- Figure 13: Europe Port Equipment Market Revenue Share (%), by Application 2025 & 2033
- Figure 14: Europe Port Equipment Market Revenue (billion), by Fuel Type 2025 & 2033
- Figure 15: Europe Port Equipment Market Revenue Share (%), by Fuel Type 2025 & 2033
- Figure 16: Europe Port Equipment Market Revenue (billion), by Country 2025 & 2033
- Figure 17: Europe Port Equipment Market Revenue Share (%), by Country 2025 & 2033
- Figure 18: Asia Pacific Port Equipment Market Revenue (billion), by Equipment Type 2025 & 2033
- Figure 19: Asia Pacific Port Equipment Market Revenue Share (%), by Equipment Type 2025 & 2033
- Figure 20: Asia Pacific Port Equipment Market Revenue (billion), by Application 2025 & 2033
- Figure 21: Asia Pacific Port Equipment Market Revenue Share (%), by Application 2025 & 2033
- Figure 22: Asia Pacific Port Equipment Market Revenue (billion), by Fuel Type 2025 & 2033
- Figure 23: Asia Pacific Port Equipment Market Revenue Share (%), by Fuel Type 2025 & 2033
- Figure 24: Asia Pacific Port Equipment Market Revenue (billion), by Country 2025 & 2033
- Figure 25: Asia Pacific Port Equipment Market Revenue Share (%), by Country 2025 & 2033
- Figure 26: Rest of the World Port Equipment Market Revenue (billion), by Equipment Type 2025 & 2033
- Figure 27: Rest of the World Port Equipment Market Revenue Share (%), by Equipment Type 2025 & 2033
- Figure 28: Rest of the World Port Equipment Market Revenue (billion), by Application 2025 & 2033
- Figure 29: Rest of the World Port Equipment Market Revenue Share (%), by Application 2025 & 2033
- Figure 30: Rest of the World Port Equipment Market Revenue (billion), by Fuel Type 2025 & 2033
- Figure 31: Rest of the World Port Equipment Market Revenue Share (%), by Fuel Type 2025 & 2033
- Figure 32: Rest of the World Port Equipment Market Revenue (billion), by Country 2025 & 2033
- Figure 33: Rest of the World Port Equipment Market Revenue Share (%), by Country 2025 & 2033
List of Tables
- Table 1: Global Port Equipment Market Revenue billion Forecast, by Equipment Type 2020 & 2033
- Table 2: Global Port Equipment Market Revenue billion Forecast, by Application 2020 & 2033
- Table 3: Global Port Equipment Market Revenue billion Forecast, by Fuel Type 2020 & 2033
- Table 4: Global Port Equipment Market Revenue billion Forecast, by Region 2020 & 2033
- Table 5: Global Port Equipment Market Revenue billion Forecast, by Equipment Type 2020 & 2033
- Table 6: Global Port Equipment Market Revenue billion Forecast, by Application 2020 & 2033
- Table 7: Global Port Equipment Market Revenue billion Forecast, by Fuel Type 2020 & 2033
- Table 8: Global Port Equipment Market Revenue billion Forecast, by Country 2020 & 2033
- Table 9: United States Port Equipment Market Revenue (billion) Forecast, by Application 2020 & 2033
- Table 10: Canada Port Equipment Market Revenue (billion) Forecast, by Application 2020 & 2033
- Table 11: Rest of North America Port Equipment Market Revenue (billion) Forecast, by Application 2020 & 2033
- Table 12: Global Port Equipment Market Revenue billion Forecast, by Equipment Type 2020 & 2033
- Table 13: Global Port Equipment Market Revenue billion Forecast, by Application 2020 & 2033
- Table 14: Global Port Equipment Market Revenue billion Forecast, by Fuel Type 2020 & 2033
- Table 15: Global Port Equipment Market Revenue billion Forecast, by Country 2020 & 2033
- Table 16: Germany Port Equipment Market Revenue (billion) Forecast, by Application 2020 & 2033
- Table 17: United Kingdom Port Equipment Market Revenue (billion) Forecast, by Application 2020 & 2033
- Table 18: France Port Equipment Market Revenue (billion) Forecast, by Application 2020 & 2033
- Table 19: Rest of Europe Port Equipment Market Revenue (billion) Forecast, by Application 2020 & 2033
- Table 20: Global Port Equipment Market Revenue billion Forecast, by Equipment Type 2020 & 2033
- Table 21: Global Port Equipment Market Revenue billion Forecast, by Application 2020 & 2033
- Table 22: Global Port Equipment Market Revenue billion Forecast, by Fuel Type 2020 & 2033
- Table 23: Global Port Equipment Market Revenue billion Forecast, by Country 2020 & 2033
- Table 24: India Port Equipment Market Revenue (billion) Forecast, by Application 2020 & 2033
- Table 25: China Port Equipment Market Revenue (billion) Forecast, by Application 2020 & 2033
- Table 26: Japan Port Equipment Market Revenue (billion) Forecast, by Application 2020 & 2033
- Table 27: South Korea Port Equipment Market Revenue (billion) Forecast, by Application 2020 & 2033
- Table 28: Rest of Asia Pacific Port Equipment Market Revenue (billion) Forecast, by Application 2020 & 2033
- Table 29: Global Port Equipment Market Revenue billion Forecast, by Equipment Type 2020 & 2033
- Table 30: Global Port Equipment Market Revenue billion Forecast, by Application 2020 & 2033
- Table 31: Global Port Equipment Market Revenue billion Forecast, by Fuel Type 2020 & 2033
- Table 32: Global Port Equipment Market Revenue billion Forecast, by Country 2020 & 2033
- Table 33: Brazil Port Equipment Market Revenue (billion) Forecast, by Application 2020 & 2033
- Table 34: Mexico Port Equipment Market Revenue (billion) Forecast, by Application 2020 & 2033
- Table 35: United Arab Emirates Port Equipment Market Revenue (billion) Forecast, by Application 2020 & 2033
- Table 36: Other Countries Port Equipment Market Revenue (billion) Forecast, by Application 2020 & 2033
Frequently Asked Questions
1. What is the projected Compound Annual Growth Rate (CAGR) of the Port Equipment Market?
The projected CAGR is approximately 5.7%.
2. Which companies are prominent players in the Port Equipment Market?
Key companies in the market include ABB Ltd, Famur Famak S A, Liebherr Group, Sany Heavy Industry Co Ltd, KonecranesOyj, Cavote, TTS Group, Kalmar, CVS Ferrari, Hyster-Yale Group.
3. What are the main segments of the Port Equipment Market?
The market segments include Equipment Type, Application, Fuel Type.
4. Can you provide details about the market size?
The market size is estimated to be USD 20.4 billion as of 2022.
5. What are some drivers contributing to market growth?
Increasing disposable income and Low-interest rates from lenders increase the market demand.
6. What are the notable trends driving market growth?
Government Initiatives for Development of Ports are Driving the Market.
7. Are there any restraints impacting market growth?
High initial costs may obstruct the growth.
8. Can you provide examples of recent developments in the market?
N/A
9. What pricing options are available for accessing the report?
Pricing options include single-user, multi-user, and enterprise licenses priced at USD 4750, USD 5250, and USD 8750 respectively.
10. Is the market size provided in terms of value or volume?
The market size is provided in terms of value, measured in billion.
11. Are there any specific market keywords associated with the report?
Yes, the market keyword associated with the report is "Port Equipment Market," which aids in identifying and referencing the specific market segment covered.
12. How do I determine which pricing option suits my needs best?
The pricing options vary based on user requirements and access needs. Individual users may opt for single-user licenses, while businesses requiring broader access may choose multi-user or enterprise licenses for cost-effective access to the report.
13. Are there any additional resources or data provided in the Port Equipment Market report?
While the report offers comprehensive insights, it's advisable to review the specific contents or supplementary materials provided to ascertain if additional resources or data are available.
14. How can I stay updated on further developments or reports in the Port Equipment Market?
To stay informed about further developments, trends, and reports in the Port Equipment Market, consider subscribing to industry newsletters, following relevant companies and organizations, or regularly checking reputable industry news sources and publications.
Methodology
Step 1 - Identification of Relevant Samples Size from Population Database


Step 2 - Approaches for Defining Global Market Size (Value, Volume* & Price*)

Note*: In applicable scenarios
Step 3 - Data Sources
Primary Research
- Web Analytics
- Survey Reports
- Research Institute
- Latest Research Reports
- Opinion Leaders
Secondary Research
- Annual Reports
- White Paper
- Latest Press Release
- Industry Association
- Paid Database
- Investor Presentations

Step 4 - Data Triangulation
Involves using different sources of information in order to increase the validity of a study
These sources are likely to be stakeholders in a program - participants, other researchers, program staff, other community members, and so on.
Then we put all data in single framework & apply various statistical tools to find out the dynamic on the market.
During the analysis stage, feedback from the stakeholder groups would be compared to determine areas of agreement as well as areas of divergence