
Key Insights
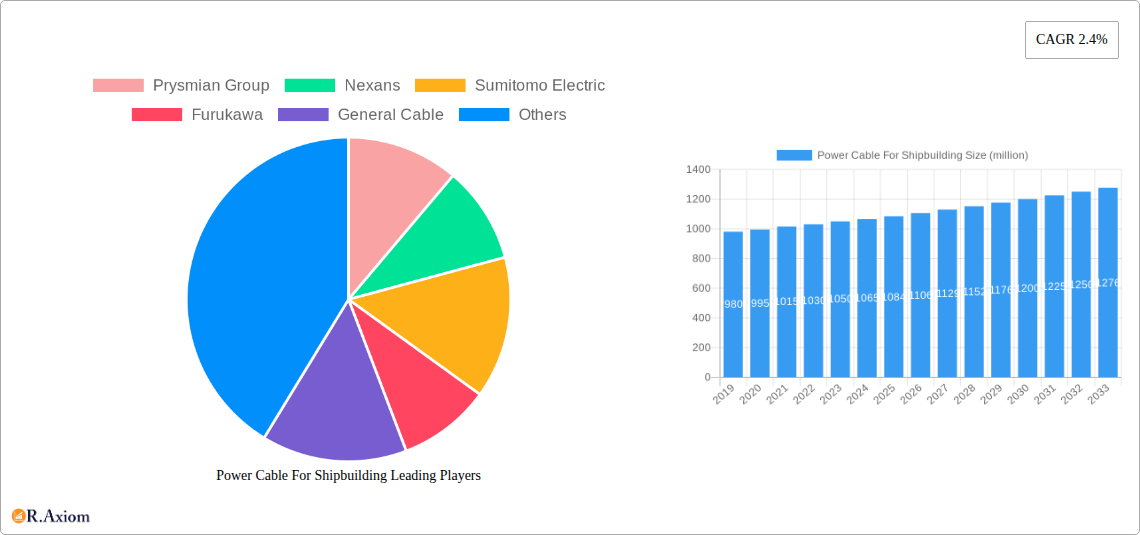
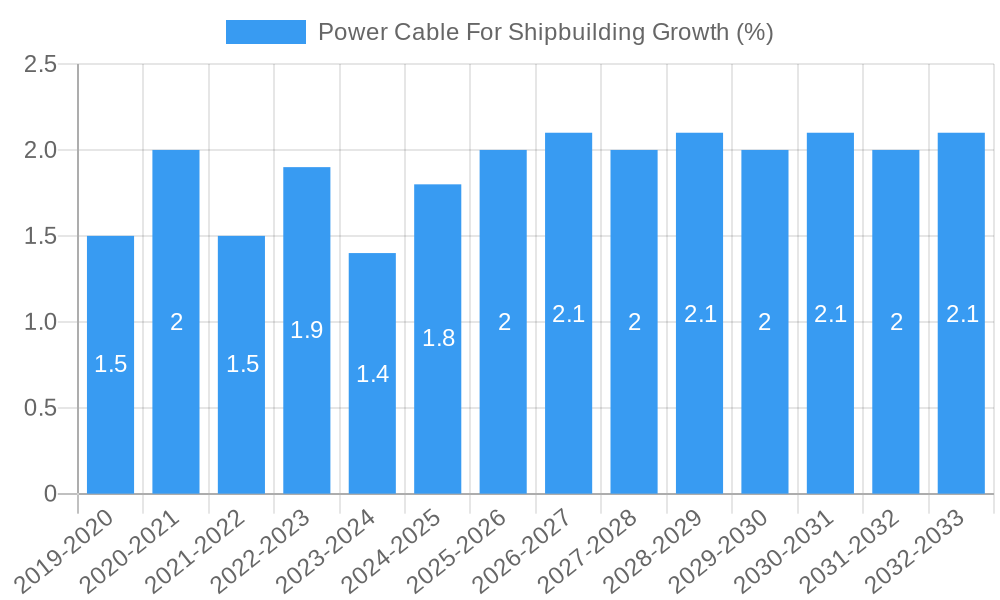
The global Power Cable for Shipbuilding market is poised for steady expansion, projected to reach a significant valuation by 2033. With a current estimated market size of approximately $1084 million in 2025, the industry is expected to grow at a Compound Annual Growth Rate (CAGR) of 2.4% during the forecast period of 2025-2033. This sustained growth is primarily fueled by the ongoing global demand for new vessel construction and the extensive retrofitting of existing fleets to meet evolving maritime regulations and technological advancements. Key drivers include the increasing construction of large-scale commercial vessels like container ships, tankers, and cruise liners, as well as the growing emphasis on enhanced safety, efficiency, and automation onboard ships, all of which necessitate advanced power cable solutions. Furthermore, the burgeoning offshore wind energy sector is a significant contributor, as specialized vessels are required for the installation and maintenance of wind turbines, demanding robust and high-performance power cables designed for harsh marine environments.
The market's trajectory is characterized by several key trends. A notable trend is the increasing adoption of advanced materials and technologies in power cable manufacturing to enhance durability, fire resistance, and insulation properties, crucial for the safety-critical shipbuilding environment. This includes a shift towards low-smoke, halogen-free cables that comply with stringent environmental and safety standards. Segmentation of the market by application reveals significant demand from propulsion systems, navigation and communication equipment, and onboard power distribution networks. Type segmentation likely highlights the dominance of specialized marine-grade power cables designed to withstand extreme conditions such as saltwater corrosion, vibration, and temperature fluctuations. While the market presents strong growth opportunities, certain restraints exist. These include the volatility in raw material prices, particularly copper, which can impact manufacturing costs and profitability. Additionally, the complex regulatory landscape and the high capital expenditure involved in shipbuilding can sometimes lead to project delays, indirectly affecting the demand for power cables. Nevertheless, the continuous innovation in cable technology and the persistent global maritime trade ensure a resilient and growing market for power cables in the shipbuilding industry.
This in-depth market research report offers a granular analysis of the global Power Cable for Shipbuilding market, covering the historical period from 2019 to 2024, a base year of 2025, and a comprehensive forecast period from 2025 to 2033. The study provides actionable insights for industry stakeholders, including manufacturers, suppliers, shipbuilders, and investors, focusing on key trends, drivers, challenges, and opportunities within this critical sector. With an estimated market size projected to reach XX million by 2033, this report is an indispensable resource for understanding market dynamics and strategic planning.
Power Cable For Shipbuilding Market Concentration & Innovation
The Power Cable for Shipbuilding market exhibits a XX% concentration, characterized by the presence of both large multinational corporations and a significant number of regional players. Leading companies such as Prysmian Group, Nexans, Sumitomo Electric, Furukawa, General Cable, Southwire, Leoni, LS Cable and Systems, Fujikura, Far East Cable, Jiangnan Cable, Baosheng Cable, Hitachi, Encore Wire, NKT Cables, Hengtong Group, and XX are vying for market share. Innovation is primarily driven by the increasing demand for high-performance, fire-retardant, and low-smoke cables to meet stringent maritime safety regulations. Technological advancements in materials science, insulation techniques, and cable design are crucial for enhanced durability and reliability in harsh marine environments. Regulatory frameworks, including IEC standards, SOLAS conventions, and regional maritime authorities, play a pivotal role in dictating product specifications and market entry. Product substitutes, such as armored cables and specialized wiring harnesses, exist but are often tailored for specific applications, maintaining the dominance of standard power cables. End-user trends indicate a growing preference for intelligent cabling systems that integrate monitoring and diagnostic capabilities for predictive maintenance, ultimately reducing operational downtime. Merger and acquisition (M&A) activities in the sector have seen significant deals valued at XX million, primarily aimed at expanding product portfolios, geographical reach, and technological capabilities.
Power Cable For Shipbuilding Industry Trends & Insights
The global Power Cable for Shipbuilding market is poised for robust growth, driven by a sustained increase in shipbuilding activities and the expanding fleet size worldwide. The Compound Annual Growth Rate (CAGR) is projected at XX% during the forecast period. Key market growth drivers include the escalating demand for new vessel construction, particularly in the offshore energy sector (oil and gas exploration, offshore wind farms) and the commercial shipping industry (container ships, tankers, cruise ships). Technological disruptions are transforming the industry, with a growing emphasis on high-voltage AC and DC power transmission cables capable of handling increased power demands on modern vessels. The development of advanced insulation materials, such as cross-linked polyethylene (XLPE) and ethylene propylene rubber (EPR), is enabling cables to withstand higher temperatures, increased mechanical stress, and corrosive marine environments, leading to enhanced product longevity and reduced maintenance costs. Consumer preferences are shifting towards more sustainable and energy-efficient cabling solutions that contribute to lower operational expenditures and a reduced environmental footprint. Shipowners and operators are increasingly seeking cables that comply with the latest international and national maritime safety and environmental regulations, driving the demand for certified and high-quality products. Competitive dynamics are intensifying, with manufacturers focusing on product differentiation through specialized features, advanced R&D, and strategic partnerships. Market penetration is expected to deepen as new shipbuilding hubs emerge and existing ones expand their capacity. The adoption of smart technologies and digitalization within the shipbuilding process also necessitates the use of sophisticated and reliable power distribution systems.
Dominant Markets & Segments in Power Cable For Shipbuilding
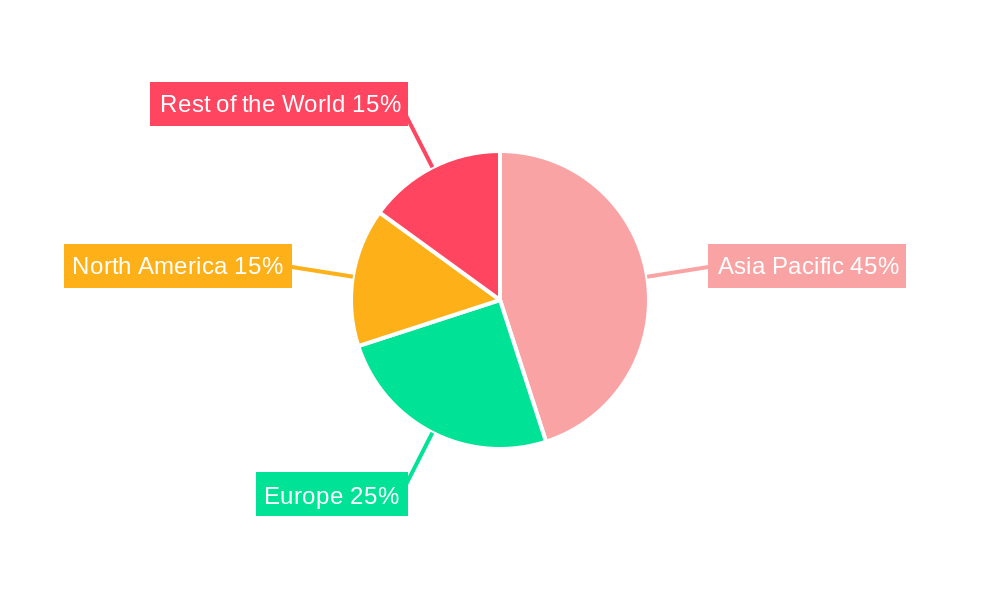
The Asia-Pacific region stands as the dominant market for power cables in shipbuilding, driven by its substantial shipbuilding infrastructure and a high volume of new vessel construction. Within this region, China emerges as the leading country, accounting for over XX% of global shipbuilding output. Key drivers for this dominance include favorable government policies supporting the maritime industry, substantial investments in port development and expansion, and the presence of major shipyards. The Application segment of Power Cables for Ship Propulsion and Auxiliary Systems holds significant sway, reflecting the core electrical needs of any vessel. This segment's dominance is fueled by the continuous demand for robust and reliable power delivery to engines, navigation systems, accommodation, and cargo handling equipment. Economic policies favoring shipbuilding exports and domestic fleet modernization have further bolstered this segment's growth. The Type segment of Marine Power Cables (Low Voltage and Medium Voltage) is the most prominent, catering to the diverse electrical requirements across a vessel. Low voltage cables are ubiquitous for general power distribution, lighting, and control systems, while medium voltage cables are essential for high-power applications like ship propulsion. The robust demand for new builds and retrofitting projects in the commercial and offshore sectors underpins the market penetration of these cable types. Infrastructure development, including the construction of new shipyards and the expansion of existing ones, further amplifies the demand for these essential components.
Power Cable For Shipbuilding Product Developments
Recent product developments in the power cable for shipbuilding market are characterized by innovations in flame retardancy, halogen-free materials, and enhanced mechanical strength. Companies are introducing cables with superior fire survival capabilities and low smoke emission properties, crucial for meeting stringent maritime safety standards. Advances in insulation and jacketing materials, such as specialized rubber compounds and thermoplastic elastomers, are providing increased resistance to oil, chemicals, abrasion, and extreme temperatures encountered in marine environments. These developments offer shipbuilders and owners improved safety, reliability, and longevity for their electrical systems, leading to reduced maintenance and operational costs. The market fit for these innovations is strong, aligning with the increasing complexity and power requirements of modern vessels.
Report Scope & Segmentation Analysis
This report segments the Power Cable for Shipbuilding market by Application: Ship Propulsion and Auxiliary Systems, Offshore and Industrial Applications, Communication and Navigation Systems, and Others. The Ship Propulsion and Auxiliary Systems segment, projected to reach XX million by 2033 with a CAGR of XX%, encompasses the critical power needs for vessel operation. The Offshore and Industrial Applications segment, estimated at XX million by 2033, is driven by the growing offshore energy sector.
The market is further segmented by Type: Low Voltage Power Cables, Medium Voltage Power Cables, and High Voltage Power Cables. The Low Voltage Power Cables segment, expected to reach XX million by 2033, represents the largest share due to its widespread use. The Medium Voltage Power Cables segment is projected to grow at a CAGR of XX%, driven by increasing power demands on larger vessels. The High Voltage Power Cables segment, though smaller, is anticipated to witness significant growth as electrification on ships advances.
Key Drivers of Power Cable For Shipbuilding Growth
The primary growth drivers for the Power Cable for Shipbuilding market are multifaceted. The robust expansion of the global maritime trade necessitates continuous fleet expansion and renewal, directly fueling demand for new vessels and their associated electrical systems. Government initiatives supporting shipbuilding and naval procurements worldwide provide a stable demand base. Technological advancements enabling higher power densities and more efficient energy transmission are driving the adoption of advanced power cables. Furthermore, increasingly stringent international safety and environmental regulations, such as those from the International Maritime Organization (IMO), mandate the use of high-performance, flame-retardant, and halogen-free cables, pushing manufacturers to innovate and upgrade their product offerings.
Challenges in the Power Cable For Shipbuilding Sector
Despite the positive outlook, the Power Cable for Shipbuilding sector faces several challenges. Volatility in raw material prices, particularly copper and aluminum, can significantly impact manufacturing costs and profit margins. Stringent and evolving regulatory landscapes require continuous investment in research and development to ensure compliance, creating a barrier for smaller players. Intense competition from established manufacturers and emerging low-cost producers can lead to price wars and reduced profitability. Supply chain disruptions, exacerbated by geopolitical events and logistical complexities, can lead to project delays and increased operational costs for shipbuilders. Furthermore, the specialized nature of marine cables requires skilled labor for installation and maintenance, posing a potential bottleneck.
Emerging Opportunities in Power Cable For Shipbuilding
Emerging opportunities in the Power Cable for Shipbuilding market lie in the growing demand for electrification in the maritime sector. The development of electric and hybrid-powered vessels presents a significant opportunity for high-voltage and specialized power cables. The expansion of the offshore renewable energy sector, particularly offshore wind farms, requires robust and reliable subsea power cables and associated onshore infrastructure. The increasing adoption of digitalization and smart technologies on ships creates demand for integrated cabling solutions that support data transmission and remote monitoring. Furthermore, the global push for sustainable shipping solutions drives demand for energy-efficient and environmentally friendly cable materials and manufacturing processes. Retrofitting older vessels with modern electrical systems also presents a considerable growth avenue.
Leading Players in the Power Cable For Shipbuilding Market
Prysmian Group Nexans Sumitomo Electric Furukawa General Cable Southwire Leoni LS Cable and Systems Fujikura Far East Cable Jiangnan Cable Baosheng Cable Hitachi Encore Wire NKT Cables Hengtong Group
Key Developments in Power Cable For Shipbuilding Industry
- 2023/09: Prysmian Group announced the acquisition of a new facility to expand its production capacity for marine cables, addressing increased demand.
- 2022/11: Nexans launched a new range of halogen-free, fire-retardant cables specifically designed for offshore renewable energy applications.
- 2021/06: Sumitomo Electric unveiled an advanced, highly flexible power cable with superior oil and chemical resistance for harsh marine environments.
- 2020/04: Furukawa Electric secured a major contract to supply power cables for a fleet of new LNG carriers.
- 2019/10: Leoni invested in advanced R&D for smart cabling solutions incorporating sensor technology for real-time monitoring.
Strategic Outlook for Power Cable For Shipbuilding Market
The strategic outlook for the Power Cable for Shipbuilding market is one of sustained growth and innovation. Companies that focus on developing high-performance, sustainable, and intelligent cabling solutions will be well-positioned to capitalize on market trends. Strategic partnerships with shipbuilders and technology providers will be crucial for co-developing tailored solutions and gaining early access to new projects. Investing in R&D to meet evolving safety and environmental regulations, particularly concerning electrification and emission reduction, will be paramount. Expansion into emerging maritime markets and the offshore energy sector presents significant opportunities for revenue growth. Furthermore, embracing digitalization in manufacturing and supply chain management will enhance operational efficiency and responsiveness to market demands, ensuring a competitive edge in the dynamic shipbuilding industry.
Power Cable For Shipbuilding Segmentation
-
1. Application
- 1.1. undefined
-
2. Type
- 2.1. undefined
Power Cable For Shipbuilding Segmentation By Geography
- 1. undefined
- 2. undefined
- 3. undefined
- 4. undefined
- 5. undefined
Power Cable For Shipbuilding REPORT HIGHLIGHTS
| Aspects | Details |
|---|---|
| Study Period | 2019-2033 |
| Base Year | 2024 |
| Estimated Year | 2025 |
| Forecast Period | 2025-2033 |
| Historical Period | 2019-2024 |
| Growth Rate | CAGR of 2.4% from 2019-2033 |
| Segmentation |
|
Table of Contents
- 1. Introduction
- 1.1. Research Scope
- 1.2. Market Segmentation
- 1.3. Research Methodology
- 1.4. Definitions and Assumptions
- 2. Executive Summary
- 2.1. Introduction
- 3. Market Dynamics
- 3.1. Introduction
- 3.2. Market Drivers
- 3.3. Market Restrains
- 3.4. Market Trends
- 4. Market Factor Analysis
- 4.1. Porters Five Forces
- 4.2. Supply/Value Chain
- 4.3. PESTEL analysis
- 4.4. Market Entropy
- 4.5. Patent/Trademark Analysis
- 5. Global Power Cable For Shipbuilding Analysis, Insights and Forecast, 2019-2031
- 5.1. Market Analysis, Insights and Forecast - by Application
- 5.1.1.
- 5.2. Market Analysis, Insights and Forecast - by Type
- 5.2.1.
- 5.3. Market Analysis, Insights and Forecast - by Region
- 5.3.1.
- 5.3.2.
- 5.3.3.
- 5.3.4.
- 5.3.5.
- 5.1. Market Analysis, Insights and Forecast - by Application
- 6. undefined Power Cable For Shipbuilding Analysis, Insights and Forecast, 2019-2031
- 6.1. Market Analysis, Insights and Forecast - by Application
- 6.1.1.
- 6.2. Market Analysis, Insights and Forecast - by Type
- 6.2.1.
- 6.1. Market Analysis, Insights and Forecast - by Application
- 7. undefined Power Cable For Shipbuilding Analysis, Insights and Forecast, 2019-2031
- 7.1. Market Analysis, Insights and Forecast - by Application
- 7.1.1.
- 7.2. Market Analysis, Insights and Forecast - by Type
- 7.2.1.
- 7.1. Market Analysis, Insights and Forecast - by Application
- 8. undefined Power Cable For Shipbuilding Analysis, Insights and Forecast, 2019-2031
- 8.1. Market Analysis, Insights and Forecast - by Application
- 8.1.1.
- 8.2. Market Analysis, Insights and Forecast - by Type
- 8.2.1.
- 8.1. Market Analysis, Insights and Forecast - by Application
- 9. undefined Power Cable For Shipbuilding Analysis, Insights and Forecast, 2019-2031
- 9.1. Market Analysis, Insights and Forecast - by Application
- 9.1.1.
- 9.2. Market Analysis, Insights and Forecast - by Type
- 9.2.1.
- 9.1. Market Analysis, Insights and Forecast - by Application
- 10. undefined Power Cable For Shipbuilding Analysis, Insights and Forecast, 2019-2031
- 10.1. Market Analysis, Insights and Forecast - by Application
- 10.1.1.
- 10.2. Market Analysis, Insights and Forecast - by Type
- 10.2.1.
- 10.1. Market Analysis, Insights and Forecast - by Application
- 11. Competitive Analysis
- 11.1. Global Market Share Analysis 2024
- 11.2. Company Profiles
- 11.2.1 Prysmian Group
- 11.2.1.1. Overview
- 11.2.1.2. Products
- 11.2.1.3. SWOT Analysis
- 11.2.1.4. Recent Developments
- 11.2.1.5. Financials (Based on Availability)
- 11.2.2 Nexans
- 11.2.2.1. Overview
- 11.2.2.2. Products
- 11.2.2.3. SWOT Analysis
- 11.2.2.4. Recent Developments
- 11.2.2.5. Financials (Based on Availability)
- 11.2.3 Sumitomo Electric
- 11.2.3.1. Overview
- 11.2.3.2. Products
- 11.2.3.3. SWOT Analysis
- 11.2.3.4. Recent Developments
- 11.2.3.5. Financials (Based on Availability)
- 11.2.4 Furukawa
- 11.2.4.1. Overview
- 11.2.4.2. Products
- 11.2.4.3. SWOT Analysis
- 11.2.4.4. Recent Developments
- 11.2.4.5. Financials (Based on Availability)
- 11.2.5 General Cable
- 11.2.5.1. Overview
- 11.2.5.2. Products
- 11.2.5.3. SWOT Analysis
- 11.2.5.4. Recent Developments
- 11.2.5.5. Financials (Based on Availability)
- 11.2.6 Southwire
- 11.2.6.1. Overview
- 11.2.6.2. Products
- 11.2.6.3. SWOT Analysis
- 11.2.6.4. Recent Developments
- 11.2.6.5. Financials (Based on Availability)
- 11.2.7 Leoni
- 11.2.7.1. Overview
- 11.2.7.2. Products
- 11.2.7.3. SWOT Analysis
- 11.2.7.4. Recent Developments
- 11.2.7.5. Financials (Based on Availability)
- 11.2.8 LS Cable and Systems
- 11.2.8.1. Overview
- 11.2.8.2. Products
- 11.2.8.3. SWOT Analysis
- 11.2.8.4. Recent Developments
- 11.2.8.5. Financials (Based on Availability)
- 11.2.9 Fujikura
- 11.2.9.1. Overview
- 11.2.9.2. Products
- 11.2.9.3. SWOT Analysis
- 11.2.9.4. Recent Developments
- 11.2.9.5. Financials (Based on Availability)
- 11.2.10 Far East Cable
- 11.2.10.1. Overview
- 11.2.10.2. Products
- 11.2.10.3. SWOT Analysis
- 11.2.10.4. Recent Developments
- 11.2.10.5. Financials (Based on Availability)
- 11.2.11 Jiangnan Cable
- 11.2.11.1. Overview
- 11.2.11.2. Products
- 11.2.11.3. SWOT Analysis
- 11.2.11.4. Recent Developments
- 11.2.11.5. Financials (Based on Availability)
- 11.2.12 Baosheng Cable
- 11.2.12.1. Overview
- 11.2.12.2. Products
- 11.2.12.3. SWOT Analysis
- 11.2.12.4. Recent Developments
- 11.2.12.5. Financials (Based on Availability)
- 11.2.13 Hitachi
- 11.2.13.1. Overview
- 11.2.13.2. Products
- 11.2.13.3. SWOT Analysis
- 11.2.13.4. Recent Developments
- 11.2.13.5. Financials (Based on Availability)
- 11.2.14 Encore Wire
- 11.2.14.1. Overview
- 11.2.14.2. Products
- 11.2.14.3. SWOT Analysis
- 11.2.14.4. Recent Developments
- 11.2.14.5. Financials (Based on Availability)
- 11.2.15 NKT Cables
- 11.2.15.1. Overview
- 11.2.15.2. Products
- 11.2.15.3. SWOT Analysis
- 11.2.15.4. Recent Developments
- 11.2.15.5. Financials (Based on Availability)
- 11.2.16 Hengtong Group
- 11.2.16.1. Overview
- 11.2.16.2. Products
- 11.2.16.3. SWOT Analysis
- 11.2.16.4. Recent Developments
- 11.2.16.5. Financials (Based on Availability)
- 11.2.1 Prysmian Group
List of Figures
- Figure 1: Global Power Cable For Shipbuilding Revenue Breakdown (million, %) by Region 2024 & 2032
- Figure 2: Global Power Cable For Shipbuilding Volume Breakdown (K, %) by Region 2024 & 2032
- Figure 3: undefined Power Cable For Shipbuilding Revenue (million), by Application 2024 & 2032
- Figure 4: undefined Power Cable For Shipbuilding Volume (K), by Application 2024 & 2032
- Figure 5: undefined Power Cable For Shipbuilding Revenue Share (%), by Application 2024 & 2032
- Figure 6: undefined Power Cable For Shipbuilding Volume Share (%), by Application 2024 & 2032
- Figure 7: undefined Power Cable For Shipbuilding Revenue (million), by Type 2024 & 2032
- Figure 8: undefined Power Cable For Shipbuilding Volume (K), by Type 2024 & 2032
- Figure 9: undefined Power Cable For Shipbuilding Revenue Share (%), by Type 2024 & 2032
- Figure 10: undefined Power Cable For Shipbuilding Volume Share (%), by Type 2024 & 2032
- Figure 11: undefined Power Cable For Shipbuilding Revenue (million), by Country 2024 & 2032
- Figure 12: undefined Power Cable For Shipbuilding Volume (K), by Country 2024 & 2032
- Figure 13: undefined Power Cable For Shipbuilding Revenue Share (%), by Country 2024 & 2032
- Figure 14: undefined Power Cable For Shipbuilding Volume Share (%), by Country 2024 & 2032
- Figure 15: undefined Power Cable For Shipbuilding Revenue (million), by Application 2024 & 2032
- Figure 16: undefined Power Cable For Shipbuilding Volume (K), by Application 2024 & 2032
- Figure 17: undefined Power Cable For Shipbuilding Revenue Share (%), by Application 2024 & 2032
- Figure 18: undefined Power Cable For Shipbuilding Volume Share (%), by Application 2024 & 2032
- Figure 19: undefined Power Cable For Shipbuilding Revenue (million), by Type 2024 & 2032
- Figure 20: undefined Power Cable For Shipbuilding Volume (K), by Type 2024 & 2032
- Figure 21: undefined Power Cable For Shipbuilding Revenue Share (%), by Type 2024 & 2032
- Figure 22: undefined Power Cable For Shipbuilding Volume Share (%), by Type 2024 & 2032
- Figure 23: undefined Power Cable For Shipbuilding Revenue (million), by Country 2024 & 2032
- Figure 24: undefined Power Cable For Shipbuilding Volume (K), by Country 2024 & 2032
- Figure 25: undefined Power Cable For Shipbuilding Revenue Share (%), by Country 2024 & 2032
- Figure 26: undefined Power Cable For Shipbuilding Volume Share (%), by Country 2024 & 2032
- Figure 27: undefined Power Cable For Shipbuilding Revenue (million), by Application 2024 & 2032
- Figure 28: undefined Power Cable For Shipbuilding Volume (K), by Application 2024 & 2032
- Figure 29: undefined Power Cable For Shipbuilding Revenue Share (%), by Application 2024 & 2032
- Figure 30: undefined Power Cable For Shipbuilding Volume Share (%), by Application 2024 & 2032
- Figure 31: undefined Power Cable For Shipbuilding Revenue (million), by Type 2024 & 2032
- Figure 32: undefined Power Cable For Shipbuilding Volume (K), by Type 2024 & 2032
- Figure 33: undefined Power Cable For Shipbuilding Revenue Share (%), by Type 2024 & 2032
- Figure 34: undefined Power Cable For Shipbuilding Volume Share (%), by Type 2024 & 2032
- Figure 35: undefined Power Cable For Shipbuilding Revenue (million), by Country 2024 & 2032
- Figure 36: undefined Power Cable For Shipbuilding Volume (K), by Country 2024 & 2032
- Figure 37: undefined Power Cable For Shipbuilding Revenue Share (%), by Country 2024 & 2032
- Figure 38: undefined Power Cable For Shipbuilding Volume Share (%), by Country 2024 & 2032
- Figure 39: undefined Power Cable For Shipbuilding Revenue (million), by Application 2024 & 2032
- Figure 40: undefined Power Cable For Shipbuilding Volume (K), by Application 2024 & 2032
- Figure 41: undefined Power Cable For Shipbuilding Revenue Share (%), by Application 2024 & 2032
- Figure 42: undefined Power Cable For Shipbuilding Volume Share (%), by Application 2024 & 2032
- Figure 43: undefined Power Cable For Shipbuilding Revenue (million), by Type 2024 & 2032
- Figure 44: undefined Power Cable For Shipbuilding Volume (K), by Type 2024 & 2032
- Figure 45: undefined Power Cable For Shipbuilding Revenue Share (%), by Type 2024 & 2032
- Figure 46: undefined Power Cable For Shipbuilding Volume Share (%), by Type 2024 & 2032
- Figure 47: undefined Power Cable For Shipbuilding Revenue (million), by Country 2024 & 2032
- Figure 48: undefined Power Cable For Shipbuilding Volume (K), by Country 2024 & 2032
- Figure 49: undefined Power Cable For Shipbuilding Revenue Share (%), by Country 2024 & 2032
- Figure 50: undefined Power Cable For Shipbuilding Volume Share (%), by Country 2024 & 2032
- Figure 51: undefined Power Cable For Shipbuilding Revenue (million), by Application 2024 & 2032
- Figure 52: undefined Power Cable For Shipbuilding Volume (K), by Application 2024 & 2032
- Figure 53: undefined Power Cable For Shipbuilding Revenue Share (%), by Application 2024 & 2032
- Figure 54: undefined Power Cable For Shipbuilding Volume Share (%), by Application 2024 & 2032
- Figure 55: undefined Power Cable For Shipbuilding Revenue (million), by Type 2024 & 2032
- Figure 56: undefined Power Cable For Shipbuilding Volume (K), by Type 2024 & 2032
- Figure 57: undefined Power Cable For Shipbuilding Revenue Share (%), by Type 2024 & 2032
- Figure 58: undefined Power Cable For Shipbuilding Volume Share (%), by Type 2024 & 2032
- Figure 59: undefined Power Cable For Shipbuilding Revenue (million), by Country 2024 & 2032
- Figure 60: undefined Power Cable For Shipbuilding Volume (K), by Country 2024 & 2032
- Figure 61: undefined Power Cable For Shipbuilding Revenue Share (%), by Country 2024 & 2032
- Figure 62: undefined Power Cable For Shipbuilding Volume Share (%), by Country 2024 & 2032
List of Tables
- Table 1: Global Power Cable For Shipbuilding Revenue million Forecast, by Region 2019 & 2032
- Table 2: Global Power Cable For Shipbuilding Volume K Forecast, by Region 2019 & 2032
- Table 3: Global Power Cable For Shipbuilding Revenue million Forecast, by Application 2019 & 2032
- Table 4: Global Power Cable For Shipbuilding Volume K Forecast, by Application 2019 & 2032
- Table 5: Global Power Cable For Shipbuilding Revenue million Forecast, by Type 2019 & 2032
- Table 6: Global Power Cable For Shipbuilding Volume K Forecast, by Type 2019 & 2032
- Table 7: Global Power Cable For Shipbuilding Revenue million Forecast, by Region 2019 & 2032
- Table 8: Global Power Cable For Shipbuilding Volume K Forecast, by Region 2019 & 2032
- Table 9: Global Power Cable For Shipbuilding Revenue million Forecast, by Application 2019 & 2032
- Table 10: Global Power Cable For Shipbuilding Volume K Forecast, by Application 2019 & 2032
- Table 11: Global Power Cable For Shipbuilding Revenue million Forecast, by Type 2019 & 2032
- Table 12: Global Power Cable For Shipbuilding Volume K Forecast, by Type 2019 & 2032
- Table 13: Global Power Cable For Shipbuilding Revenue million Forecast, by Country 2019 & 2032
- Table 14: Global Power Cable For Shipbuilding Volume K Forecast, by Country 2019 & 2032
- Table 15: Global Power Cable For Shipbuilding Revenue million Forecast, by Application 2019 & 2032
- Table 16: Global Power Cable For Shipbuilding Volume K Forecast, by Application 2019 & 2032
- Table 17: Global Power Cable For Shipbuilding Revenue million Forecast, by Type 2019 & 2032
- Table 18: Global Power Cable For Shipbuilding Volume K Forecast, by Type 2019 & 2032
- Table 19: Global Power Cable For Shipbuilding Revenue million Forecast, by Country 2019 & 2032
- Table 20: Global Power Cable For Shipbuilding Volume K Forecast, by Country 2019 & 2032
- Table 21: Global Power Cable For Shipbuilding Revenue million Forecast, by Application 2019 & 2032
- Table 22: Global Power Cable For Shipbuilding Volume K Forecast, by Application 2019 & 2032
- Table 23: Global Power Cable For Shipbuilding Revenue million Forecast, by Type 2019 & 2032
- Table 24: Global Power Cable For Shipbuilding Volume K Forecast, by Type 2019 & 2032
- Table 25: Global Power Cable For Shipbuilding Revenue million Forecast, by Country 2019 & 2032
- Table 26: Global Power Cable For Shipbuilding Volume K Forecast, by Country 2019 & 2032
- Table 27: Global Power Cable For Shipbuilding Revenue million Forecast, by Application 2019 & 2032
- Table 28: Global Power Cable For Shipbuilding Volume K Forecast, by Application 2019 & 2032
- Table 29: Global Power Cable For Shipbuilding Revenue million Forecast, by Type 2019 & 2032
- Table 30: Global Power Cable For Shipbuilding Volume K Forecast, by Type 2019 & 2032
- Table 31: Global Power Cable For Shipbuilding Revenue million Forecast, by Country 2019 & 2032
- Table 32: Global Power Cable For Shipbuilding Volume K Forecast, by Country 2019 & 2032
- Table 33: Global Power Cable For Shipbuilding Revenue million Forecast, by Application 2019 & 2032
- Table 34: Global Power Cable For Shipbuilding Volume K Forecast, by Application 2019 & 2032
- Table 35: Global Power Cable For Shipbuilding Revenue million Forecast, by Type 2019 & 2032
- Table 36: Global Power Cable For Shipbuilding Volume K Forecast, by Type 2019 & 2032
- Table 37: Global Power Cable For Shipbuilding Revenue million Forecast, by Country 2019 & 2032
- Table 38: Global Power Cable For Shipbuilding Volume K Forecast, by Country 2019 & 2032
Frequently Asked Questions
1. What is the projected Compound Annual Growth Rate (CAGR) of the Power Cable For Shipbuilding?
The projected CAGR is approximately 2.4%.
2. Which companies are prominent players in the Power Cable For Shipbuilding?
Key companies in the market include Prysmian Group, Nexans, Sumitomo Electric, Furukawa, General Cable, Southwire, Leoni, LS Cable and Systems, Fujikura, Far East Cable, Jiangnan Cable, Baosheng Cable, Hitachi, Encore Wire, NKT Cables, Hengtong Group.
3. What are the main segments of the Power Cable For Shipbuilding?
The market segments include Application, Type.
4. Can you provide details about the market size?
The market size is estimated to be USD 1084 million as of 2022.
5. What are some drivers contributing to market growth?
N/A
6. What are the notable trends driving market growth?
N/A
7. Are there any restraints impacting market growth?
N/A
8. Can you provide examples of recent developments in the market?
N/A
9. What pricing options are available for accessing the report?
Pricing options include single-user, multi-user, and enterprise licenses priced at USD 3950.00, USD 5925.00, and USD 7900.00 respectively.
10. Is the market size provided in terms of value or volume?
The market size is provided in terms of value, measured in million and volume, measured in K.
11. Are there any specific market keywords associated with the report?
Yes, the market keyword associated with the report is "Power Cable For Shipbuilding," which aids in identifying and referencing the specific market segment covered.
12. How do I determine which pricing option suits my needs best?
The pricing options vary based on user requirements and access needs. Individual users may opt for single-user licenses, while businesses requiring broader access may choose multi-user or enterprise licenses for cost-effective access to the report.
13. Are there any additional resources or data provided in the Power Cable For Shipbuilding report?
While the report offers comprehensive insights, it's advisable to review the specific contents or supplementary materials provided to ascertain if additional resources or data are available.
14. How can I stay updated on further developments or reports in the Power Cable For Shipbuilding?
To stay informed about further developments, trends, and reports in the Power Cable For Shipbuilding, consider subscribing to industry newsletters, following relevant companies and organizations, or regularly checking reputable industry news sources and publications.
Methodology
Step 1 - Identification of Relevant Samples Size from Population Database


Step 2 - Approaches for Defining Global Market Size (Value, Volume* & Price*)

Note*: In applicable scenarios
Step 3 - Data Sources
Primary Research
- Web Analytics
- Survey Reports
- Research Institute
- Latest Research Reports
- Opinion Leaders
Secondary Research
- Annual Reports
- White Paper
- Latest Press Release
- Industry Association
- Paid Database
- Investor Presentations

Step 4 - Data Triangulation
Involves using different sources of information in order to increase the validity of a study
These sources are likely to be stakeholders in a program - participants, other researchers, program staff, other community members, and so on.
Then we put all data in single framework & apply various statistical tools to find out the dynamic on the market.
During the analysis stage, feedback from the stakeholder groups would be compared to determine areas of agreement as well as areas of divergence


