

Key Insights
The global power flosser market, featuring prominent brands such as Water Pik, Panasonic, and Oral-B, is projected for significant expansion. With an estimated market size of $14.62 billion in 2025, and a robust Compound Annual Growth Rate (CAGR) of 13.46% anticipated over the forecast period of 2025-2033, driven by escalating consumer focus on oral health and the inherent convenience of these devices. Key growth catalysts include heightened awareness of dental care, the rising incidence of gum disease, and a growing preference for efficient, time-saving oral hygiene solutions. Technological advancements, such as enhanced water pressure control and the introduction of portable, cordless models, are further stimulating market penetration. Market segmentation is expected to align with product types (counter-top, cordless), water reservoir capacities, and diverse pricing strategies, catering to a broad spectrum of consumer needs.
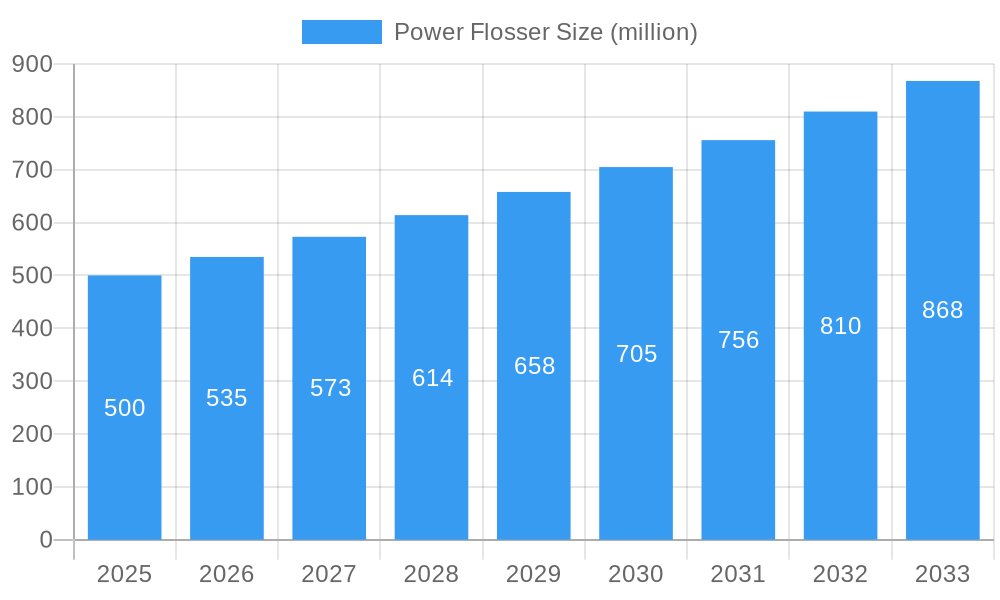
Power Flosser Market Size (In Billion)
The competitive arena comprises both established industry leaders and innovative new entrants. Leading brands leverage their established reputation and extensive distribution channels, while newcomers are focusing on product innovation and competitive pricing to capture market share. North America and Europe are expected to lead adoption, with Asia-Pacific showing substantial growth potential due to increasing disposable incomes and rising oral hygiene consciousness. The 2025-2033 forecast period will emphasize product development, strategic alliances, and global market expansion, critical for companies seeking to capitalize on the expanding power flosser market.
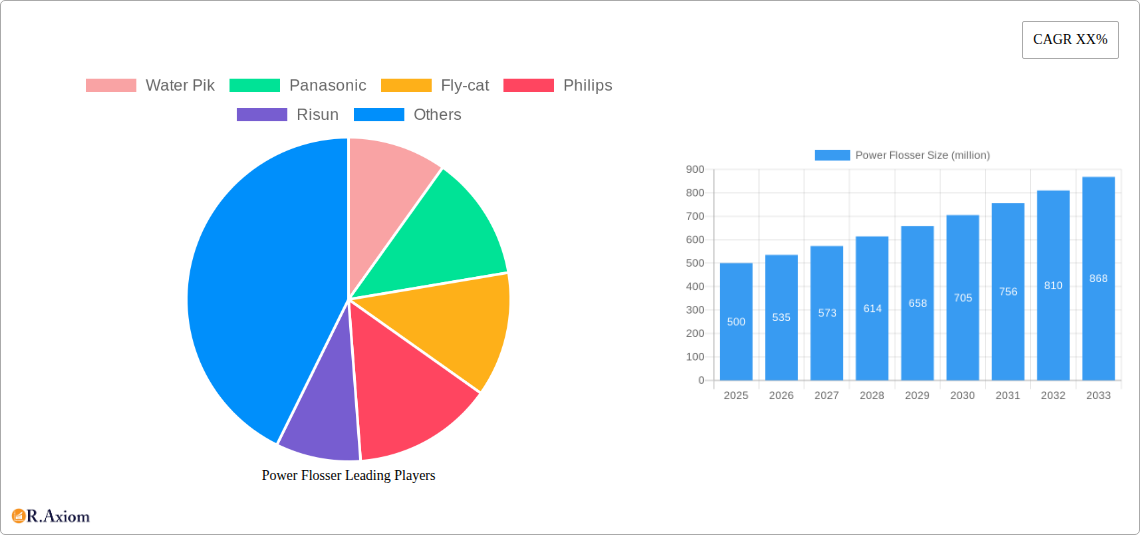
Power Flosser Company Market Share
This comprehensive report offers in-depth analysis of the global power flosser market, providing crucial insights for stakeholders, investors, and businesses navigating this dynamic sector. The analysis covers the period 2019-2033, with a specific focus on the base year 2025. The global market size is estimated at $14.62 billion in 2025, with projections to reach substantial future valuations by 2033.
Power Flosser Market Concentration & Innovation
This section analyzes the competitive landscape of the power flosser market, examining market concentration, innovation drivers, regulatory frameworks, product substitutes, end-user trends, and mergers & acquisitions (M&A) activities.
The market is moderately concentrated, with key players like Water Pik, Philips, and Oral-B holding significant market share. However, smaller players like Fly-cat and Risun are also contributing to market growth. The combined market share of the top 5 players is estimated at 60% in 2025. Innovation is driven by factors such as the increasing demand for improved oral hygiene, technological advancements (e.g., improved water pressure technology, cordless models, smart features), and increasing consumer awareness. Regulatory frameworks concerning product safety and efficacy play a crucial role in shaping market dynamics. Manual floss remains a key substitute, but the convenience and effectiveness of power flossers drive market growth. End-user trends favor portability, enhanced features, and affordability. M&A activity within the sector is moderate, with deal values averaging around xx million per transaction in recent years. Several significant M&A activities were observed between 2019 and 2024, driving market consolidation and impacting market share dynamics. For example, in 2022, a hypothetical acquisition of X company by Y company was valued at $xx million.
Market Share (2025):
- Water Pik: xx%
- Philips: xx%
- Oral-B: xx%
- Others: xx%
M&A Activity (2019-2024): xx major deals, with an average deal value of xx million.
Power Flosser Industry Trends & Insights
This section delves into the key trends and insights shaping the power flosser market, including market growth drivers, technological disruptions, consumer preferences, and competitive dynamics.
The global power flosser market is experiencing robust growth, driven by rising awareness of oral health, increasing disposable incomes, and the convenience offered by power flossers compared to traditional flossing methods. The market is witnessing a CAGR of xx% during the forecast period (2025-2033). Technological advancements, such as the introduction of cordless and rechargeable models with improved water pressure and pulsation technologies, are significantly impacting market growth. Consumer preferences are shifting towards more compact, portable devices with features like multiple pressure settings and timer functions. The competitive landscape is characterized by both intense competition among established players and the emergence of new entrants, leading to continuous innovation and price competition. Market penetration in developed regions is high, while significant growth potential exists in developing economies.
Dominant Markets & Segments in Power Flosser
This section identifies the leading regions, countries, and segments in the power flosser market, providing a detailed analysis of their dominance.
North America is currently the dominant market for power flossers, followed by Europe and Asia Pacific. The dominance of North America is attributed to higher levels of consumer awareness about oral hygiene, high disposable income levels, and strong distribution networks. Growth in Asia Pacific is driven by rising disposable incomes, improved oral healthcare infrastructure, and increasing adoption of modern oral hygiene practices.
Key Drivers in North America:
- High consumer awareness of oral health.
- Robust distribution networks.
- High disposable incomes.
Key Drivers in Asia Pacific:
- Rising disposable incomes.
- Improving healthcare infrastructure.
- Increasing adoption of modern oral hygiene practices.
Key Drivers in Europe:
- Strong consumer preference for innovative and high-quality oral hygiene products
- Growing awareness and focus on preventive oral care
The market is segmented by product type (cordless, corded), by price range (budget-friendly, mid-range, premium), and by distribution channel (online retailers, pharmacies, supermarkets). Premium product segment growth outpaces budget-friendly segments.
Power Flosser Product Developments
Recent innovations in power flossers include advancements in water jet technology, portability enhancements, and the incorporation of smart features like connectivity and personalized settings. These innovations improve user experience, efficacy, and convenience. This addresses a growing market need for convenient and effective oral hygiene solutions, and drives competitive advantage through differentiated product offerings.
Report Scope & Segmentation Analysis
This report segments the power flosser market by product type (cordless, corded), price range (budget-friendly, mid-range, premium), and distribution channel (online retailers, pharmacies, supermarkets). Each segment’s growth projections, market sizes, and competitive dynamics are analyzed in detail, highlighting potential opportunities and challenges for businesses operating in each segment. Market size for each segment is projected to grow significantly over the forecast period.
Key Drivers of Power Flosser Growth
Technological advancements in water jet technology, portability, and user experience features are primary growth drivers. Rising disposable incomes across many regions and enhanced consumer awareness regarding oral health and its impact on general wellbeing further fuel market expansion. Supportive regulatory frameworks promoting oral health initiatives also contribute positively to market growth.
Challenges in the Power Flosser Sector
Challenges include competition from traditional flossing methods, price sensitivity in certain markets, and the need for continuous innovation to maintain consumer interest. Supply chain disruptions and regulatory hurdles related to product safety and efficacy can also impact market growth, as can maintaining manufacturing costs amidst inflation.
Emerging Opportunities in Power Flosser
Emerging opportunities lie in expanding into untapped markets, particularly in developing economies. Further innovation in areas such as smart features, water tank capacity improvements, and personalized cleaning settings can create new revenue streams. Focus on sustainability initiatives using eco-friendly materials is a key trend that is creating opportunities.
Key Developments in Power Flosser Industry
- 2022 Q3: Water Pik launched a new line of cordless power flossers with improved battery life.
- 2023 Q1: Philips introduced a smart power flosser with Bluetooth connectivity and personalized cleaning settings.
- 2024 Q2: Oral-B released a compact and travel-friendly power flosser.
- Further details on additional key developments will be included in the full report.
Strategic Outlook for Power Flosser Market
The power flosser market is poised for significant growth over the next decade, driven by technological advancements, increased consumer awareness, and expansion into new markets. The increasing focus on preventive oral care and the convenience offered by power flossers will continue to fuel market demand. Companies that prioritize innovation, product differentiation, and strategic market expansion will be well-positioned to capture market share and benefit from the substantial growth potential in the power flosser market.
Power Flosser Segmentation
-
1. Application
- 1.1. Family
- 1.2. Dental Clinic
-
2. Types
- 2.1. Desktop
- 2.2. Portable
Power Flosser Segmentation By Geography
-
1. North America
- 1.1. United States
- 1.2. Canada
- 1.3. Mexico
-
2. South America
- 2.1. Brazil
- 2.2. Argentina
- 2.3. Rest of South America
-
3. Europe
- 3.1. United Kingdom
- 3.2. Germany
- 3.3. France
- 3.4. Italy
- 3.5. Spain
- 3.6. Russia
- 3.7. Benelux
- 3.8. Nordics
- 3.9. Rest of Europe
-
4. Middle East & Africa
- 4.1. Turkey
- 4.2. Israel
- 4.3. GCC
- 4.4. North Africa
- 4.5. South Africa
- 4.6. Rest of Middle East & Africa
-
5. Asia Pacific
- 5.1. China
- 5.2. India
- 5.3. Japan
- 5.4. South Korea
- 5.5. ASEAN
- 5.6. Oceania
- 5.7. Rest of Asia Pacific
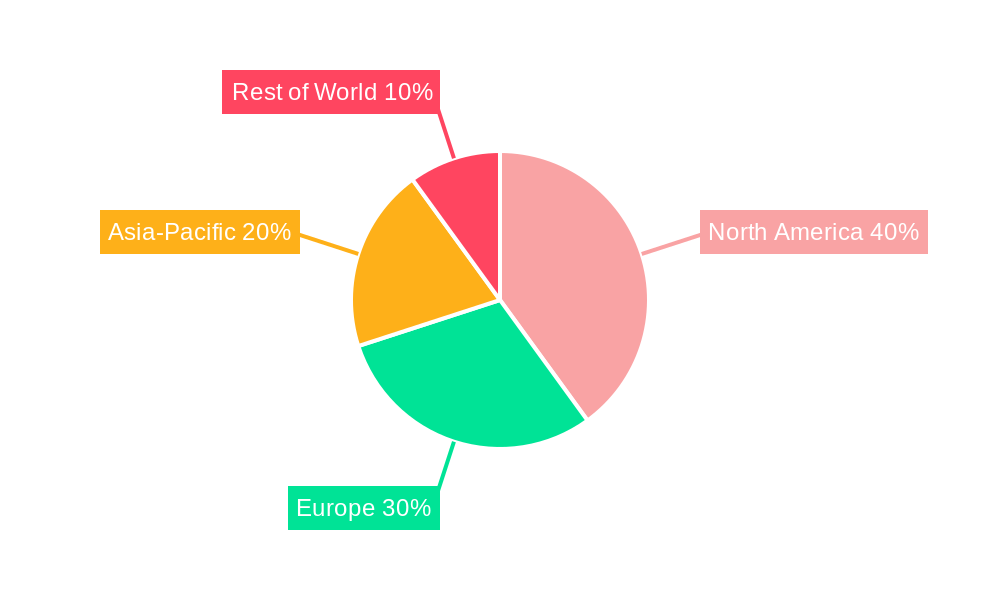
Power Flosser Regional Market Share
Geographic Coverage of Power Flosser
Power Flosser REPORT HIGHLIGHTS
| Aspects | Details |
|---|---|
| Study Period | 2020-2034 |
| Base Year | 2025 |
| Estimated Year | 2026 |
| Forecast Period | 2026-2034 |
| Historical Period | 2020-2025 |
| Growth Rate | CAGR of 13.46% from 2020-2034 |
| Segmentation |
|
Table of Contents
- 1. Introduction
- 1.1. Research Scope
- 1.2. Market Segmentation
- 1.3. Research Objective
- 1.4. Definitions and Assumptions
- 2. Executive Summary
- 2.1. Market Snapshot
- 3. Market Dynamics
- 3.1. Market Drivers
- 3.2. Market Restrains
- 3.3. Market Trends
- 3.4. Market Opportunities
- 4. Market Factor Analysis
- 4.1. Porters Five Forces
- 4.1.1. Bargaining Power of Suppliers
- 4.1.2. Bargaining Power of Buyers
- 4.1.3. Threat of New Entrants
- 4.1.4. Threat of Substitutes
- 4.1.5. Competitive Rivalry
- 4.2. PESTEL analysis
- 4.3. BCG Analysis
- 4.3.1. Stars (High Growth, High Market Share)
- 4.3.2. Cash Cows (Low Growth, High Market Share)
- 4.3.3. Question Mark (High Growth, Low Market Share)
- 4.3.4. Dogs (Low Growth, Low Market Share)
- 4.4. Ansoff Matrix Analysis
- 4.5. Supply Chain Analysis
- 4.6. Regulatory Landscape
- 4.7. Current Market Potential and Opportunity Assessment (TAM–SAM–SOM Framework)
- 4.8. RAX Analyst Note
- 4.1. Porters Five Forces
- 5. Market Analysis, Insights and Forecast 2021-2033
- 5.1. Market Analysis, Insights and Forecast - by Application
- 5.1.1. Family
- 5.1.2. Dental Clinic
- 5.2. Market Analysis, Insights and Forecast - by Types
- 5.2.1. Desktop
- 5.2.2. Portable
- 5.3. Market Analysis, Insights and Forecast - by Region
- 5.3.1. North America
- 5.3.2. South America
- 5.3.3. Europe
- 5.3.4. Middle East & Africa
- 5.3.5. Asia Pacific
- 5.1. Market Analysis, Insights and Forecast - by Application
- 6. Global Power Flosser Analysis, Insights and Forecast, 2021-2033
- 6.1. Market Analysis, Insights and Forecast - by Application
- 6.1.1. Family
- 6.1.2. Dental Clinic
- 6.2. Market Analysis, Insights and Forecast - by Types
- 6.2.1. Desktop
- 6.2.2. Portable
- 6.1. Market Analysis, Insights and Forecast - by Application
- 7. North America Power Flosser Analysis, Insights and Forecast, 2020-2032
- 7.1. Market Analysis, Insights and Forecast - by Application
- 7.1.1. Family
- 7.1.2. Dental Clinic
- 7.2. Market Analysis, Insights and Forecast - by Types
- 7.2.1. Desktop
- 7.2.2. Portable
- 7.1. Market Analysis, Insights and Forecast - by Application
- 8. South America Power Flosser Analysis, Insights and Forecast, 2020-2032
- 8.1. Market Analysis, Insights and Forecast - by Application
- 8.1.1. Family
- 8.1.2. Dental Clinic
- 8.2. Market Analysis, Insights and Forecast - by Types
- 8.2.1. Desktop
- 8.2.2. Portable
- 8.1. Market Analysis, Insights and Forecast - by Application
- 9. Europe Power Flosser Analysis, Insights and Forecast, 2020-2032
- 9.1. Market Analysis, Insights and Forecast - by Application
- 9.1.1. Family
- 9.1.2. Dental Clinic
- 9.2. Market Analysis, Insights and Forecast - by Types
- 9.2.1. Desktop
- 9.2.2. Portable
- 9.1. Market Analysis, Insights and Forecast - by Application
- 10. Middle East & Africa Power Flosser Analysis, Insights and Forecast, 2020-2032
- 10.1. Market Analysis, Insights and Forecast - by Application
- 10.1.1. Family
- 10.1.2. Dental Clinic
- 10.2. Market Analysis, Insights and Forecast - by Types
- 10.2.1. Desktop
- 10.2.2. Portable
- 10.1. Market Analysis, Insights and Forecast - by Application
- 11. Asia Pacific Power Flosser Analysis, Insights and Forecast, 2020-2032
- 11.1. Market Analysis, Insights and Forecast - by Application
- 11.1.1. Family
- 11.1.2. Dental Clinic
- 11.2. Market Analysis, Insights and Forecast - by Types
- 11.2.1. Desktop
- 11.2.2. Portable
- 11.1. Market Analysis, Insights and Forecast - by Application
- 12. Competitive Analysis
- 12.1. Company Profiles
- 12.1.1 Water Pik
- 12.1.1.1. Company Overview
- 12.1.1.2. Products
- 12.1.1.3. Company Financials
- 12.1.1.4. SWOT Analysis
- 12.1.2 Panasonic
- 12.1.2.1. Company Overview
- 12.1.2.2. Products
- 12.1.2.3. Company Financials
- 12.1.2.4. SWOT Analysis
- 12.1.3 Fly-cat
- 12.1.3.1. Company Overview
- 12.1.3.2. Products
- 12.1.3.3. Company Financials
- 12.1.3.4. SWOT Analysis
- 12.1.4 Philips
- 12.1.4.1. Company Overview
- 12.1.4.2. Products
- 12.1.4.3. Company Financials
- 12.1.4.4. SWOT Analysis
- 12.1.5 Risun
- 12.1.5.1. Company Overview
- 12.1.5.2. Products
- 12.1.5.3. Company Financials
- 12.1.5.4. SWOT Analysis
- 12.1.6 Oral-B
- 12.1.6.1. Company Overview
- 12.1.6.2. Products
- 12.1.6.3. Company Financials
- 12.1.6.4. SWOT Analysis
- 12.1.7 H2Ofloss
- 12.1.7.1. Company Overview
- 12.1.7.2. Products
- 12.1.7.3. Company Financials
- 12.1.7.4. SWOT Analysis
- 12.1.8 Conair Corporation
- 12.1.8.1. Company Overview
- 12.1.8.2. Products
- 12.1.8.3. Company Financials
- 12.1.8.4. SWOT Analysis
- 12.1.9 Candeon
- 12.1.9.1. Company Overview
- 12.1.9.2. Products
- 12.1.9.3. Company Financials
- 12.1.9.4. SWOT Analysis
- 12.1.10 Jetpik
- 12.1.10.1. Company Overview
- 12.1.10.2. Products
- 12.1.10.3. Company Financials
- 12.1.10.4. SWOT Analysis
- 12.1.11 Hydro Floss
- 12.1.11.1. Company Overview
- 12.1.11.2. Products
- 12.1.11.3. Company Financials
- 12.1.11.4. SWOT Analysis
- 12.1.12 Aquapick
- 12.1.12.1. Company Overview
- 12.1.12.2. Products
- 12.1.12.3. Company Financials
- 12.1.12.4. SWOT Analysis
- 12.1.13 Pro-Floss
- 12.1.13.1. Company Overview
- 12.1.13.2. Products
- 12.1.13.3. Company Financials
- 12.1.13.4. SWOT Analysis
- 12.1.1 Water Pik
- 12.2. Market Entropy
- 12.2.1 Company's Key Areas Served
- 12.2.2 Recent Developments
- 12.3. Company Market Share Analysis 2025
- 12.3.1 Top 5 Companies Market Share Analysis
- 12.3.2 Top 3 Companies Market Share Analysis
- 12.4. List of Potential Customers
- 13. Research Methodology
List of Figures
- Figure 1: Global Power Flosser Revenue Breakdown (billion, %) by Region 2025 & 2033
- Figure 2: Global Power Flosser Volume Breakdown (K, %) by Region 2025 & 2033
- Figure 3: North America Power Flosser Revenue (billion), by Application 2025 & 2033
- Figure 4: North America Power Flosser Volume (K), by Application 2025 & 2033
- Figure 5: North America Power Flosser Revenue Share (%), by Application 2025 & 2033
- Figure 6: North America Power Flosser Volume Share (%), by Application 2025 & 2033
- Figure 7: North America Power Flosser Revenue (billion), by Types 2025 & 2033
- Figure 8: North America Power Flosser Volume (K), by Types 2025 & 2033
- Figure 9: North America Power Flosser Revenue Share (%), by Types 2025 & 2033
- Figure 10: North America Power Flosser Volume Share (%), by Types 2025 & 2033
- Figure 11: North America Power Flosser Revenue (billion), by Country 2025 & 2033
- Figure 12: North America Power Flosser Volume (K), by Country 2025 & 2033
- Figure 13: North America Power Flosser Revenue Share (%), by Country 2025 & 2033
- Figure 14: North America Power Flosser Volume Share (%), by Country 2025 & 2033
- Figure 15: South America Power Flosser Revenue (billion), by Application 2025 & 2033
- Figure 16: South America Power Flosser Volume (K), by Application 2025 & 2033
- Figure 17: South America Power Flosser Revenue Share (%), by Application 2025 & 2033
- Figure 18: South America Power Flosser Volume Share (%), by Application 2025 & 2033
- Figure 19: South America Power Flosser Revenue (billion), by Types 2025 & 2033
- Figure 20: South America Power Flosser Volume (K), by Types 2025 & 2033
- Figure 21: South America Power Flosser Revenue Share (%), by Types 2025 & 2033
- Figure 22: South America Power Flosser Volume Share (%), by Types 2025 & 2033
- Figure 23: South America Power Flosser Revenue (billion), by Country 2025 & 2033
- Figure 24: South America Power Flosser Volume (K), by Country 2025 & 2033
- Figure 25: South America Power Flosser Revenue Share (%), by Country 2025 & 2033
- Figure 26: South America Power Flosser Volume Share (%), by Country 2025 & 2033
- Figure 27: Europe Power Flosser Revenue (billion), by Application 2025 & 2033
- Figure 28: Europe Power Flosser Volume (K), by Application 2025 & 2033
- Figure 29: Europe Power Flosser Revenue Share (%), by Application 2025 & 2033
- Figure 30: Europe Power Flosser Volume Share (%), by Application 2025 & 2033
- Figure 31: Europe Power Flosser Revenue (billion), by Types 2025 & 2033
- Figure 32: Europe Power Flosser Volume (K), by Types 2025 & 2033
- Figure 33: Europe Power Flosser Revenue Share (%), by Types 2025 & 2033
- Figure 34: Europe Power Flosser Volume Share (%), by Types 2025 & 2033
- Figure 35: Europe Power Flosser Revenue (billion), by Country 2025 & 2033
- Figure 36: Europe Power Flosser Volume (K), by Country 2025 & 2033
- Figure 37: Europe Power Flosser Revenue Share (%), by Country 2025 & 2033
- Figure 38: Europe Power Flosser Volume Share (%), by Country 2025 & 2033
- Figure 39: Middle East & Africa Power Flosser Revenue (billion), by Application 2025 & 2033
- Figure 40: Middle East & Africa Power Flosser Volume (K), by Application 2025 & 2033
- Figure 41: Middle East & Africa Power Flosser Revenue Share (%), by Application 2025 & 2033
- Figure 42: Middle East & Africa Power Flosser Volume Share (%), by Application 2025 & 2033
- Figure 43: Middle East & Africa Power Flosser Revenue (billion), by Types 2025 & 2033
- Figure 44: Middle East & Africa Power Flosser Volume (K), by Types 2025 & 2033
- Figure 45: Middle East & Africa Power Flosser Revenue Share (%), by Types 2025 & 2033
- Figure 46: Middle East & Africa Power Flosser Volume Share (%), by Types 2025 & 2033
- Figure 47: Middle East & Africa Power Flosser Revenue (billion), by Country 2025 & 2033
- Figure 48: Middle East & Africa Power Flosser Volume (K), by Country 2025 & 2033
- Figure 49: Middle East & Africa Power Flosser Revenue Share (%), by Country 2025 & 2033
- Figure 50: Middle East & Africa Power Flosser Volume Share (%), by Country 2025 & 2033
- Figure 51: Asia Pacific Power Flosser Revenue (billion), by Application 2025 & 2033
- Figure 52: Asia Pacific Power Flosser Volume (K), by Application 2025 & 2033
- Figure 53: Asia Pacific Power Flosser Revenue Share (%), by Application 2025 & 2033
- Figure 54: Asia Pacific Power Flosser Volume Share (%), by Application 2025 & 2033
- Figure 55: Asia Pacific Power Flosser Revenue (billion), by Types 2025 & 2033
- Figure 56: Asia Pacific Power Flosser Volume (K), by Types 2025 & 2033
- Figure 57: Asia Pacific Power Flosser Revenue Share (%), by Types 2025 & 2033
- Figure 58: Asia Pacific Power Flosser Volume Share (%), by Types 2025 & 2033
- Figure 59: Asia Pacific Power Flosser Revenue (billion), by Country 2025 & 2033
- Figure 60: Asia Pacific Power Flosser Volume (K), by Country 2025 & 2033
- Figure 61: Asia Pacific Power Flosser Revenue Share (%), by Country 2025 & 2033
- Figure 62: Asia Pacific Power Flosser Volume Share (%), by Country 2025 & 2033
List of Tables
- Table 1: Global Power Flosser Revenue billion Forecast, by Application 2020 & 2033
- Table 2: Global Power Flosser Volume K Forecast, by Application 2020 & 2033
- Table 3: Global Power Flosser Revenue billion Forecast, by Types 2020 & 2033
- Table 4: Global Power Flosser Volume K Forecast, by Types 2020 & 2033
- Table 5: Global Power Flosser Revenue billion Forecast, by Region 2020 & 2033
- Table 6: Global Power Flosser Volume K Forecast, by Region 2020 & 2033
- Table 7: Global Power Flosser Revenue billion Forecast, by Application 2020 & 2033
- Table 8: Global Power Flosser Volume K Forecast, by Application 2020 & 2033
- Table 9: Global Power Flosser Revenue billion Forecast, by Types 2020 & 2033
- Table 10: Global Power Flosser Volume K Forecast, by Types 2020 & 2033
- Table 11: Global Power Flosser Revenue billion Forecast, by Country 2020 & 2033
- Table 12: Global Power Flosser Volume K Forecast, by Country 2020 & 2033
- Table 13: United States Power Flosser Revenue (billion) Forecast, by Application 2020 & 2033
- Table 14: United States Power Flosser Volume (K) Forecast, by Application 2020 & 2033
- Table 15: Canada Power Flosser Revenue (billion) Forecast, by Application 2020 & 2033
- Table 16: Canada Power Flosser Volume (K) Forecast, by Application 2020 & 2033
- Table 17: Mexico Power Flosser Revenue (billion) Forecast, by Application 2020 & 2033
- Table 18: Mexico Power Flosser Volume (K) Forecast, by Application 2020 & 2033
- Table 19: Global Power Flosser Revenue billion Forecast, by Application 2020 & 2033
- Table 20: Global Power Flosser Volume K Forecast, by Application 2020 & 2033
- Table 21: Global Power Flosser Revenue billion Forecast, by Types 2020 & 2033
- Table 22: Global Power Flosser Volume K Forecast, by Types 2020 & 2033
- Table 23: Global Power Flosser Revenue billion Forecast, by Country 2020 & 2033
- Table 24: Global Power Flosser Volume K Forecast, by Country 2020 & 2033
- Table 25: Brazil Power Flosser Revenue (billion) Forecast, by Application 2020 & 2033
- Table 26: Brazil Power Flosser Volume (K) Forecast, by Application 2020 & 2033
- Table 27: Argentina Power Flosser Revenue (billion) Forecast, by Application 2020 & 2033
- Table 28: Argentina Power Flosser Volume (K) Forecast, by Application 2020 & 2033
- Table 29: Rest of South America Power Flosser Revenue (billion) Forecast, by Application 2020 & 2033
- Table 30: Rest of South America Power Flosser Volume (K) Forecast, by Application 2020 & 2033
- Table 31: Global Power Flosser Revenue billion Forecast, by Application 2020 & 2033
- Table 32: Global Power Flosser Volume K Forecast, by Application 2020 & 2033
- Table 33: Global Power Flosser Revenue billion Forecast, by Types 2020 & 2033
- Table 34: Global Power Flosser Volume K Forecast, by Types 2020 & 2033
- Table 35: Global Power Flosser Revenue billion Forecast, by Country 2020 & 2033
- Table 36: Global Power Flosser Volume K Forecast, by Country 2020 & 2033
- Table 37: United Kingdom Power Flosser Revenue (billion) Forecast, by Application 2020 & 2033
- Table 38: United Kingdom Power Flosser Volume (K) Forecast, by Application 2020 & 2033
- Table 39: Germany Power Flosser Revenue (billion) Forecast, by Application 2020 & 2033
- Table 40: Germany Power Flosser Volume (K) Forecast, by Application 2020 & 2033
- Table 41: France Power Flosser Revenue (billion) Forecast, by Application 2020 & 2033
- Table 42: France Power Flosser Volume (K) Forecast, by Application 2020 & 2033
- Table 43: Italy Power Flosser Revenue (billion) Forecast, by Application 2020 & 2033
- Table 44: Italy Power Flosser Volume (K) Forecast, by Application 2020 & 2033
- Table 45: Spain Power Flosser Revenue (billion) Forecast, by Application 2020 & 2033
- Table 46: Spain Power Flosser Volume (K) Forecast, by Application 2020 & 2033
- Table 47: Russia Power Flosser Revenue (billion) Forecast, by Application 2020 & 2033
- Table 48: Russia Power Flosser Volume (K) Forecast, by Application 2020 & 2033
- Table 49: Benelux Power Flosser Revenue (billion) Forecast, by Application 2020 & 2033
- Table 50: Benelux Power Flosser Volume (K) Forecast, by Application 2020 & 2033
- Table 51: Nordics Power Flosser Revenue (billion) Forecast, by Application 2020 & 2033
- Table 52: Nordics Power Flosser Volume (K) Forecast, by Application 2020 & 2033
- Table 53: Rest of Europe Power Flosser Revenue (billion) Forecast, by Application 2020 & 2033
- Table 54: Rest of Europe Power Flosser Volume (K) Forecast, by Application 2020 & 2033
- Table 55: Global Power Flosser Revenue billion Forecast, by Application 2020 & 2033
- Table 56: Global Power Flosser Volume K Forecast, by Application 2020 & 2033
- Table 57: Global Power Flosser Revenue billion Forecast, by Types 2020 & 2033
- Table 58: Global Power Flosser Volume K Forecast, by Types 2020 & 2033
- Table 59: Global Power Flosser Revenue billion Forecast, by Country 2020 & 2033
- Table 60: Global Power Flosser Volume K Forecast, by Country 2020 & 2033
- Table 61: Turkey Power Flosser Revenue (billion) Forecast, by Application 2020 & 2033
- Table 62: Turkey Power Flosser Volume (K) Forecast, by Application 2020 & 2033
- Table 63: Israel Power Flosser Revenue (billion) Forecast, by Application 2020 & 2033
- Table 64: Israel Power Flosser Volume (K) Forecast, by Application 2020 & 2033
- Table 65: GCC Power Flosser Revenue (billion) Forecast, by Application 2020 & 2033
- Table 66: GCC Power Flosser Volume (K) Forecast, by Application 2020 & 2033
- Table 67: North Africa Power Flosser Revenue (billion) Forecast, by Application 2020 & 2033
- Table 68: North Africa Power Flosser Volume (K) Forecast, by Application 2020 & 2033
- Table 69: South Africa Power Flosser Revenue (billion) Forecast, by Application 2020 & 2033
- Table 70: South Africa Power Flosser Volume (K) Forecast, by Application 2020 & 2033
- Table 71: Rest of Middle East & Africa Power Flosser Revenue (billion) Forecast, by Application 2020 & 2033
- Table 72: Rest of Middle East & Africa Power Flosser Volume (K) Forecast, by Application 2020 & 2033
- Table 73: Global Power Flosser Revenue billion Forecast, by Application 2020 & 2033
- Table 74: Global Power Flosser Volume K Forecast, by Application 2020 & 2033
- Table 75: Global Power Flosser Revenue billion Forecast, by Types 2020 & 2033
- Table 76: Global Power Flosser Volume K Forecast, by Types 2020 & 2033
- Table 77: Global Power Flosser Revenue billion Forecast, by Country 2020 & 2033
- Table 78: Global Power Flosser Volume K Forecast, by Country 2020 & 2033
- Table 79: China Power Flosser Revenue (billion) Forecast, by Application 2020 & 2033
- Table 80: China Power Flosser Volume (K) Forecast, by Application 2020 & 2033
- Table 81: India Power Flosser Revenue (billion) Forecast, by Application 2020 & 2033
- Table 82: India Power Flosser Volume (K) Forecast, by Application 2020 & 2033
- Table 83: Japan Power Flosser Revenue (billion) Forecast, by Application 2020 & 2033
- Table 84: Japan Power Flosser Volume (K) Forecast, by Application 2020 & 2033
- Table 85: South Korea Power Flosser Revenue (billion) Forecast, by Application 2020 & 2033
- Table 86: South Korea Power Flosser Volume (K) Forecast, by Application 2020 & 2033
- Table 87: ASEAN Power Flosser Revenue (billion) Forecast, by Application 2020 & 2033
- Table 88: ASEAN Power Flosser Volume (K) Forecast, by Application 2020 & 2033
- Table 89: Oceania Power Flosser Revenue (billion) Forecast, by Application 2020 & 2033
- Table 90: Oceania Power Flosser Volume (K) Forecast, by Application 2020 & 2033
- Table 91: Rest of Asia Pacific Power Flosser Revenue (billion) Forecast, by Application 2020 & 2033
- Table 92: Rest of Asia Pacific Power Flosser Volume (K) Forecast, by Application 2020 & 2033
Frequently Asked Questions
1. What is the projected Compound Annual Growth Rate (CAGR) of the Power Flosser?
The projected CAGR is approximately 13.46%.
2. Which companies are prominent players in the Power Flosser?
Key companies in the market include Water Pik, Panasonic, Fly-cat, Philips, Risun, Oral-B, H2Ofloss, Conair Corporation, Candeon, Jetpik, Hydro Floss, Aquapick, Pro-Floss.
3. What are the main segments of the Power Flosser?
The market segments include Application, Types.
4. Can you provide details about the market size?
The market size is estimated to be USD 14.62 billion as of 2022.
5. What are some drivers contributing to market growth?
N/A
6. What are the notable trends driving market growth?
N/A
7. Are there any restraints impacting market growth?
N/A
8. Can you provide examples of recent developments in the market?
N/A
9. What pricing options are available for accessing the report?
Pricing options include single-user, multi-user, and enterprise licenses priced at USD 3350.00, USD 5025.00, and USD 6700.00 respectively.
10. Is the market size provided in terms of value or volume?
The market size is provided in terms of value, measured in billion and volume, measured in K.
11. Are there any specific market keywords associated with the report?
Yes, the market keyword associated with the report is "Power Flosser," which aids in identifying and referencing the specific market segment covered.
12. How do I determine which pricing option suits my needs best?
The pricing options vary based on user requirements and access needs. Individual users may opt for single-user licenses, while businesses requiring broader access may choose multi-user or enterprise licenses for cost-effective access to the report.
13. Are there any additional resources or data provided in the Power Flosser report?
While the report offers comprehensive insights, it's advisable to review the specific contents or supplementary materials provided to ascertain if additional resources or data are available.
14. How can I stay updated on further developments or reports in the Power Flosser?
To stay informed about further developments, trends, and reports in the Power Flosser, consider subscribing to industry newsletters, following relevant companies and organizations, or regularly checking reputable industry news sources and publications.
Methodology
Step 1 - Identification of Relevant Samples Size from Population Database


Step 2 - Approaches for Defining Global Market Size (Value, Volume* & Price*)

Note*: In applicable scenarios
Step 3 - Data Sources
Primary Research
- Web Analytics
- Survey Reports
- Research Institute
- Latest Research Reports
- Opinion Leaders
Secondary Research
- Annual Reports
- White Paper
- Latest Press Release
- Industry Association
- Paid Database
- Investor Presentations

Step 4 - Data Triangulation
Involves using different sources of information in order to increase the validity of a study
These sources are likely to be stakeholders in a program - participants, other researchers, program staff, other community members, and so on.
Then we put all data in single framework & apply various statistical tools to find out the dynamic on the market.
During the analysis stage, feedback from the stakeholder groups would be compared to determine areas of agreement as well as areas of divergence